Interaction position, time, and energy resolution in organic scintillator bars with dual-ended readout
Melinda Sweany, Aline Galindo-Tellez, Joshua Brown, Erik Brubaker,, Ryan Dorrill, Andrew Druetzler, Nathaniel Kaneshige, John Learned, Kurtis, Nishimura, Wonseok Bae

TL;DR
This study evaluates the position, timing, and energy resolution of plastic scintillator bars with dual-ended silicon photomultiplier readout, demonstrating their suitability for neutron scatter cameras with specific resolution requirements.
Contribution
It provides experimental measurements of resolution capabilities and systematic variability in dual-ended readout scintillator bars for neutron detection applications.
Findings
Achieved ~10 mm position resolution with 5x5x190 mm^3 EJ-204 bars.
Obtained ~1 ns timing resolution suitable for neutron applications.
Identified that timing difference is less affected by systematic variations than charge ratio.
Abstract
We report on the position, timing, and energy resolution of a range of plastic scintillator bars and reflector treatments using dual-ended silicon photomultiplier readout. These measurements are motivated by the upcoming construction of an optically segmented single-volume neutron scatter camera, in which neutron elastic scattering off of hydrogen is used to kinematically reconstruct the source direction and energy of an incoming neutron. For this application, interaction position resolutions of about 10 mm and timing resolutions of about 1 ns are necessary to achieve the desired efficiency for fission-energy neutrons. The results presented here indicate that this is achievable with an array of bars of EJ-204 scintillator wrapped in Teflon tape, read out with SensL's J-series silicon photomultipliers. With two independent…
Click any figure to enlarge with its caption.
 Figure 10
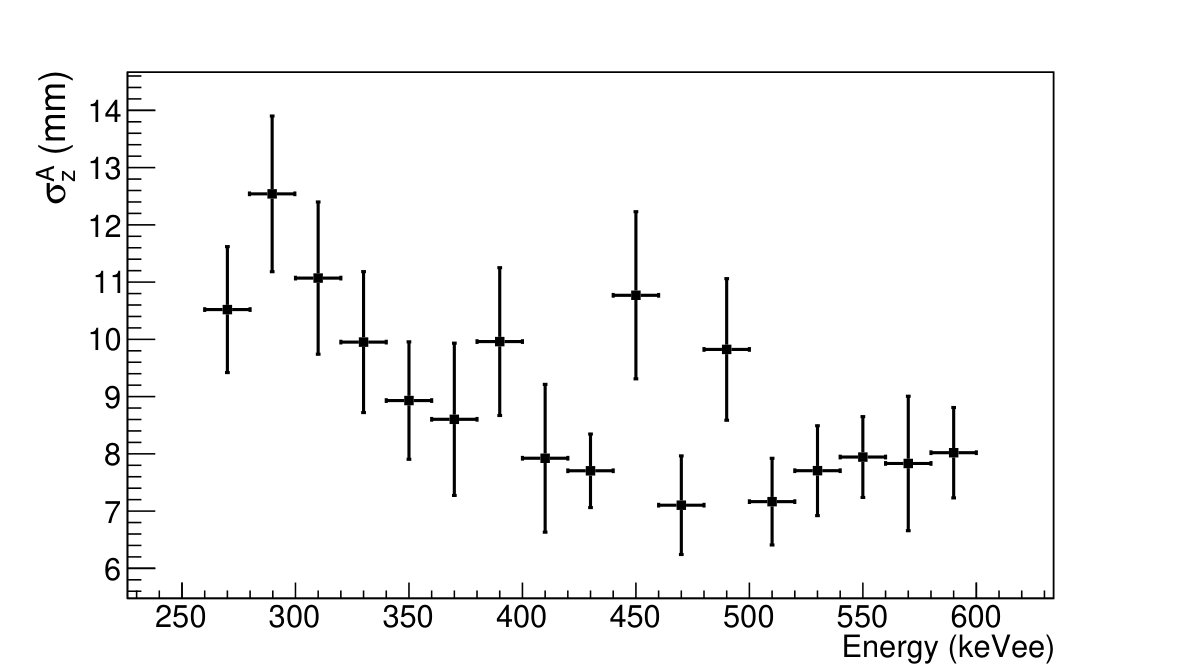 Figure 11
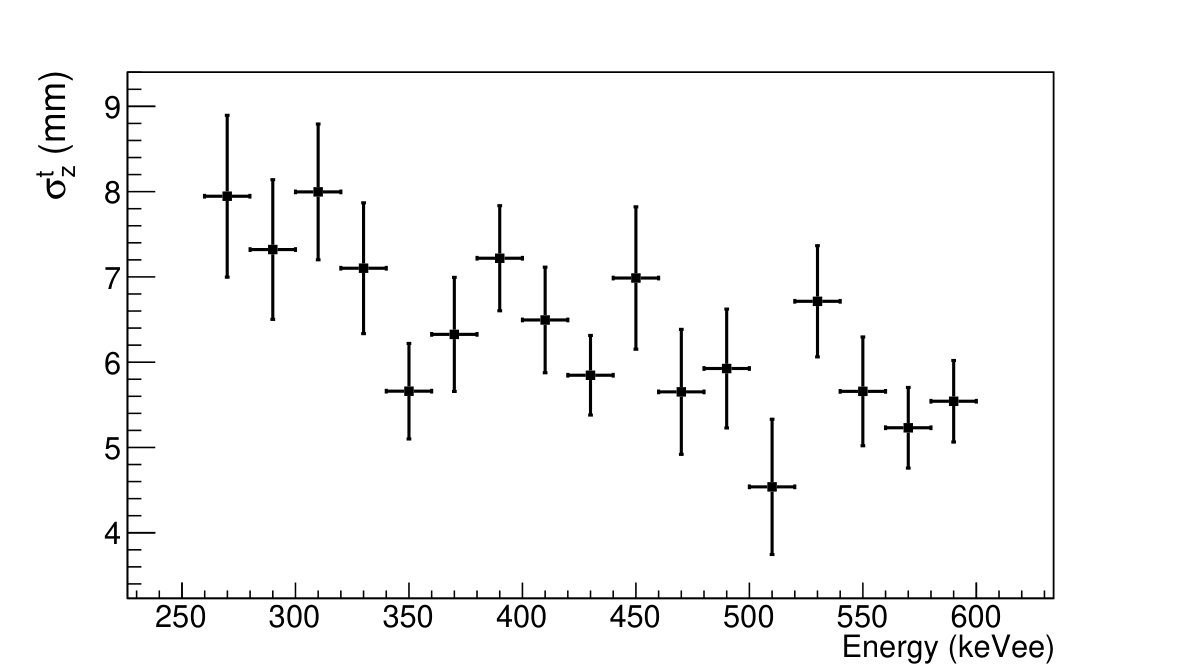 Figure 11
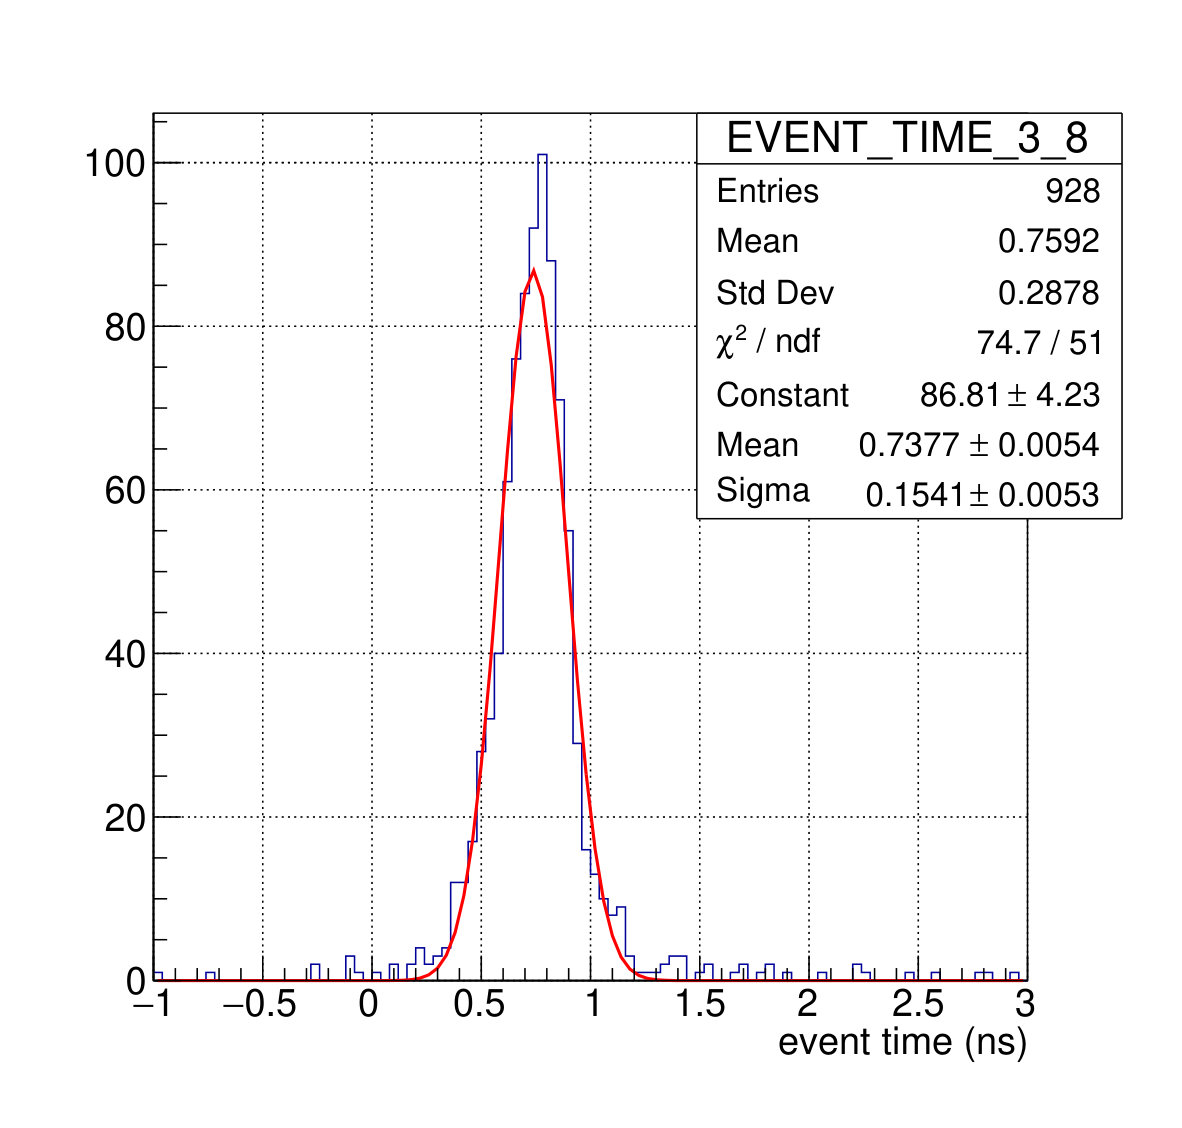 Figure 12
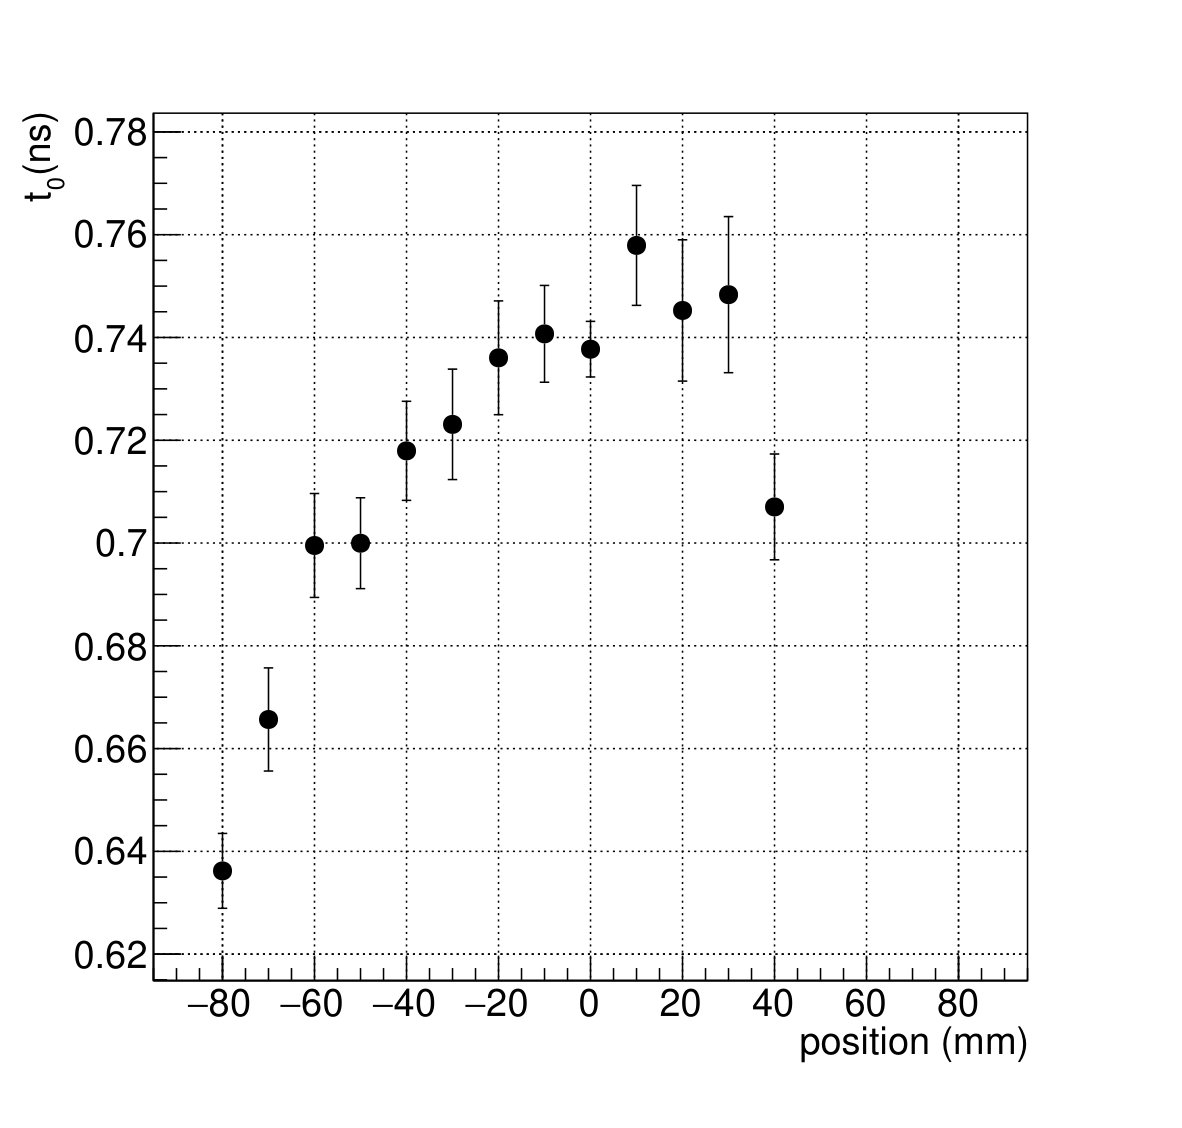 Figure 12
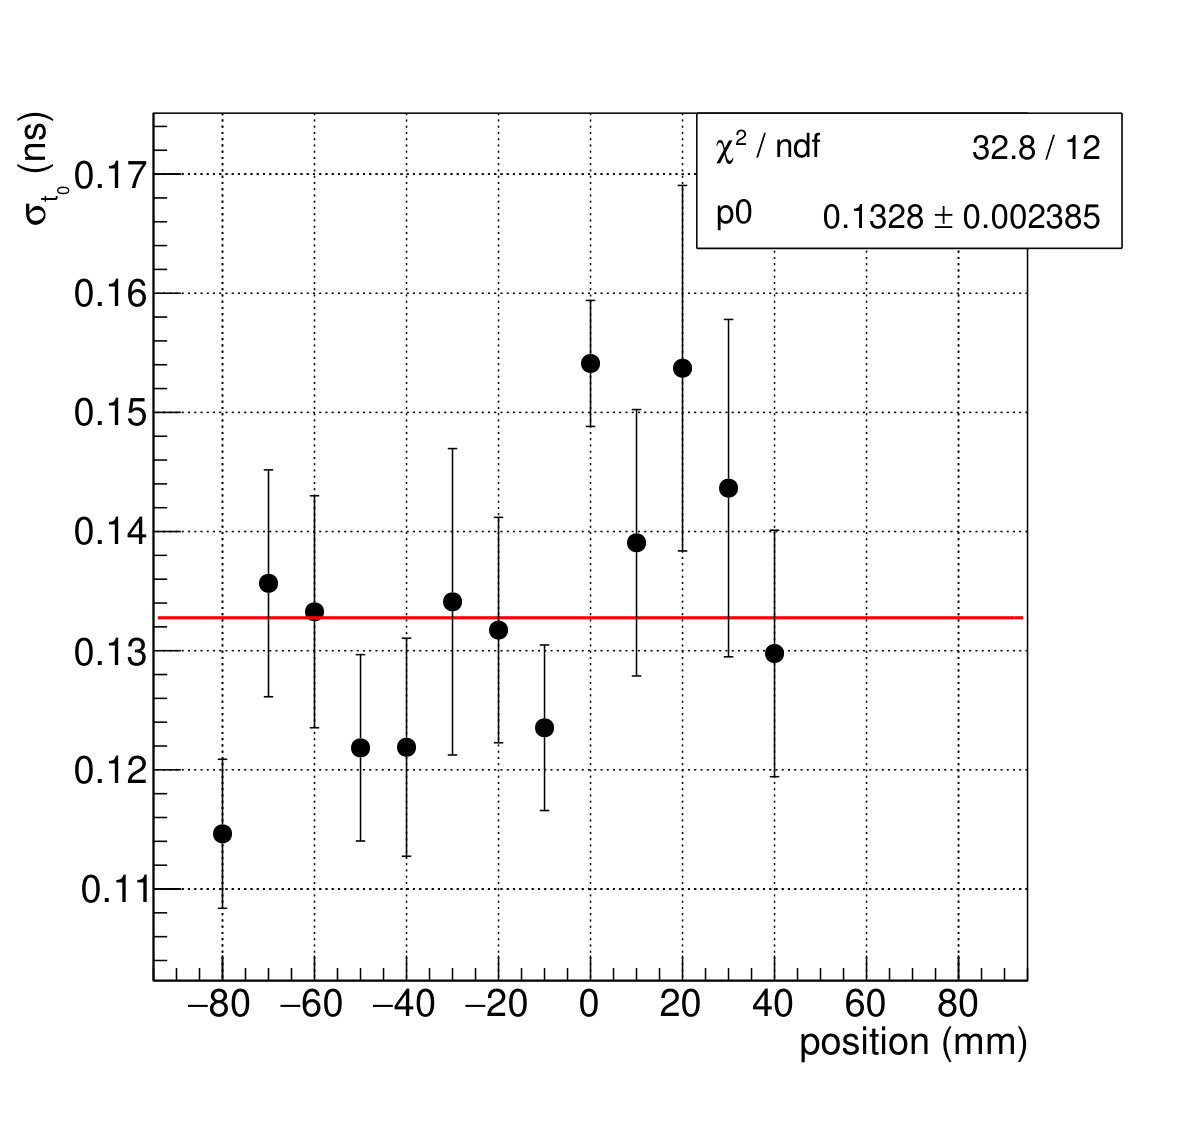 Figure 12
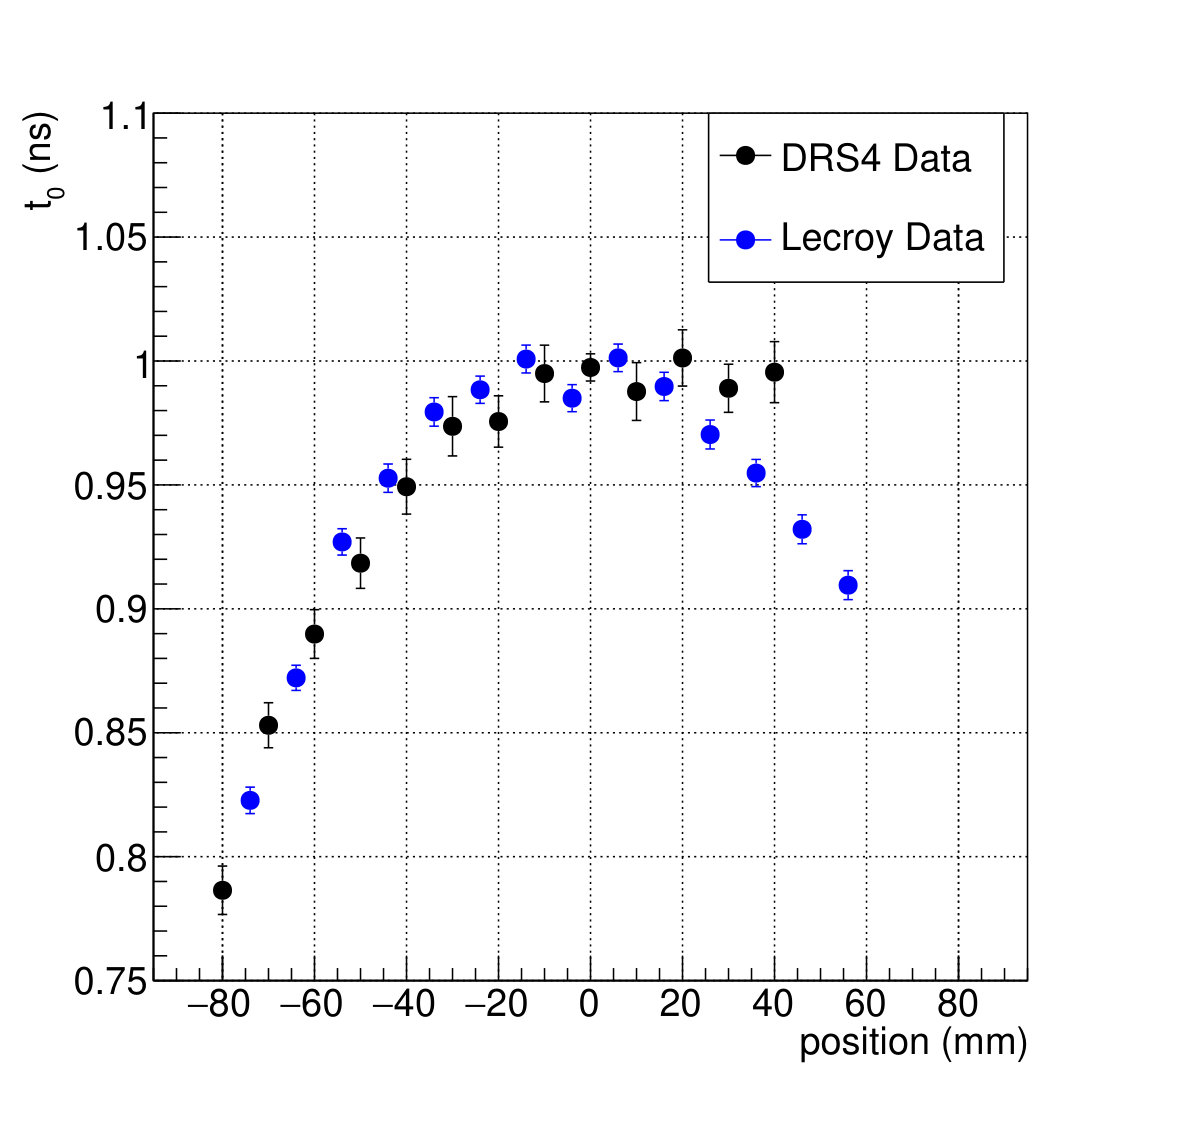 Figure 13
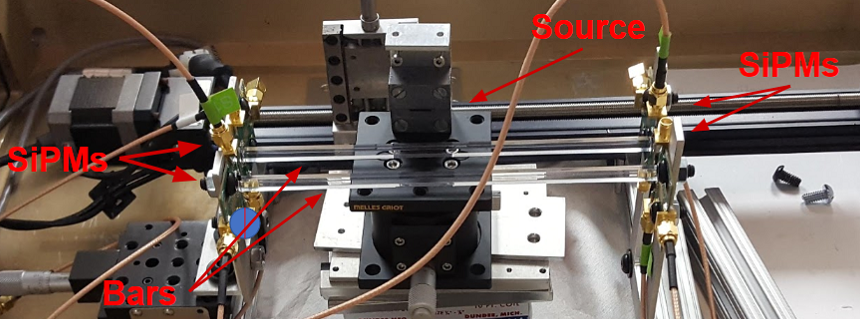 Figure 14
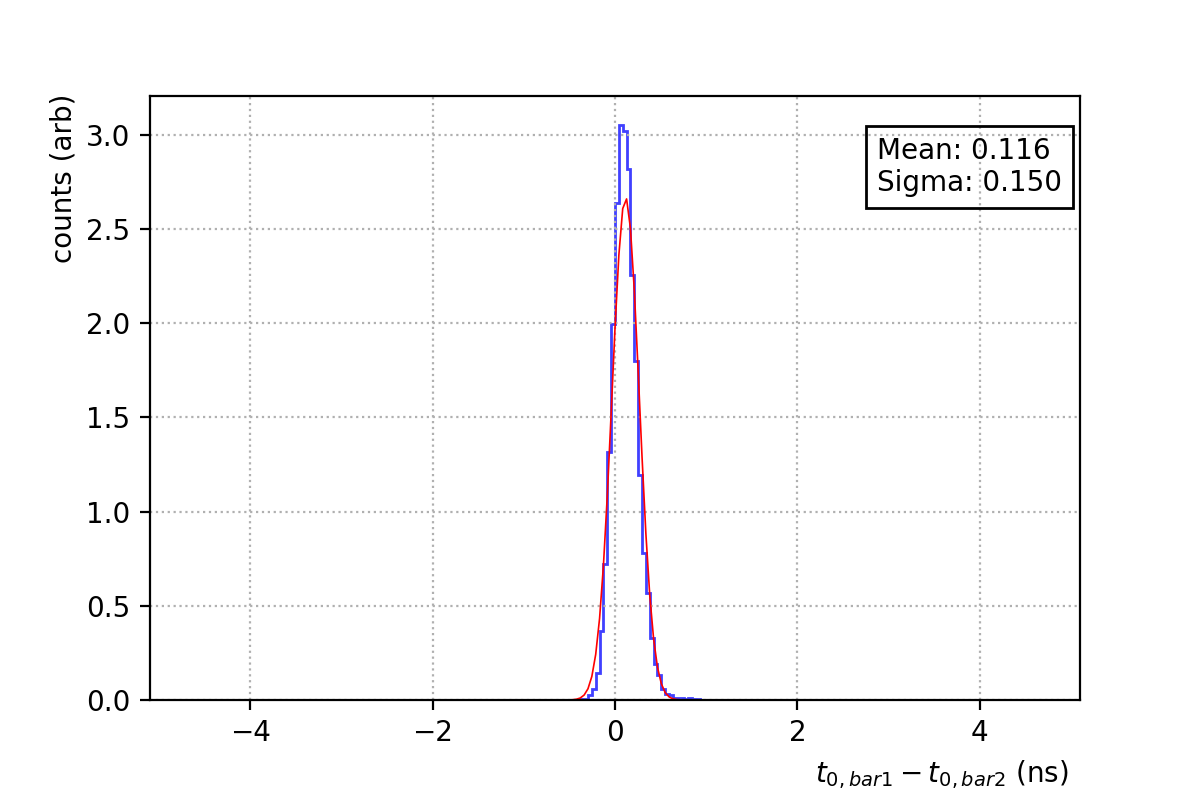 Figure 15
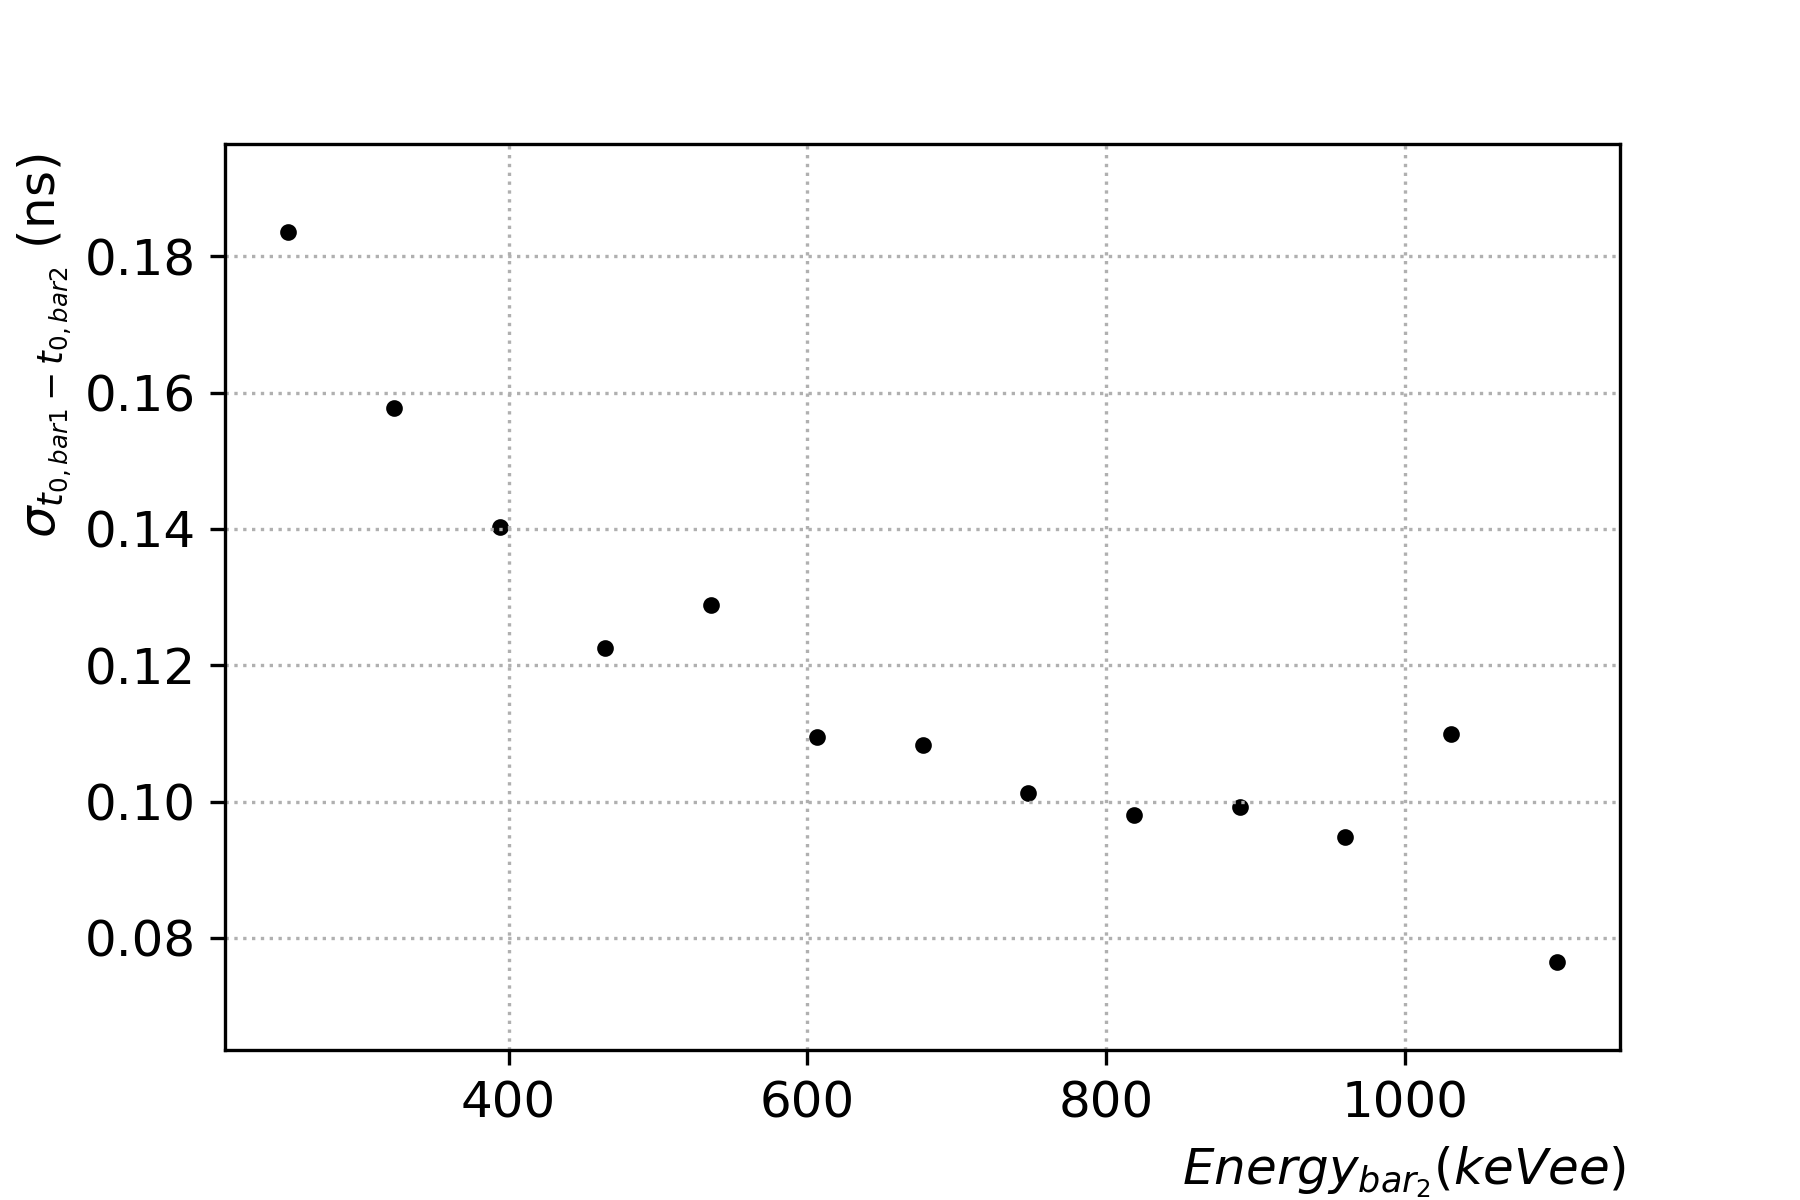 Figure 15
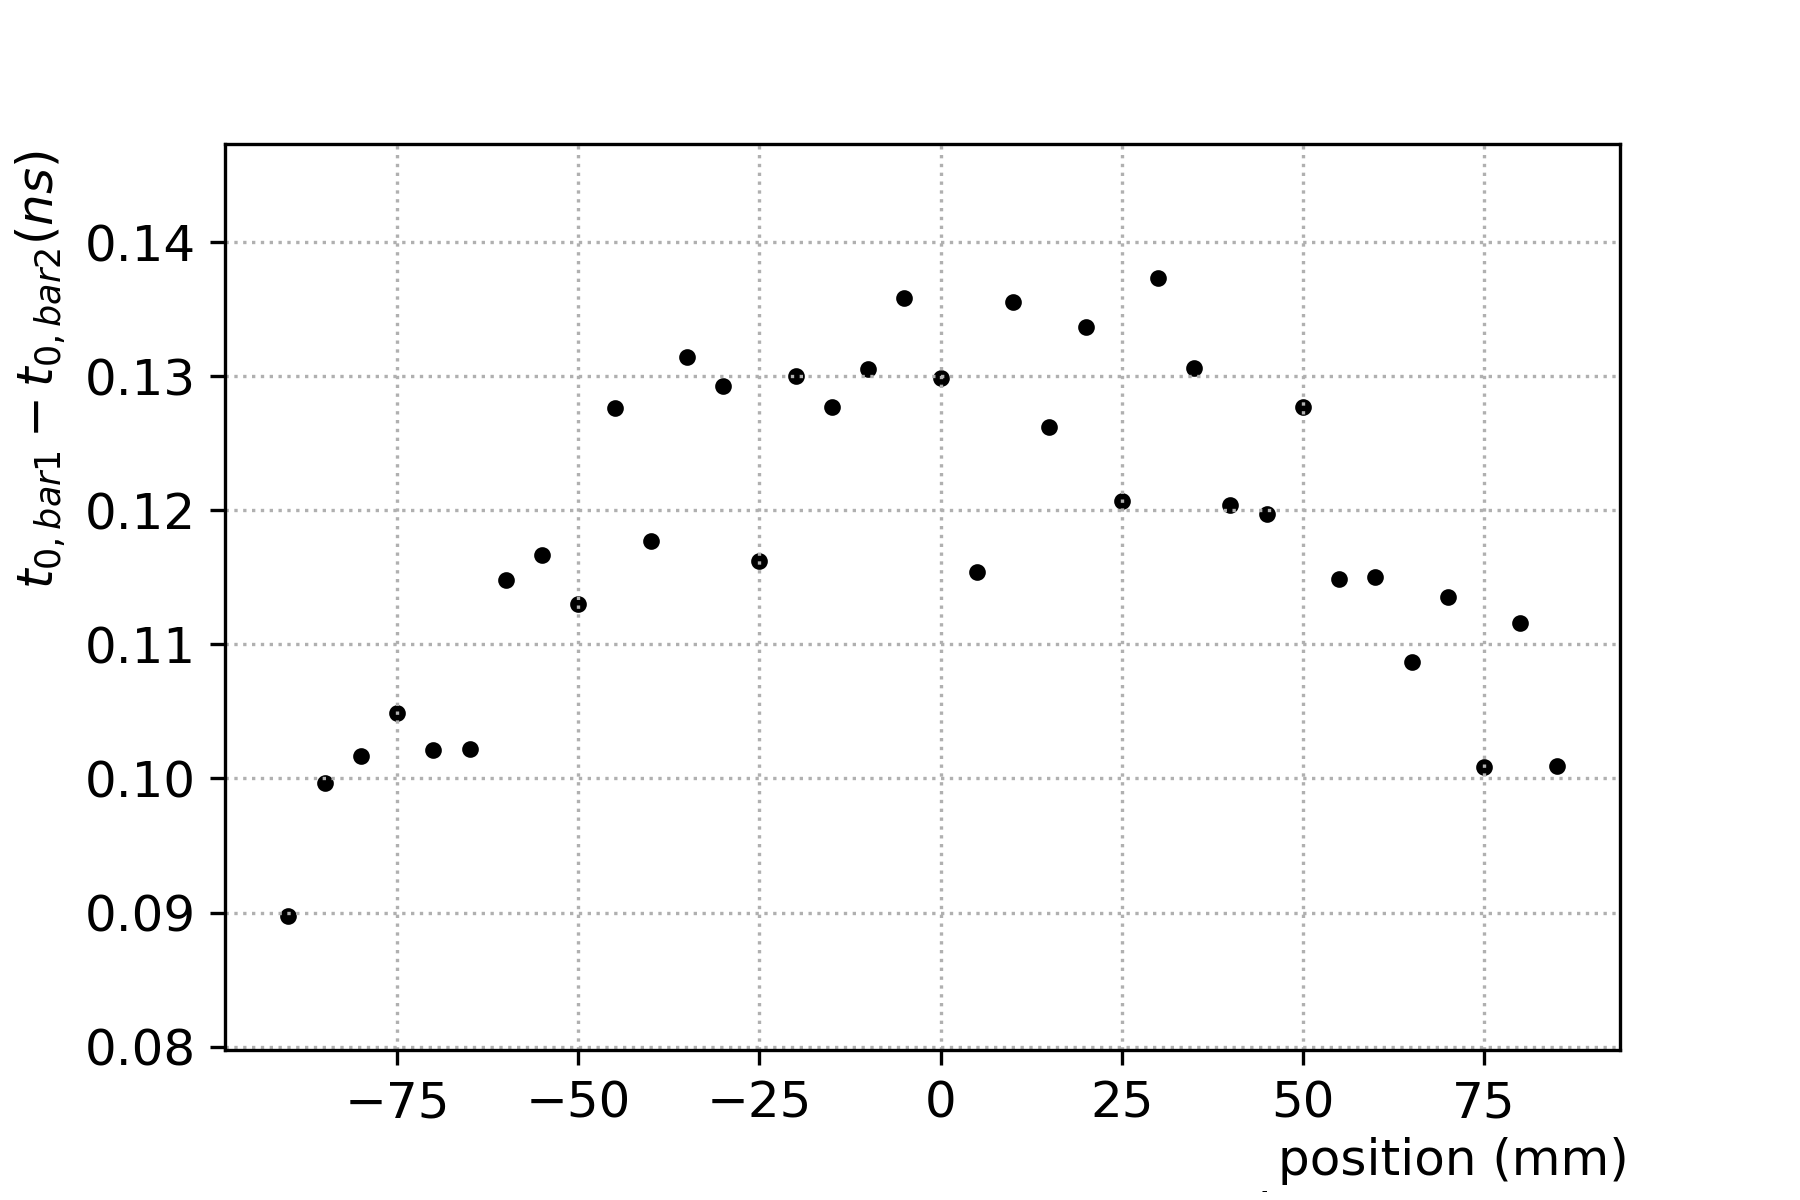 Figure 16
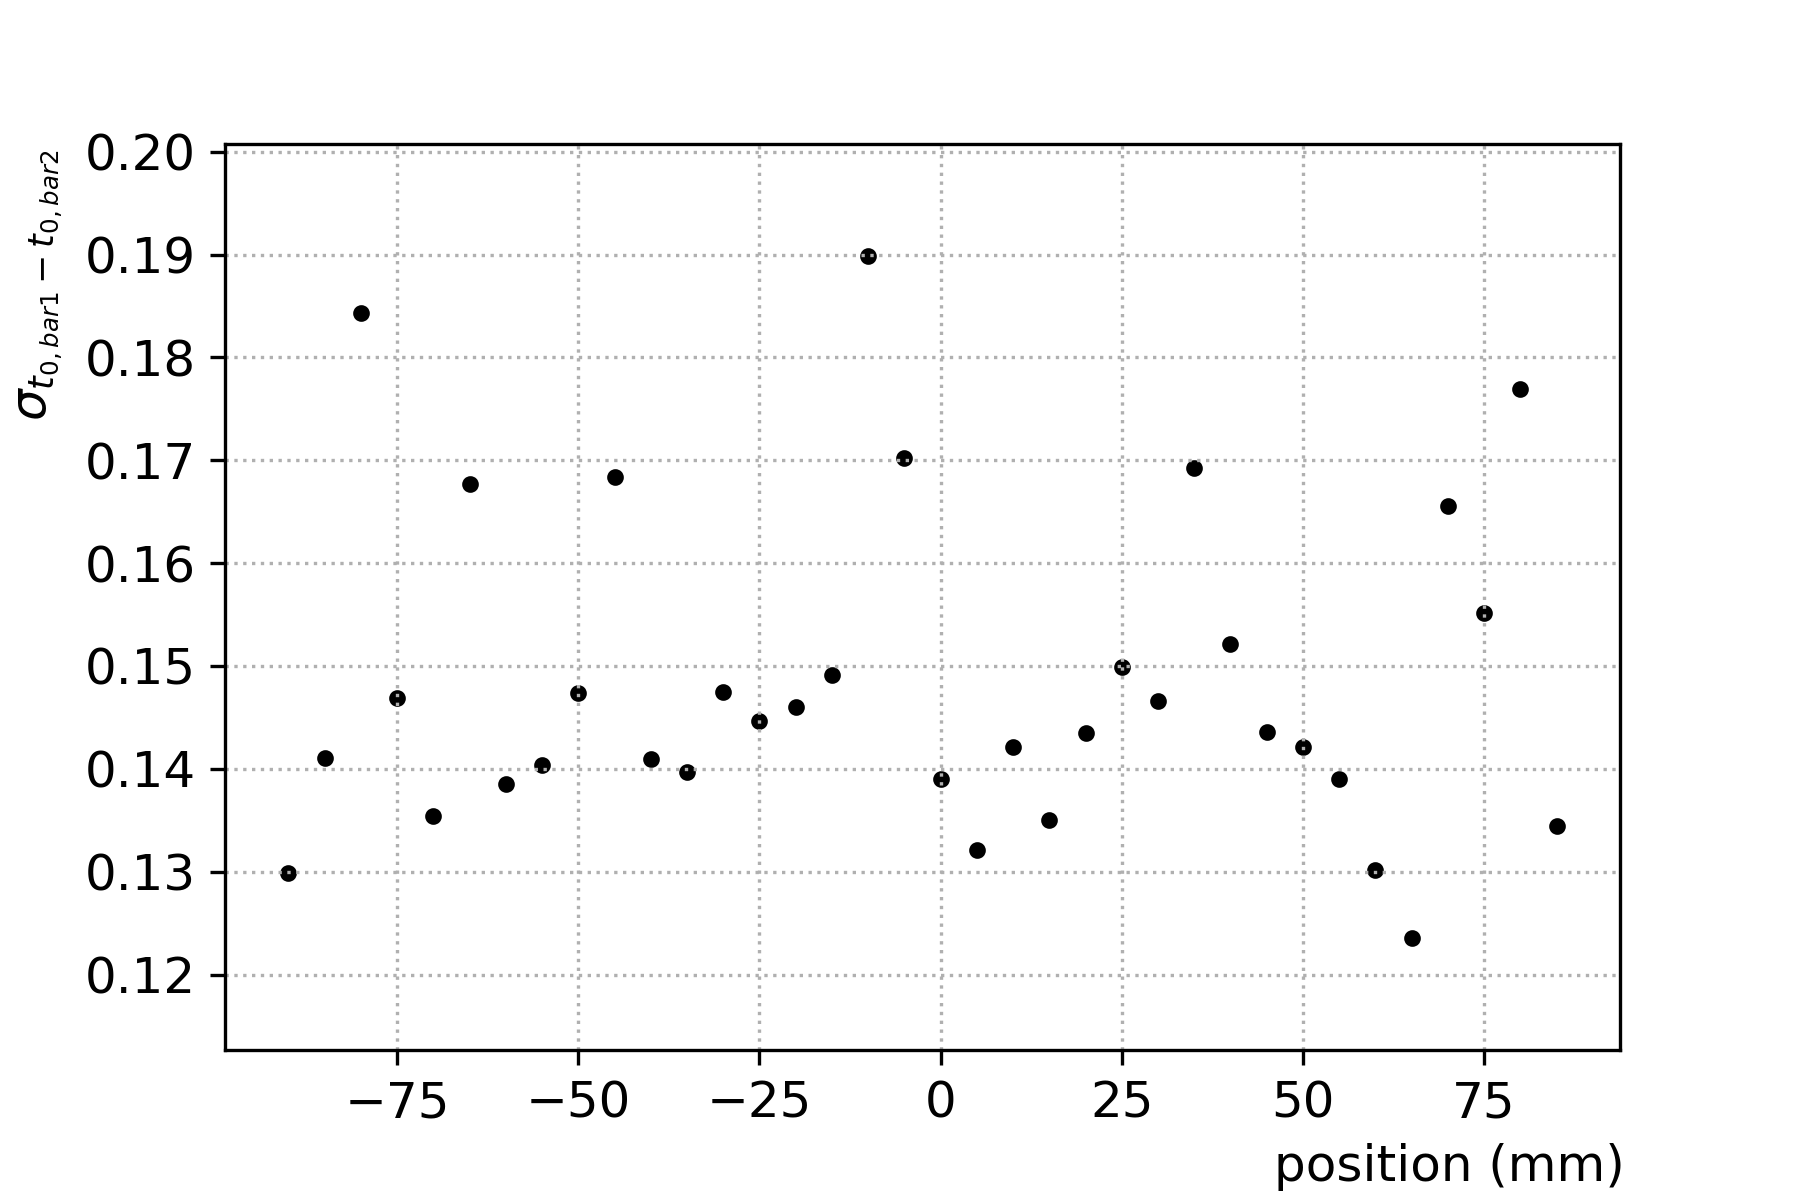 Figure 16
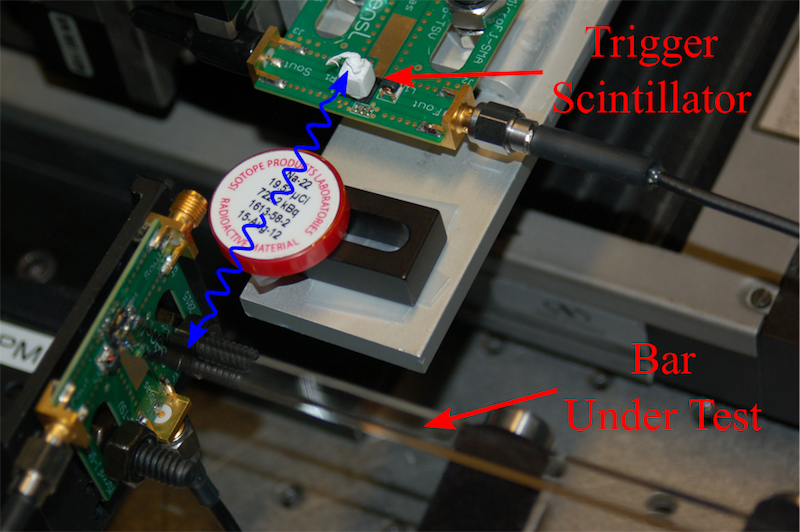 Figure 1
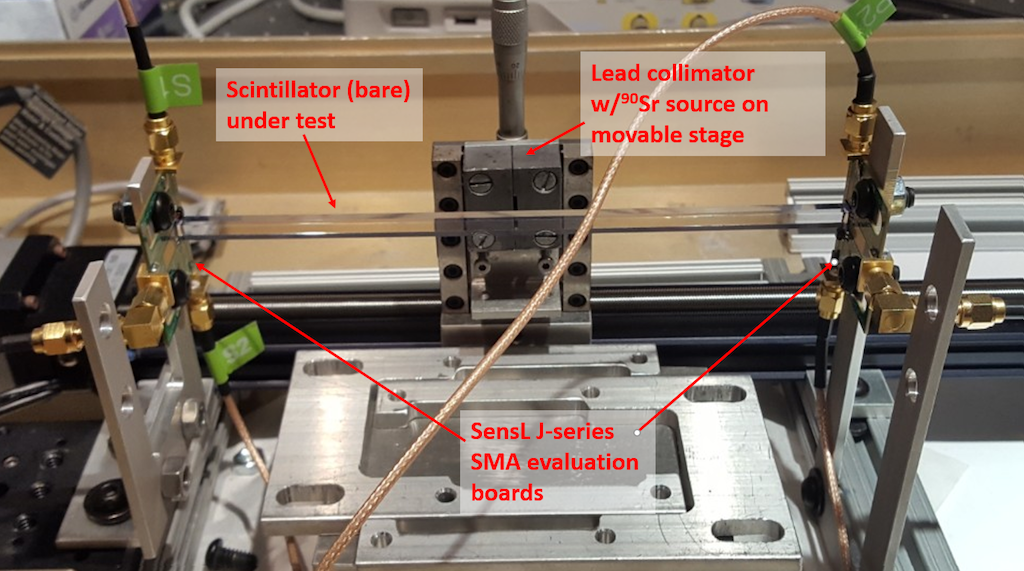 Figure 1
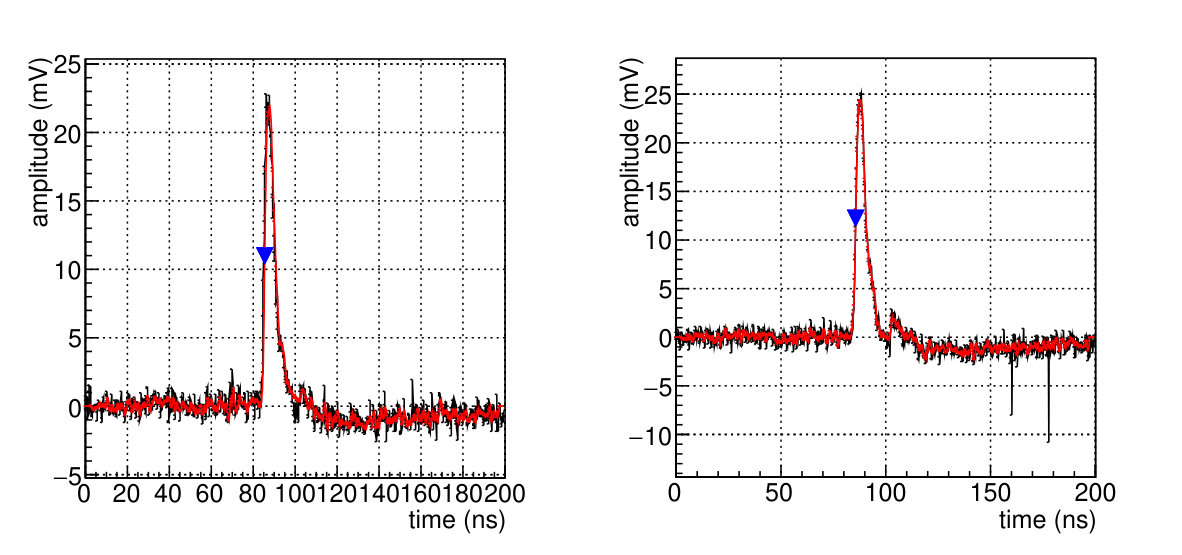 Figure 2
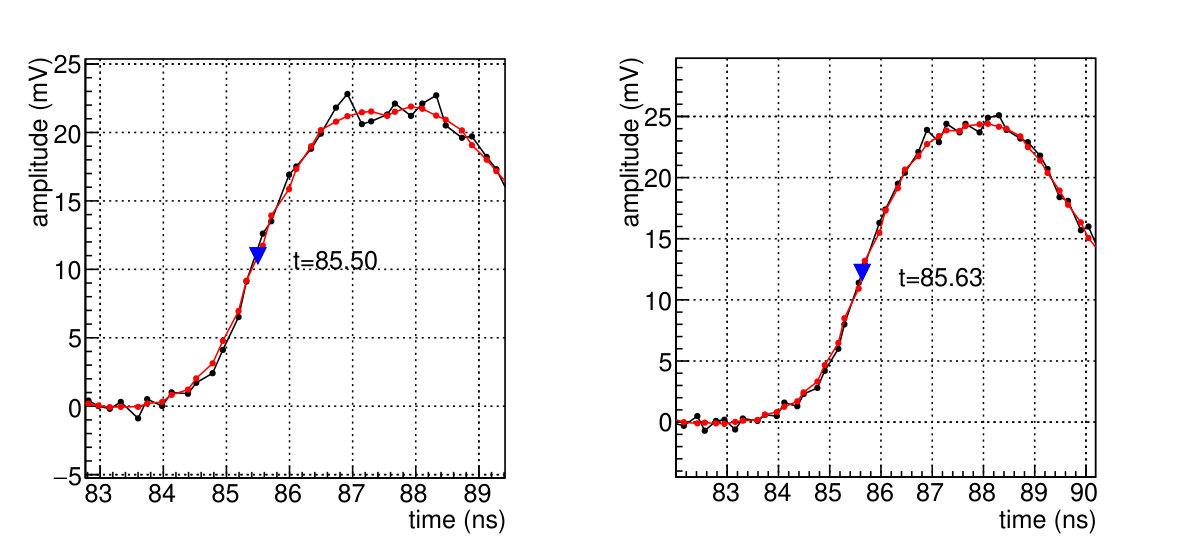 Figure 2
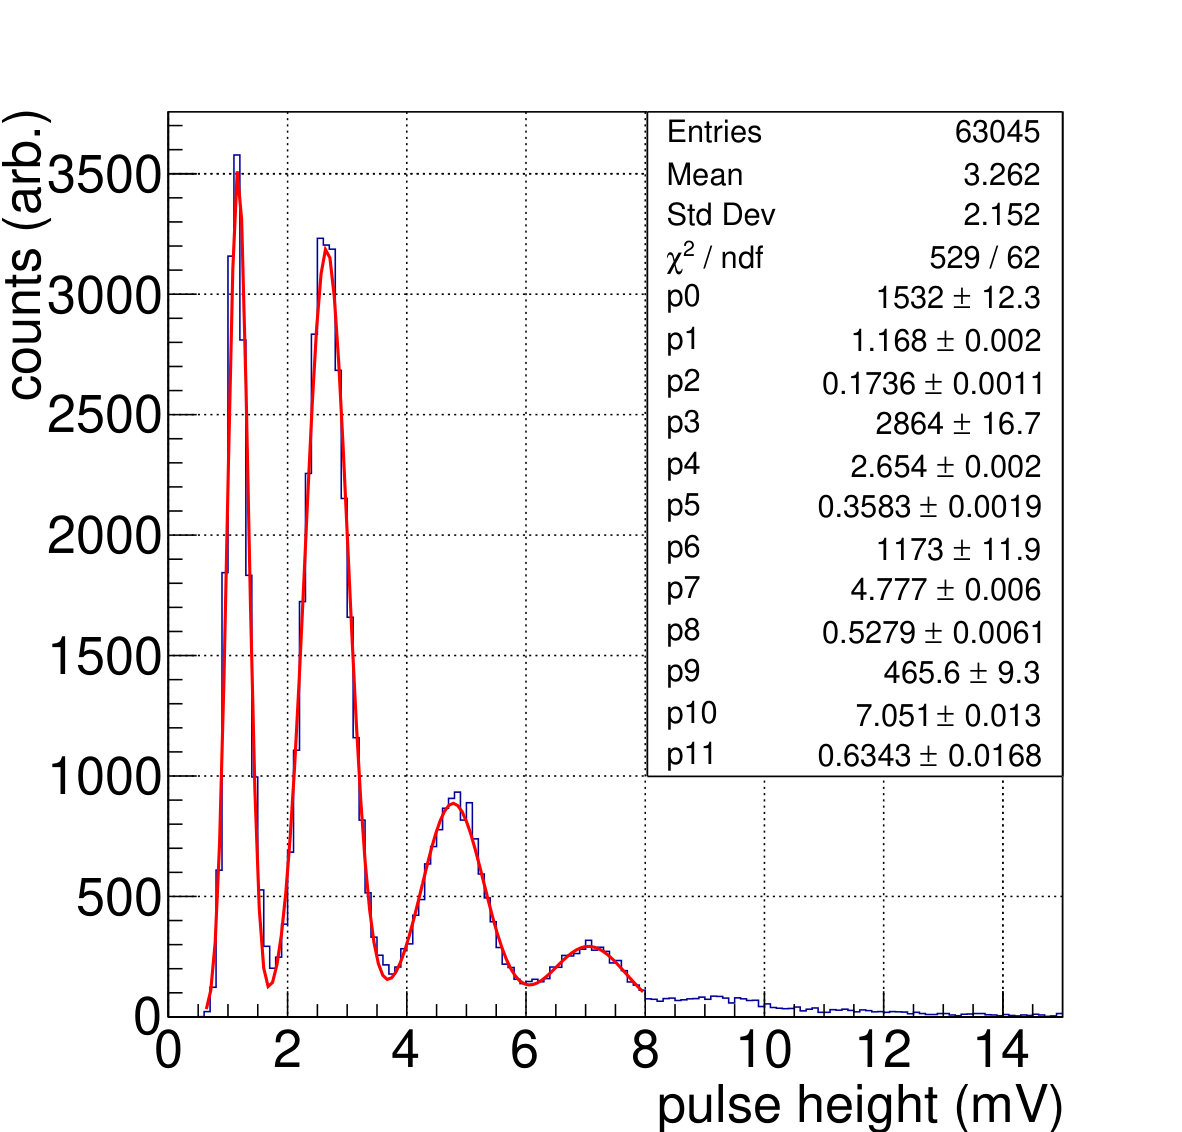 Figure 3
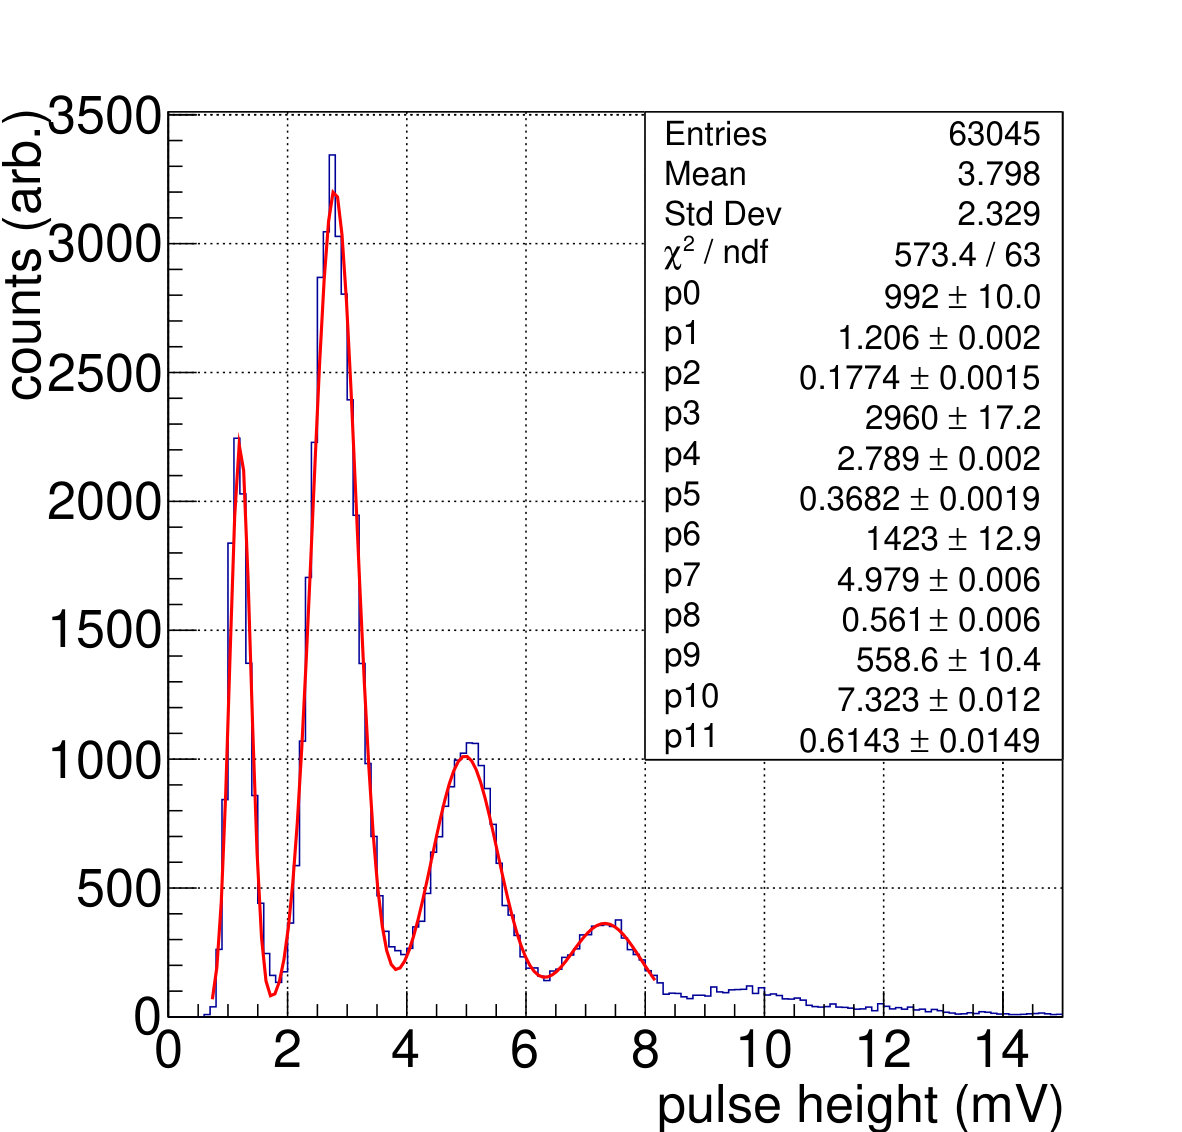 Figure 3
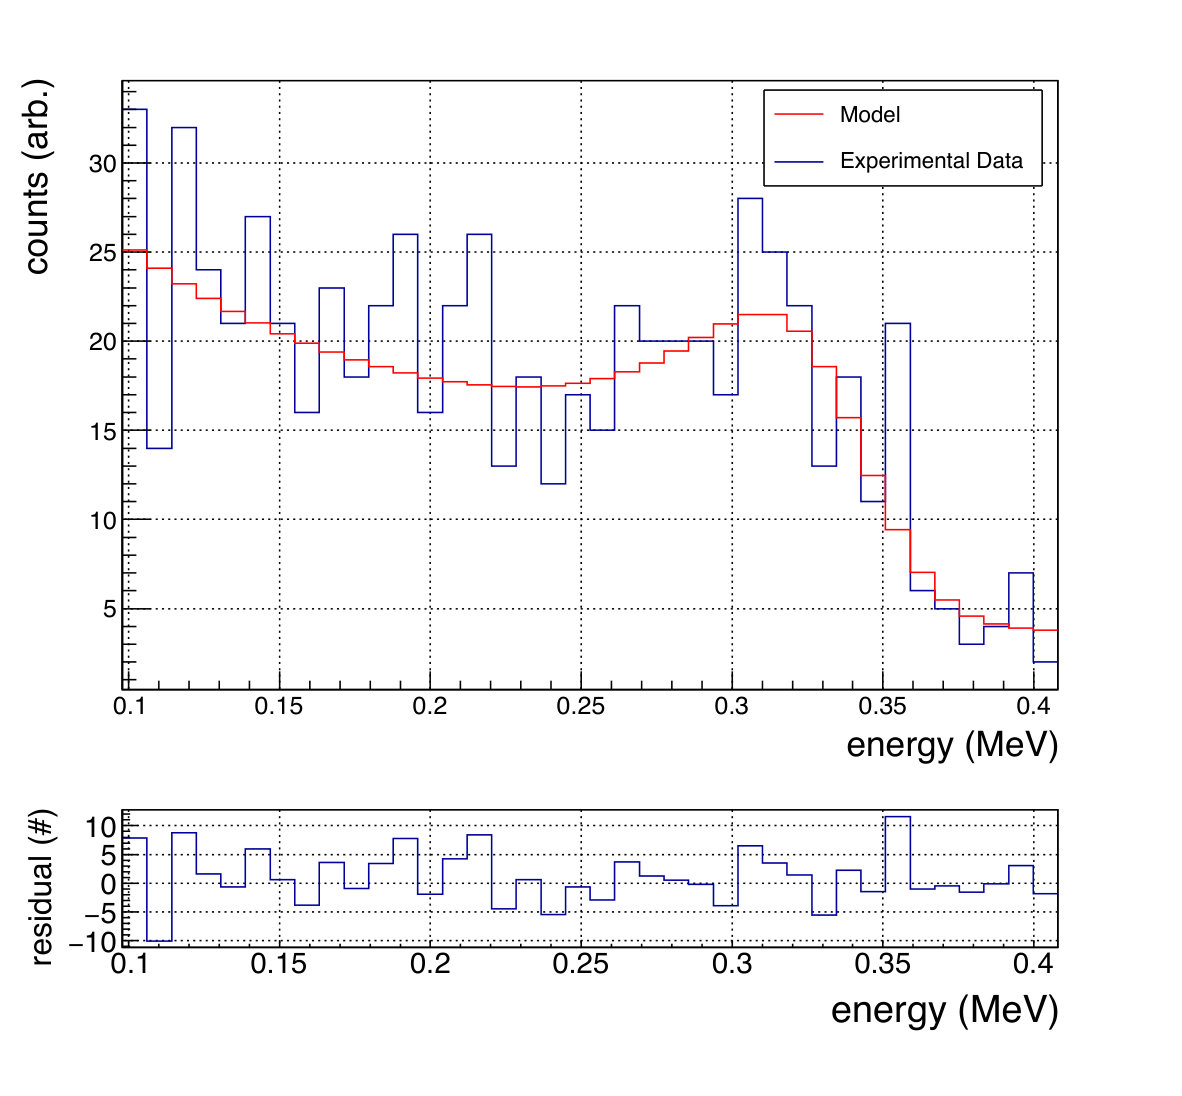 Figure 4
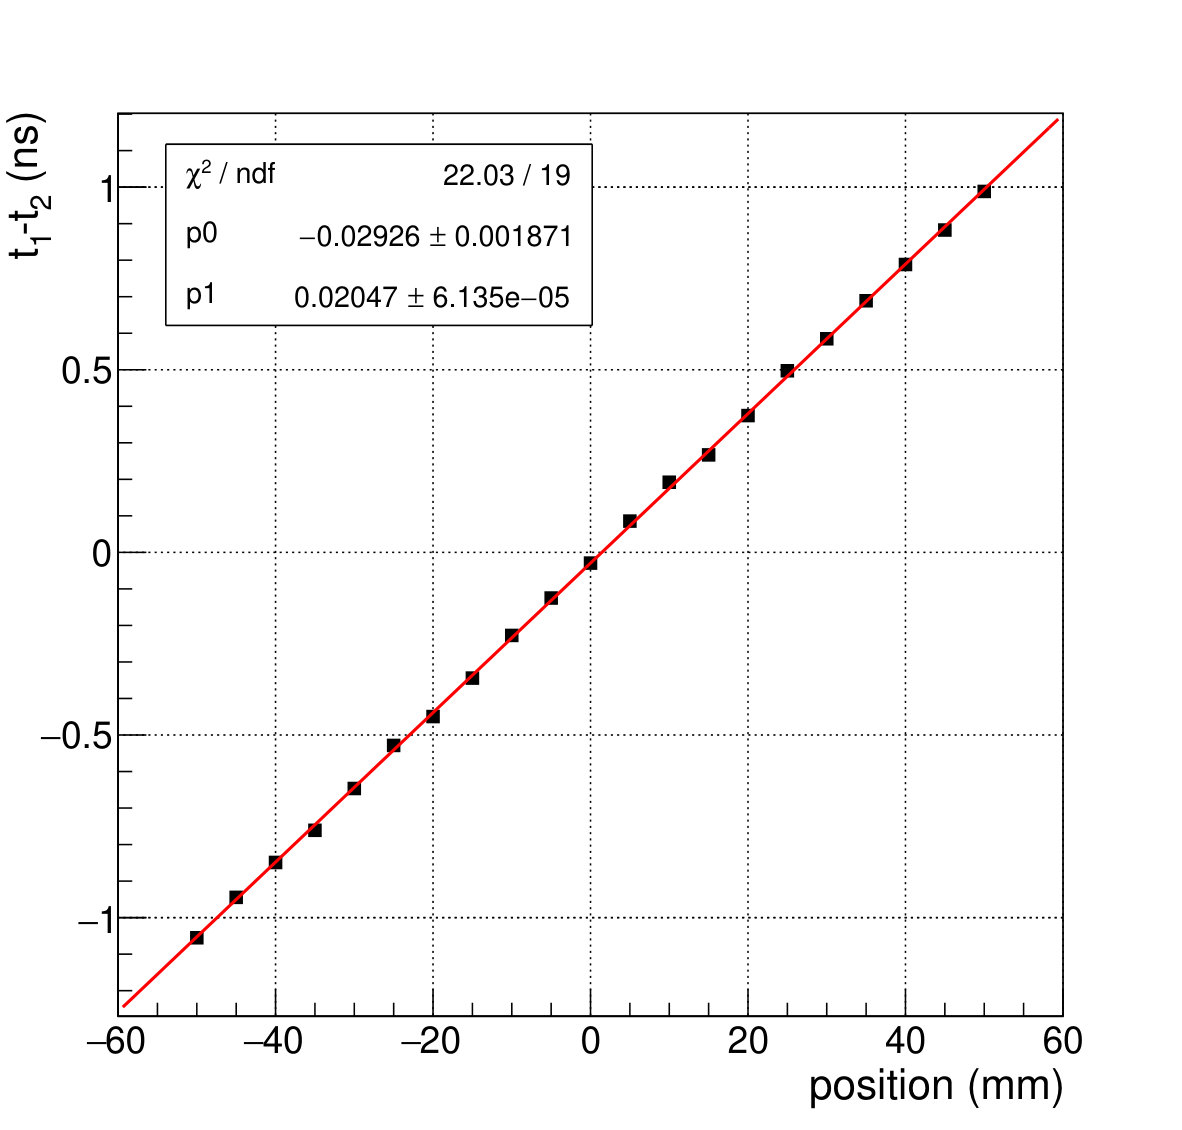 Figure 5
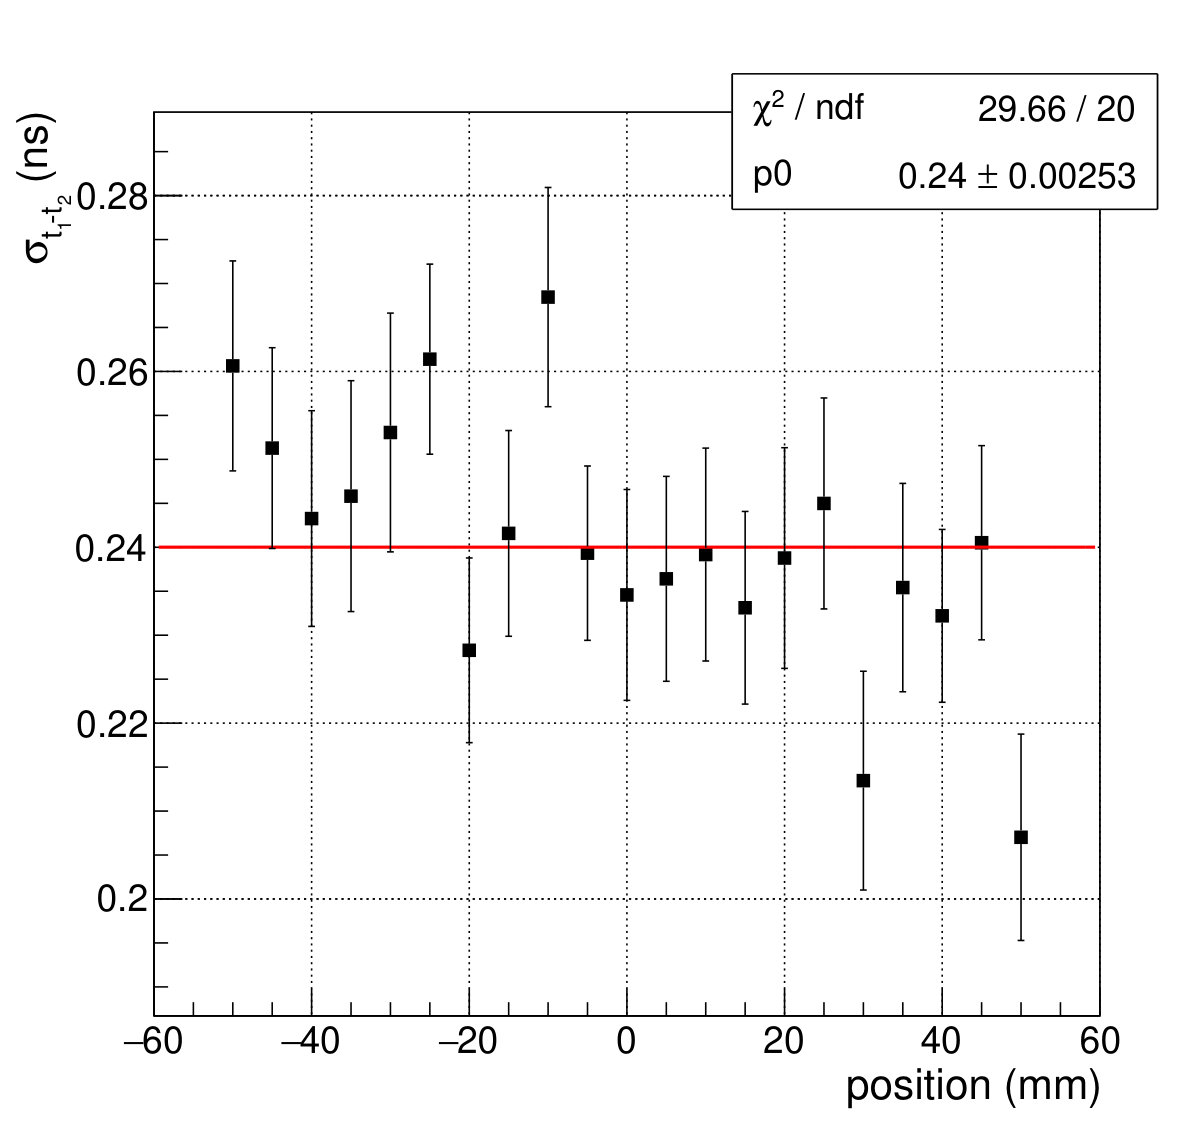 Figure 5
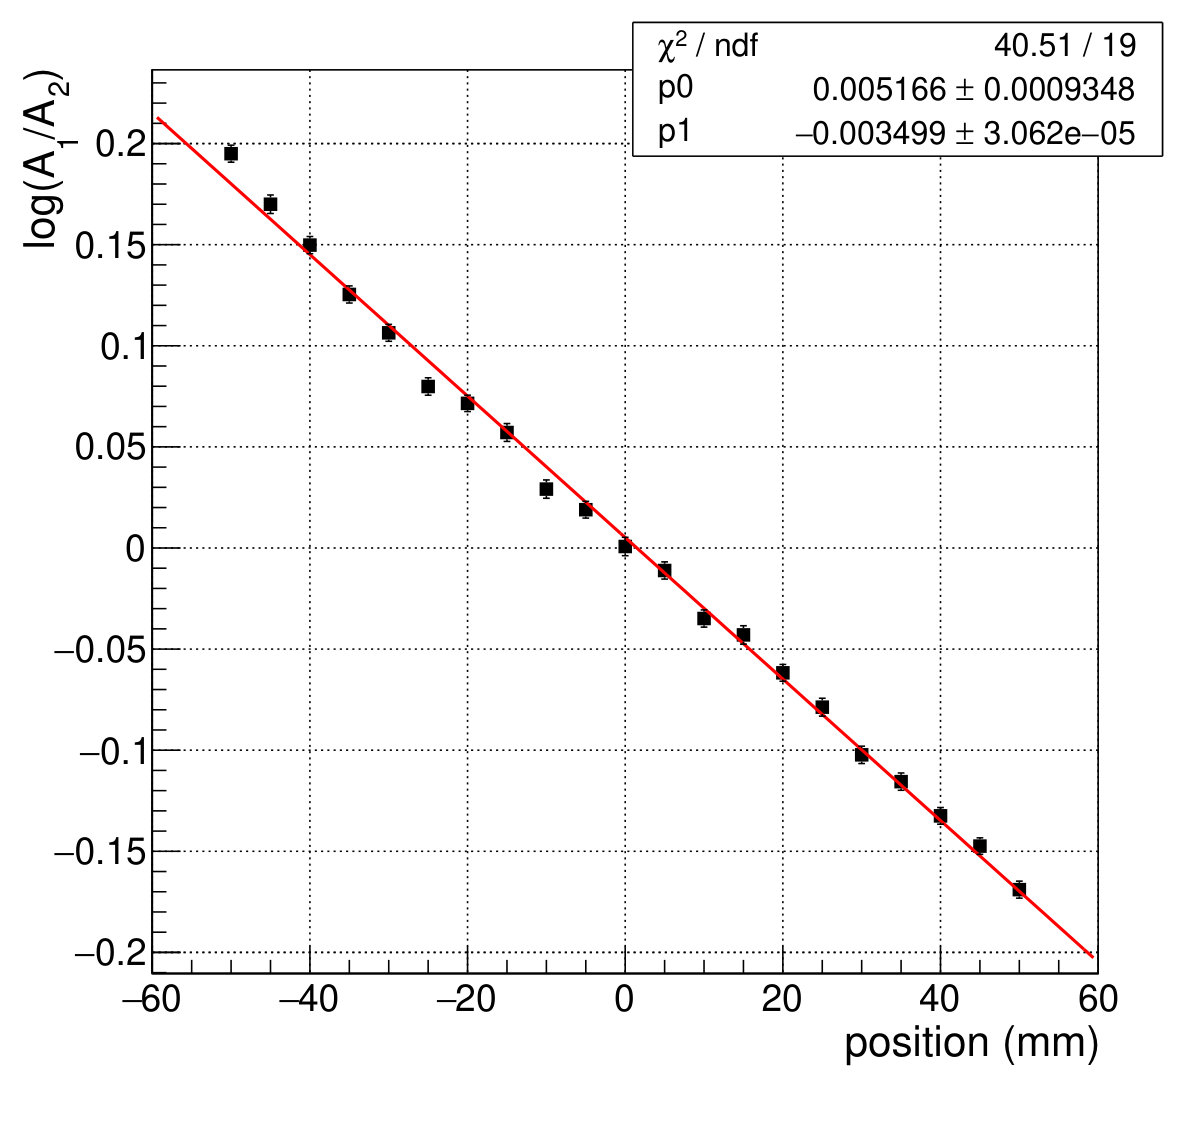 Figure 6
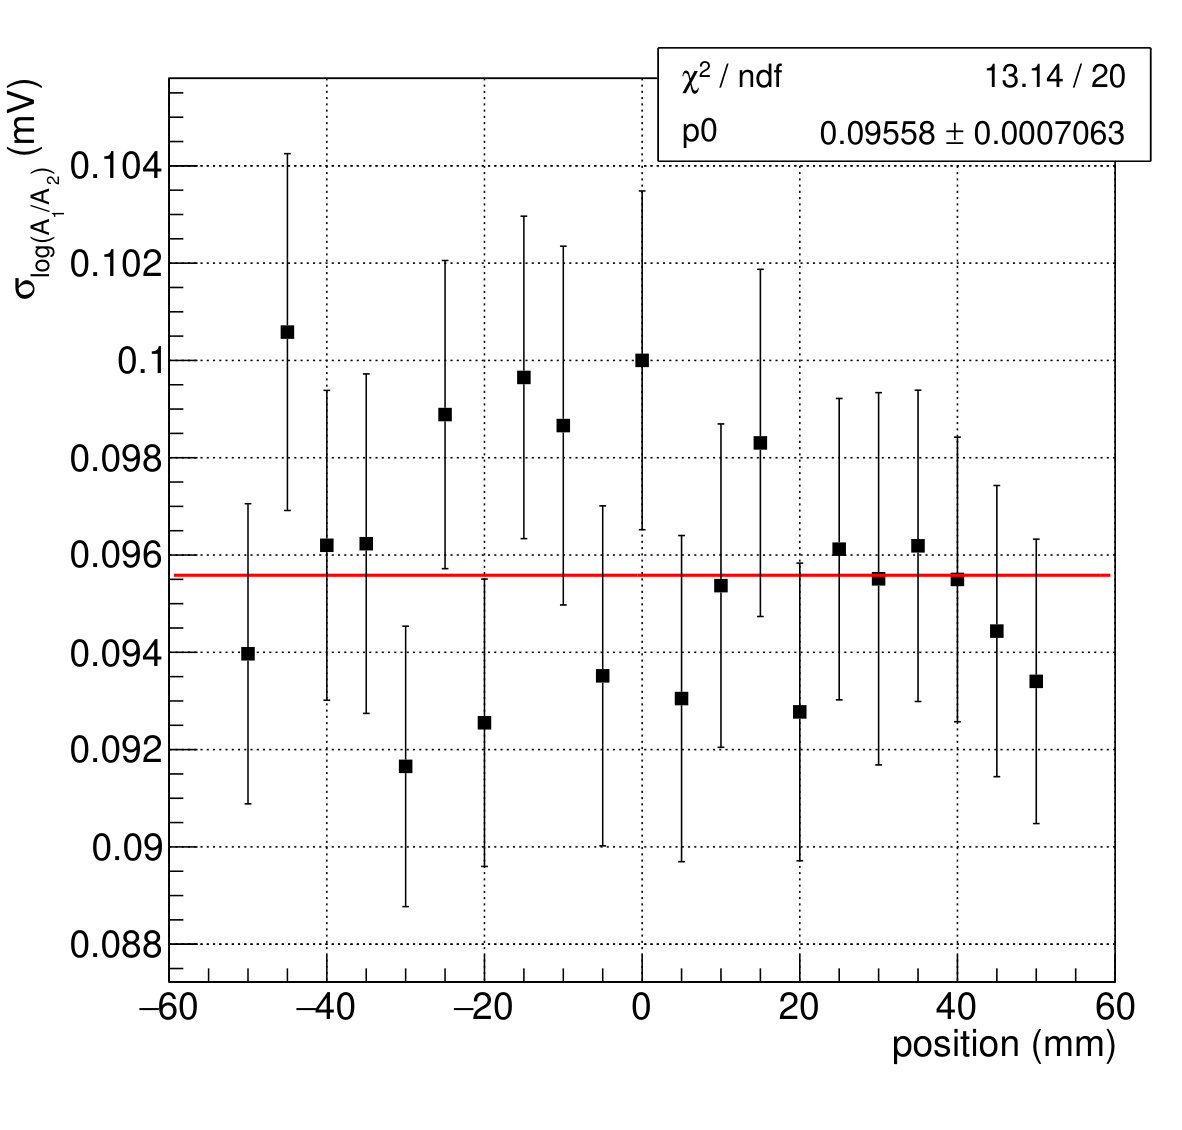 Figure 6
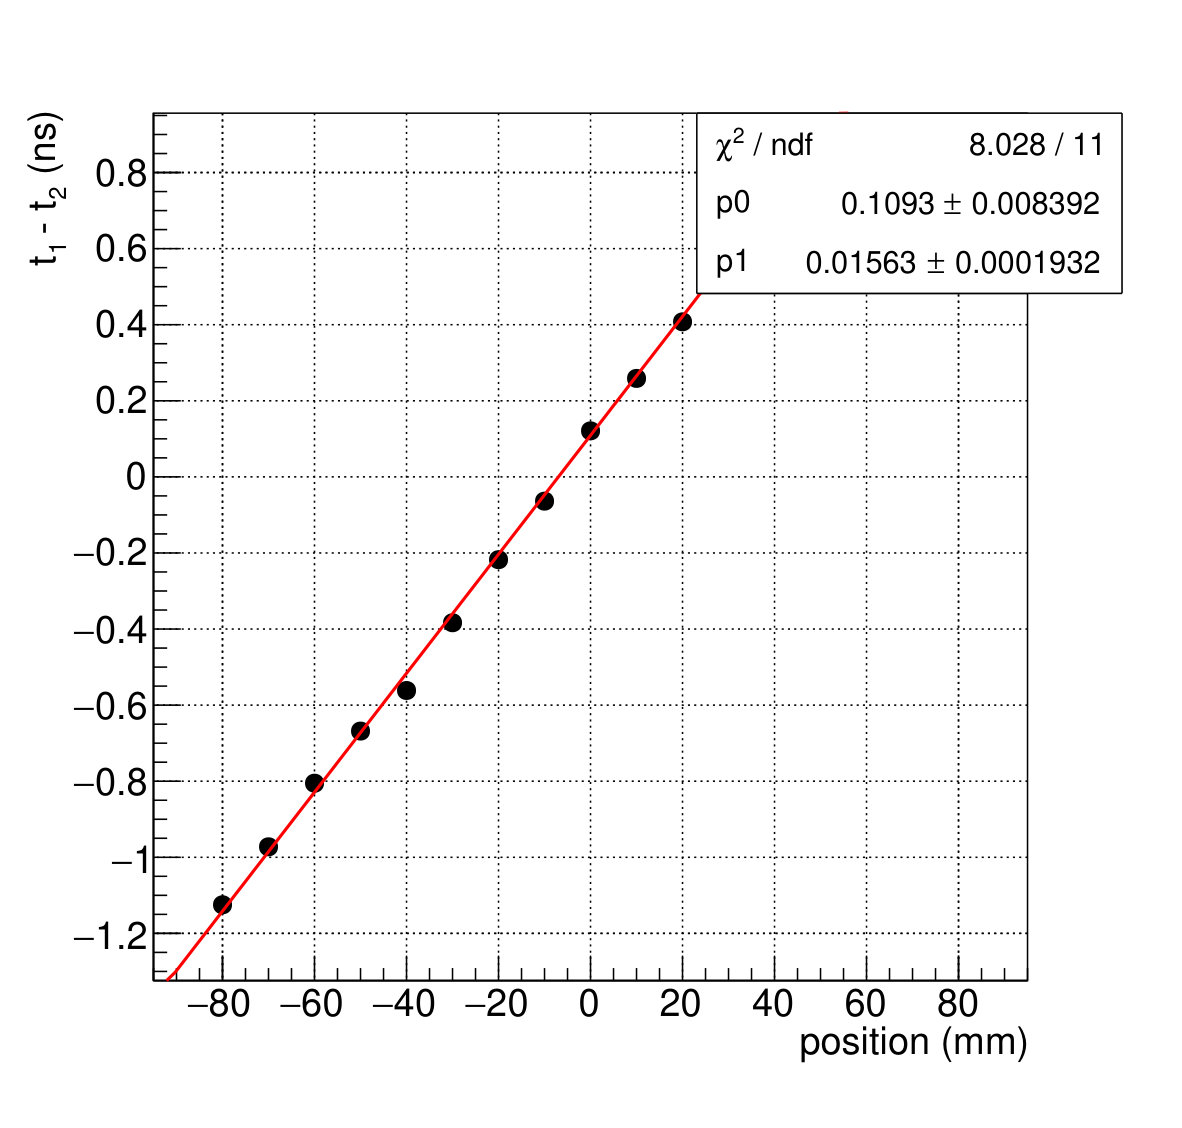 Figure 7
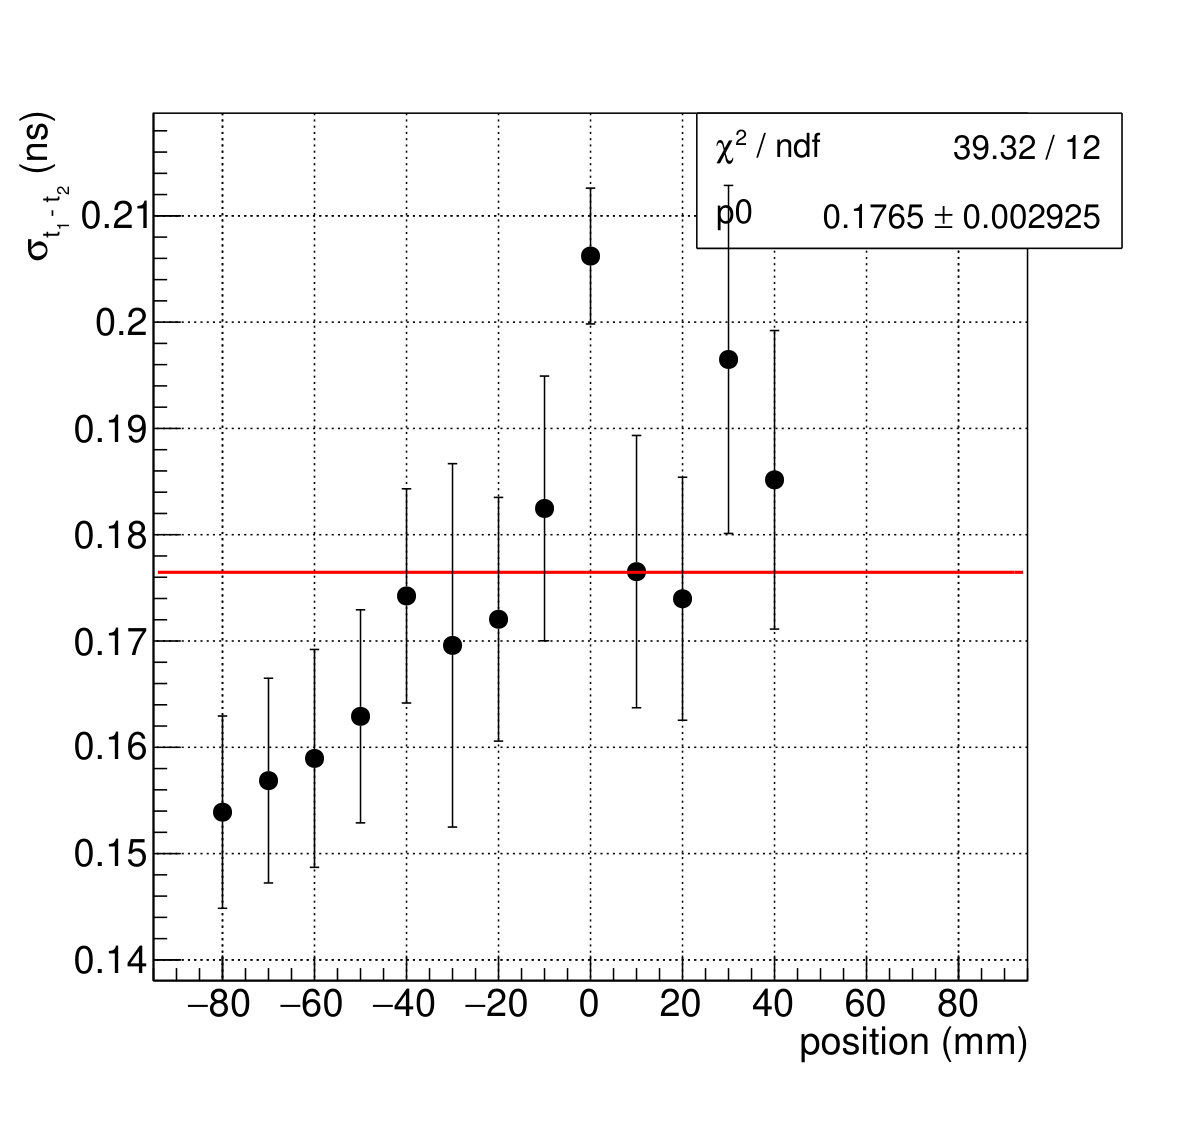 Figure 7
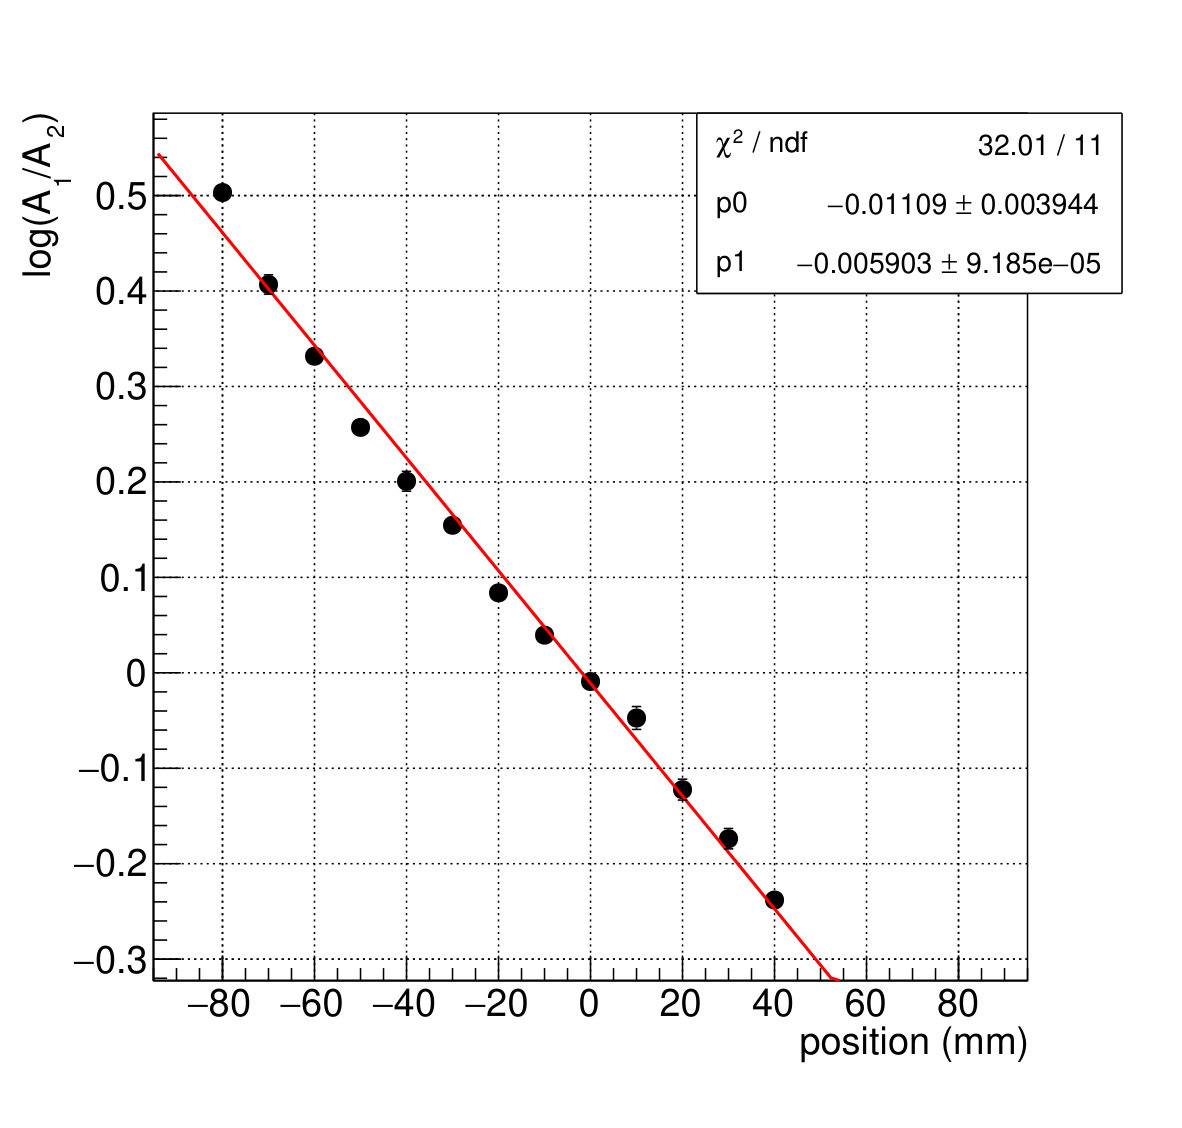 Figure 8
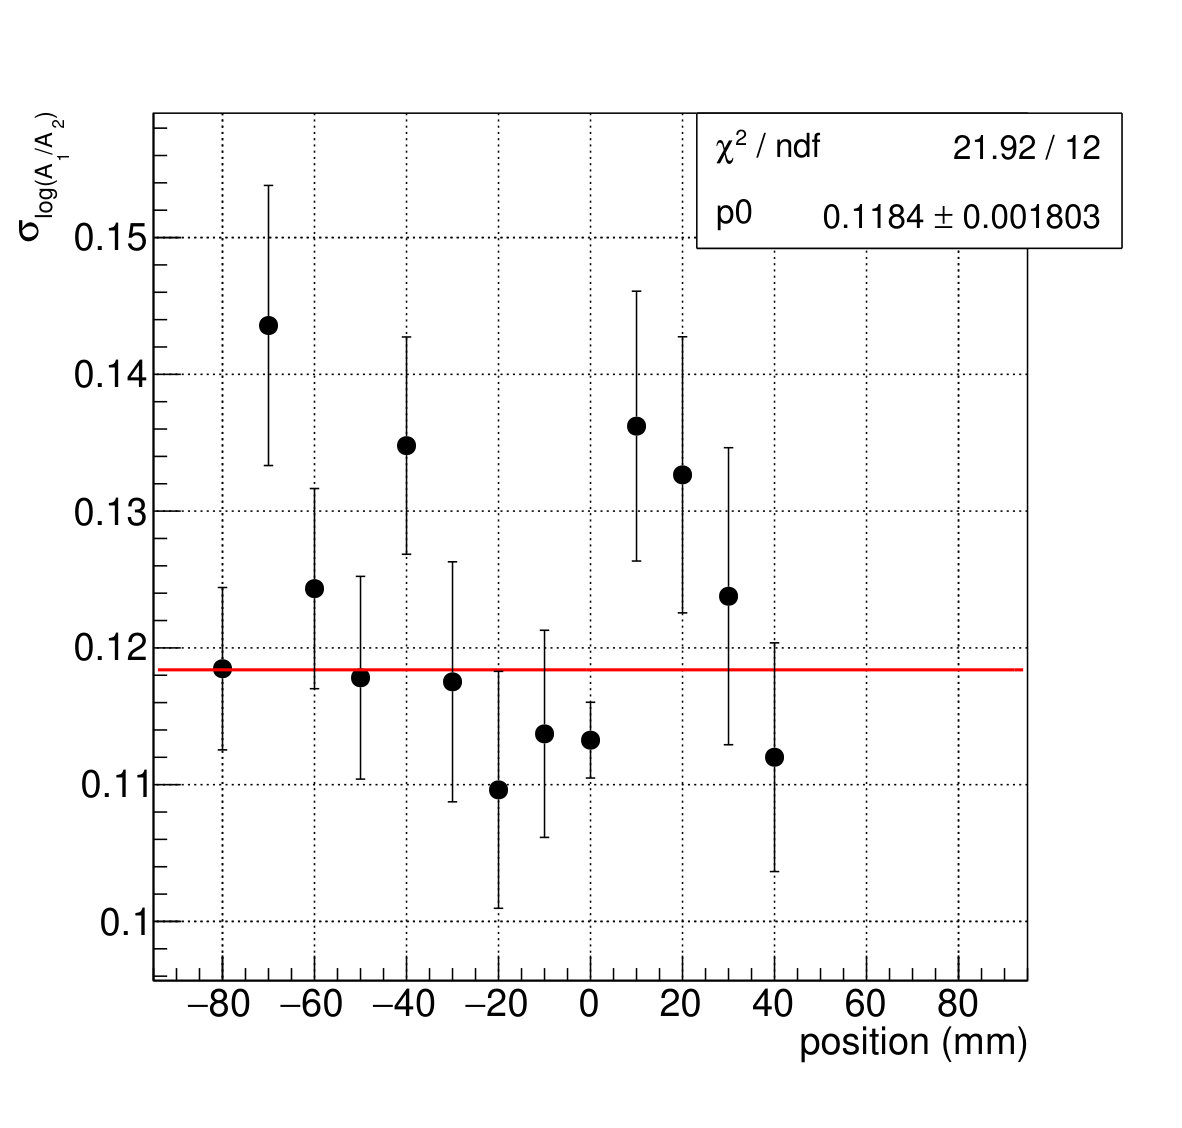 Figure 8
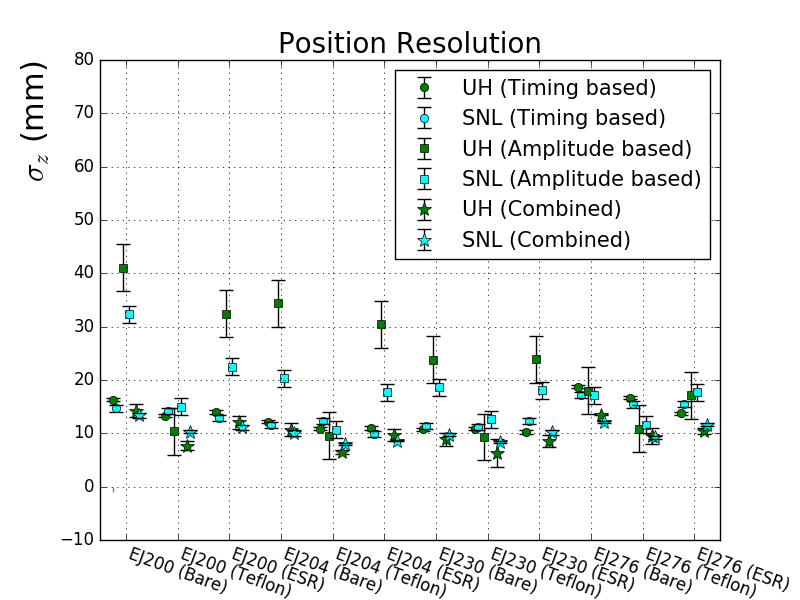 Figure 9
| Scintillator | (ns) | (cm-1) | (MeV-1) | (MeV-1) |
|---|---|---|---|---|
| EJ-200 | 0.9 | 380 | 10,000 | 4,905 |
| EJ-204 | 0.7 | 160 | 10,400 | 5,084 |
| EJ-208 | 1.0 | 400 | 9,200 | 4,378 |
| EJ-230 | 0.5 | 120 | 9,700 | 4,557 |
| EJ-232 | 0.35 | - | 8,400 | 3,679 |
| EJ-260 | - | 350 | 9,200 | 3,470 |
| EJ-262 | - | 250 | 8,700 | 3,548 |
| EJ-276 | - | - | 8,600 | 4,203 |
| EJ-276G | - | - | 8,000 | 2,991 |
| Apparatus | Channel 1 (mV) | Channel 2 (mV) |
|---|---|---|
| UH | 0.2312 | 0.2418 |
| SNL | 0.2257 | 0.2230 |
| Scintillator | (mm) | (mm) | (mm) |
| EJ-200, bar 1: | 16.270.18 | 40.770.60 | 14.29 |
| bar 2: | 16.140.19 | 39.510.58 | 13.99 |
| bar 3: | 16.610.13 | 42.900.66 | 14.53 |
| Teflon bar 3: | 13.310.18 | 10.370.10 | 7.65 |
| ESR, bar 1: | 14.070.17 | 35.580.51 | 12.31 |
| bar 2: | 13.940.17 | 29.290.37 | 11.87 |
| EJ-204, bar 1: | 12.370.14 | 33.460.44 | 10.77 |
| bar 2: | 12.440.15 | 36.320.53 | 10.86 |
| bar 3: | 11.730.19 | 27.320.31 | 10.03 |
| bar 4: | 12.280.14 | 40.570.63 | 11.03 |
| Teflon, bar 4: | 10.890.14 | 9.580.08 | 6.54 |
| ESR, bar 1: | 10.430.12 | 22.080.24 | 8.74 |
| bar 1: | 11.160.15 | 36.680.57 | 10.13 |
| bar 1: | 11.310.14 | 34.850.52 | 10.15 |
| bar 2: | 11.050.14 | 28.250.35 | 9.53 |
| EJ-230, bar 1: | 10.800.14 | 22.790.27 | 8.85 |
| bar 2: | 10.930.14 | 22.440.26 | 8.74 |
| bar 3: | 10.510.13 | 25.520.32 | 8.91 |
| bar 4: | 10.690.13 | 24.400.30 | 8.94 |
| Teflon, bar 1: | 10.880.32 | 9.300.23 | 6.32 |
| ESR, bar 1: | 10.040.11 | 23.570.25 | 8.43 |
| bar 1: | 10.350.11 | 24.760.26 | 8.59 |
| bar 2: | 10.350.12 | 23.320.24 | 8.53 |
| EJ-276, bar 1: | 18.380.25 | 17.490.20 | 13.17 |
| bar 2: | 19.070.27 | 18.560.22 | 13.85 |
| Teflon, bar 1: | 16.660.26 | 10.830.14 | 9.54 |
| ESR, bar 1: | 13.760.19 | 17.180.20 | 10.45 |
| Scintillator | (mm) | (mm) | (mm) | |
|---|---|---|---|---|
| EJ-200, bare: | 14.580.26 | 33.100.64 | 13.34 | |
| bare: | 14.740.36 | 31.550.87 | 13.35 | |
| Teflon: | 14.170.36 | 14.960.39 | 10.29 | |
| ESR: | 12.820.28 | 22.520.54 | 11.14 | |
| EJ-204, bare: | 11.930.28 | 20.590.53 | 10.32 | |
| bare: | 11.290.23 | 20.060.44 | 9.84 | |
| Teflon: | 12.330.26 | 10.660.22 | 8.06 | |
| ESR: | 9.830.26 | 17.690.50 | 8.59 | |
| EJ-230, bare: | 11.310.22 | 18.240.38 | 9.61 | |
| bare: | 11.460.26 | 19.020.47 | 9.82 | |
| Teflon: | 11.230.24 | 12.620.28 | 8.39 | |
| ESR: | 12.300.30 | 18.100.46 | 10.17 | |
| EJ-276, bare: | 17.830.59 | 18.950.72 | 12.98 | |
| bare: | 16.560.46 | 15.370.40 | 11.27 | |
| Teflon: | 15.410.32 | 11.650.24 | 9.29 | |
| ESR: | 15.450.46 | 17.740.59 | 11.65 | |
| Scintillator | (mm) | (mm) | ||
| [UH] | [SNL] | [UH] | [SNL] | |
| EJ-200, bare | 16.340.19 | 14.660.31 | 41.060.61 | 32.330.76 |
| Teflon | 13.310.18 | 14.170.36 | 10.370.09 | 14.960.39 |
| ESR | 14.010.17 | 12.820.28 | 32.440.44 | 22.520.54 |
| EJ-204, bare | 12.210.15 | 11.610.26 | 34.420.48 | 20.330.49 |
| Teflon | 10.890.15 | 12.330.26 | 9.580.78 | 10.660.22 |
| ESR | 10.990.14 | 9.830.26 | 30.470.42 | 17.690.50 |
| EJ-230, bare | 10.730.18 | 11.390.24 | 23.790.29 | 18.630.43 |
| Teflon | 10.880.82 | 11.230.24 | 9.300.23 | 12.630.28 |
| ESR | 10.250.11 | 12.300.30 | 23.880.25 | 18.010.26 |
| EJ-276, bare | 18.730.26 | 17.200.53 | 18.030.21 | 17.160.56 |
| Teflon | 16.660.26 | 15.410.32 | 10.830.14 | 11.650.32 |
| ESR | 13.760.19 | 15.450.46 | 17.180.20 | 17.740.46 |
| Systematic error | 0.30 | 0.59 | 4.45 | 1.64 |
| Config. | ||||||
|---|---|---|---|---|---|---|
| (mm) | (ns/mm) | (ns) | (mm) | (m-1) | ||
| 1 | 12.880.15 | 0.020 | 0.253 | 31.870.43 | -3.20 | 0.102 |
| 2 | 13.170.11 | 0.020 | 0.267 | 29.740.26 | -3.47 | 0.103 |
| 3 | 11.130.07 | 0.018 | 0.207 | 20.040.11 | -4.55 | 0.091 |
| Scintillator | (ps) | (mm) | (%) | |||
|---|---|---|---|---|---|---|
| 22Na | 90Sr | 22Na | 137Cs | |||
| EJ-200, bare | 1552 | 13.35 | 14.27 | 16.7 | 14.1 | |
| Teflon | 1543 | 10.29 | 7.65 | 14.5 | 15.8 | |
| ESR | 1453 | 11.14 | 12.09 | 16.6 | 12.2 | |
| EJ-204, bare | 1363 | 10.08 | 10.67 | 15.7 | 14.7 | |
| Teflon | 1422 | 8.06 | 6.54 | 13.1 | 14.3 | |
| ESR | 1253 | 8.59 | 9.64 | 17.6 | 12.2 | |
| EJ-230, bare | 1413 | 9.61 | 8.86 | 17.8 | 15.0 | |
| Teflon | 1422 | 8.39 | 6.32 | 22.6 | 13.9 | |
| ESR | 1563 | 10.17 | 8.52 | 23.4 | 13.0 | |
| EJ-276, bare | 1835 | 12.13 | 13.51 | 17.8 | 14.1 | |
| Teflon | 1712 | 9.29 | 9.54 | 16.5 | 14.1 | |
| ESR | 1774 | 11.65 | 10.45 | 15.0 | 11.3 | |
| Syst. error | 7 | 0.73 | 0.42 | 3.5 | - | |
Peer Reviews
No public reviews on file for this paper yet. If you reviewed it on a platform where reviews are public (OpenReview, ICLR, NeurIPS, ICML), you can paste yours below so the community can read it here.
Videos
No videos yet. Explain this paper in a talk, walkthrough, or lecture? Add one.
Interaction position, time, and energy resolution in organic scintillator bars with dual-ended readout
M. Sweany
A. Galindo-Tellez
J. Brown
E. Brubaker
R. Dorrill
A. Druetzler
N. Kaneshige
J. Learned
K. Nishimura
W. Bae
Sandia National Laboratory, Livermore, CA 94550, USA
University of Hawai‘i at Mānoa, Honolulu, HI 96822, USA
Abstract
We report on the position, timing, and energy resolution of a range of plastic scintillator bars and reflector treatments using dual-ended silicon photomultiplier readout. These measurements are motivated by the upcoming construction of an optically segmented single-volume neutron scatter camera, in which neutron elastic scattering off of hydrogen is used to kinematically reconstruct the source direction and energy of an incoming neutron. For this application, interaction position resolutions of about 10 mm and timing resolutions of about 1 ns are necessary to achieve the desired efficiency for fission-energy neutrons. The results presented here indicate that this is achievable with an array of bars of EJ-204 scintillator wrapped in Teflon tape, read out with SensL’s J-series silicon photomultipliers. With two independent setups, we also explore the systematic variability of the position resolution, and show that, in general, using the difference in the pulse arrival time at the two ends is less susceptible to systematic variation than using the log ratio of the charge amplitude of the two ends. Finally, we measure a bias in the absolute time of interactions as a function of position along the bar: the measured interaction time for events at the center of the bar is 100 ps later than interactions near the SiPM.
keywords:
fast neutron imaging , special nuclear material detection
1 Introduction
Recently, the concept of a single volume neutron scatter camera was reported [1, 2, 3]. In comparison to current implementations of the technology (see e.g. [4]), a single volume scatter camera aims to detect multiple neutron-proton interactions within the same contiguous volume of scintillator, rather than distributed volumes of scintillator. If successful, the resulting instrument would out-perform current state-of-the-art double-scatter imagers in terms of imaging efficiency for fission-energy neutrons by an estimated order of magnitude [2], as well as improve deployability factors such as size, weight, and power consumption. For some non-proliferation applications, the reduced size of the instrument would also enable closer inspection of objects, leading to rate increases and corresponding reductions in acquisition times and an improvement in imaging resolution.
The key to realizing such an instrument lies in accurately reconstructing the time, position, and energy of neutron-proton interactions within the volume of scintillator. The kinetic reconstruction of the neutron direction requires two neutron-proton elastic scatters: the neutron direction before the first scatter is constrained to a cone defined by the angle :
[TABLE]
where is the incoming neutron energy and is the neutron’s energy after the first interaction. In the non-relativistic limit, is determined by the neutron time-of-flight () and distance () between the first and second neutron interactions, where is the mass of the neutron:
[TABLE]
Finally, is determined by the energy deposited in the first interaction, , measured by the light emitted in the first scintillation pulse, and :
[TABLE]
The accuracy of the cone defined by is thus dependent on the energy resolution of the first scintillation pulse, and the timing and position resolution of the two interactions. The focus of this work is to characterize with experimental data the energy, timing, and position resolution of an optically segmented volume of scintillator. In this instance of the concept, only the position along each bar segment of the array must be reconstructed for the position of each interaction, while the other position dimensions are determined by the particular photodetector in which the scintillation light was detected. Monte Carlo simulations of various detector configurations of optically segmented bars have been previously performed [1] and provided guidance as to the optimal choice of scintillator, reflector material, and photon detection technology. However, practical considerations have limited the experimental space explored.
There are other detection systems that share the same goals to optimize the energy, timing, and position resolution of interactions within scintillator volumes. Time-of-flight Positron Emission Tomography (TOFPET) systems require good spatial and timing resolution, and benefit from increased light output from gamma interactions in the scintillator volume (see e.g. [5]): because only gamma interactions are of interest, inorganic scintillators are used, which typically have higher light output compared to organic scintillators. While TOFPET systems can look very similar to what is described here, the problem of reconstructing a second interaction very close in time and position to the first motivates scintillator responses not only with fast pulse rise times, but with reasonably fast pulse decay times as well. PET systems also work in a relatively limited energy range, annihilation gammas at 511 keV, and therefore use the energy measurement primarily for background rejection as opposed to reconstruction. Neutrino detection systems also benefit from good energy resolution to reconstruct the incoming neutrino spectrum, and good spatial and timing resolution, either to reconstruct the neutrino direction (for neutrino-electron scattering interactions) or for background rejection based on event topology (for inverse-beta decay interactions). Because neutrino interaction cross sections are so low, large detector systems are a paramount design consideration, motivating larger segmentation and cost-effective readout. These requirements often lead to similar systems with dual-sided readout of long canes with a similar aspect ratio presented here (see e.g. [6, 7, 8]). While these differences may result in different design details, the methods and conclusions presented here are relevant to a wider detection community.
1.1 Design Considerations
The experimental measurements presented here are constrained to 190 mm long rectangular scintillator bars with a cross sectional area of . The length constraint is determined by the approximate desired volume of the instrument, coupled with the currently available readout size of fast photo-detectors (approximately 50 mm). For photo-detection, the fastest available on the market currently are micro-channel plate photomultiplier tubes (MCP-PMTs) and silicon photomultipliers (SiPMs). In terms of timing, MCP-PMTs typically have the best single photoelectron timing performance, but have a higher cost and typically much lower photodetection efficiency (PDE). SiPMs were chosen for their low cost and superior photon separation and PDE. For data acquisition, we use the 4-channel DRS4 evaluation board [9, 10] from the Paul Scherrer Institut (PSI) for its high sampling speed and ease of use.
The scintillator types explored here are constrained to the plastic scintillators with parameters from the manufacturer that are expected to optimize our performance metrics. In this case, the relevant scintillator parameters for consideration are:
total output and emission wavelength well-matched to the wavelength-dependent PDE of the SiPMs to optimize detectable photons, 2. 2.
rise time of the scintillator pulse for optimal timing resolution as well as position resolution along the bar, 3. 3.
emission wavelength in relation to surface treatment reflectivity, and 4. 4.
attenuation length () to either optimize position resolution (short) or maximize the number of detectable photons (long).
The method used to reconstruct the position resolution dictates the desired attenuation length. The methods used here are based on the difference in the pulse arrival time and amplitude at each end of the bar. Potentially, the difference in pulse shape provides an additional method [1], however this is not explored in this work. In the case of the pulse amplitude difference, a shorter attenuation length maximizes the difference in amplitude and therefore the position resolution. However, this leads to a reduction in energy resolution. The difference in both pulse arrival time and pulse shape may be enhanced by a longer attenuation length: in the case of pulse arrival time, an increase in photons arriving directly from the interaction could improve the precision of the measurement, and in the case of the pulse shape, an increase in late arriving photons may enhance the tail end of the pulse for interactions further from the readout end. Based on this, the preference is for longer attenuation lengths. It should be noted, however, that different attenuation lengths for different processes may exist within a bar, and so measurements may need to be re-evaluated if the bar length changes significantly.
Table 1 lists the available plastic scintillators from Eljen Technology’s catalog that have been considered for our bar length. Not included in the list are EJ-212 and EJ-214, which are intended for thin sheets, and EJ-228, which has an attenuation length too small for bars greater than 10 cm in length. Loaded scintillators such as EJ-254 (boron) and EJ-256 (lead) are also not included, nor are the high-temperature analogs of EJ-200 and EJ-208 (EJ-244/M and EJ-248/M). The number of detectable photons, , for SensL’s J-series SiPMs was determined by sampling the total emitted photons, , over the emission wavelength of the scintillator, and applying the wavelength-dependent PDE for a 5.0 V over-voltage. No propagation losses or geometrical acceptance effects are included in this estimate of . The top three candidates in terms of are EJ-200, EJ-204, and EJ-230, shown in bold in Table 1. We are also including EJ-276, for its potentially beneficial neutron/gamma pulse-shape discrimination power: neutrons and gammas can also be discriminated by the time-of-flight between interactions, but the power of that metric will be dependent on the timing resolution of the final system.
In terms of surface reflectivity, we have narrowed the options to 3M’s Enhanced Specular Reflector (ESR), which has a specular reflectivity of 98.5% above approximately 380 nm wavelengths [11, 12], PTFE (Teflon) tape with a diffuse reflectivity greater than 95% over a broad wavelength range for a 0.5 mm thick layering [11, 13], and finally no surface treatment with only total internal reflection (TIR) to guide the light to the readout ends. These were chosen because they are among the highest reflectivity materials for pure diffuse (Teflon) and specular (ESR) reflectivity that are commercially and readily available.
In addition to surface reflectivity, the surface roughness of the scintillator material has been previously shown by others to have a significant effect on the light transportation properties. On results with a bar of BC400, the authors of [14] report greater than an order of magnitude reduction in the number of photons emitted at 200 mm from the photodetector surface compared to 20 mm from the photodetector surface for a bare bar with poor surface roughness: this value is reduced to 30% for a finely polished sample. The effect is also evident with highly reflective surface coatings: the ratio of detected photoelectrons between 200 and 20 mm was reported to be 60% for poorly polished samples wrapped with ESR, and only 9% for a finely polished sample. While there was some effort to reproduce these effects here, polishing is a time consuming processes, especially for bars of this form factor. For the studies reported here, we used the best surface polish quality available from the scintillator supplier.
2 Experimental Setup
Two independent experimental setups are used to perform characterizations on the test scintillators. These two setups serve to validate one another, and also provide an effective method to identify and study systematic effects that may lead to differences in performance.
At Sandia National Laboratories (SNL), timing, position resolution, and energy resolution are all characterized using the back-to-back 511 keV annihilation gammas emitted from a 22Na source. A stilbene crystal wrapped in Teflon and coupled to a single-channel SensL J-series SiPM is used to trigger the data acquisition system. The SiPM is biased at +30 V using a BK Precision 1761 DC power supply. This “trigger” scintillator is placed on two automated linear stages from Newport: UTS150PP, with a 150 mm range and UTS50PP, with a 50 mm range. Both stages are controlled through a GPIB interface with Newport’s MM3000 motion controller. The manufacturer quotes a guaranteed accuracy with a repeatability for both linear stages, far exceeding the resolution limit of our apparatus: 5/ mm, due to the size of the trigger scintillator. The 150 mm stage is used to scan the length of the bar, and the 50 mm stage is used for vertical alignment. The mm “test” scintillator bar is placed opposite the trigger scintillator, with the long axis of the test bar parallel to the motion of the 150 mm stage. The test scintillator bar is coupled with optical grease to two additional single-channel SensL J-series SiPMs, also biased at +30 V. Two cylindrical optical rods wrapped with black felt are used to support the scintillator bar in order to prevent decoupling from the SiPMs. Finally, the 22Na source is placed equidistant between the trigger and test scintillators and on the same stage as the trigger scintillator, so that each measurement has the same distribution of interactions in the test bar, and there is a one-to-one translation between the trigger scintillator position and the interaction location in the test scintillator. The entire apparatus, shown in Figure 1a, is placed in a light-tight enclosure. The energy resolution is characterized at the center of the bar, and the position and timing resolution are characterized with a set of trigger scintillator positions that span the bar from 15 mm from one edge of the test bar to 135 mm from the edge. For two scans (EJ-200 bare1 and EJ-204 ESR), the total range covers over half the bar, but the spacing and range differs from the others. For each position, 100,000 triggers are acquired with the DRS4 Eval board, which is calibrated for 5.12 GHz sampling. We acquire full waveforms, and use C++ along with libraries from the analysis toolkit ROOT [15] for pulse processing and subsequent analysis.
At the University of Hawaii (UH), position resolutions are studied using a 90Sr (beta-emitting) source. A lead collimator is used to limit the incident position of betas from the source onto a narrow region of the scintillator. The collimator geometry limits the range of incident positions of betas on the scintillator to under 2 mm. The entire collimator is mounted to a Velmex XSlide (XN10-0120-M01-71), driven by a stepper motor (PK245-01AA), so that the position of incidence can be scanned over the length of the scintillator bar under test. Source positions are varied by 5 mm per step, via a USB interface to the motor controller. The manufacturer-specified repeatability and step sizes are well below our resolution, as well as the geometric spread induced by the collimator. The photodetectors, including bias voltage, and data acquisition electronics are identical to the SNL setup, though the waveform analysis tools to process the stored data were independently developed at each site.
For each source position, a total of 4000 interactions are acquired. The DRS4 evaluation board triggers itself on a coincident signal on both SiPMs, with a trigger threshold of roughly 7 mV. The UH setup is shown in Figure 1b. At UH, energy calibrations and resolution measurements are obtained by placing a separate 137Cs source at the center of the bar.
3 Waveform Analysis
For all measurements, we acquire the fast output (FOUT) of the SiPMs, primarily due to the finite number of samples that the DRS4 can record: for 5 GS/s digitization, trace lengths are limited to 200 ns. Waveforms recorded with the DRS4 are analyzed to determine the pulse height and time. Figure 2 shows two example waveforms from the two readout SiPMs of a scintillator bar, in this case EJ-204 with no reflector material. The pulse shape from the FOUT of the SiPM typically has a significant dip below baseline, shown in the figures around 100 ns: for this reason we take the pulse height, or maximum sample value after baseline subtraction, for the energy measurement. In addition, the DRS4 output often includes one or two sample spikes that are removed by considering the mean before and after a particular sample value. Finally, a smoothing filter is applied.
The pulse time is the interpolated value between samples corresponding to 50% of the maximum value on the rising edge of the filtered pulse. This timing algorithm was found to outperform methods based on the zero crossing of the derivative. Figure 2 shows the original waveform output from the DRS4, the result after spike removal and smoothing is applied, and the pulse time. The same trace zoomed into the pulse time is also shown with the samples indicated by dots on the filtered output.
4 Detector Response
4.1 Energy response
With both experimental setups, the single photon response of SiPMs used for each end of the bar was characterized so that an absolute comparison of the overall collection efficiency can be made between bars. In order to observe the single photon response, the FOUT was amplified with a Photek PA200-10 (Mini-Circuits ZFL-1000LN+) 20 dB amplifier at SNL (UH) and data was acquired with a random trigger and no light source in the enclosure. For two SiPM pixels at SNL, Figure 3 shows the maximum pulse height for interactions in which a pulse was found over threshold. The first peak is due to noise pulses above the software threshold of the peak-finding algorithm, and the subsequent peaks are the single, double, and triple photon responses. The results of a four-gaussian fit are included. We calculate the single photon amplitude as the average distance between the mean of the real (not noise) peaks: 0.226 mV for channel 1 and 0.223 mV for channel 2 when corrected for the gain of the amplifiers. Table 2 lists the single photon pulse heights for both apparatuses.
For energy resolution measurements with 22Na tagged or 137Cs data, interactions in the central 5 mm of the bar are selected by coincidence with the trigger scintillator (22Na) or by using the timing difference calibration from the position scans (137Cs). The resulting energy spectrum, calculated from the geometric mean of the calibrated energy measurements at each end of the bar, , is used to compare to the expected spectrum without any resolution effects from the Klein-Nishina formula. In order to obtain the energy resolution, the experimental result is converted to keVee units with a linear transformation:
[TABLE]
Next, an arbitrary y-scale, , is applied to the Klein-Nishina prediction for the gamma emissions resulting from the source superposed with a power law contribution to account for down-scattered gammas, and a gaussian convolution is performed with a standard deviation of:
[TABLE]
The terms in Equation 5 represent geometrical effects of light transmission (), the statistical variation of the production and multiplication of photo-electrons (), and the electronic noise () [17]. The power law has an additional two parameters () and (). The minimization routine MINUIT [18, 19] is used to find the parameters, through , for which the of the convolved Klein-Nishina spectrum and measured energy spectrum is minimized. This is a large parameter space, so many of the parameters are restricted in range, or in the example of the offset in the linear transformation, fixed to the known value. The range over which the fit is performed is also restricted to the region of the Compton edge feature. As an example, for a bare EJ-204 bar Figure 4 shows the resulting convolved model prediction and calibrated experimental spectra after the minimization for the coincident 22Na spectrum. Energy resolution results using both 22Na and 137Cs data for all configurations are summarized in Table 7.
4.2 Position Response
The position resolution is evaluated with both setups. It should be noted that, to increase performance by a factor of ten compared to traditional two-plane scatter camera systems, we desire an overall position resolution of roughly 10 mm () [2]. This translates to a z-position resolution of 9.8 mm, given that the and positions are mm ().
Results are presented below for the position resolution evaluated with the difference in time of arrival at each end of the bar, denoted , as well as the log of the charge amplitude ratio at the end of each bar, denoted . For each interaction, the difference in times and the log of the charge amplitude ratio are evaluated, and the distribution of each for a given scan position/interaction location is fit to a Gaussian function. Under the assumption of a single exponential attenuation model, the form of the log of the charge amplitude ratio with interaction location () is expected to be linear:
[TABLE]
where are the pulse heights of channel 1 and 2, is the position along the bar, is the total length of the bar, and is the effective attenuation length. However, this assumes that the effective attenuation length (a function of reflection losses and the bulk attenuation) is the only source of light loss and is constant throughout the scintillator bar. The difference in time is also expected to be linear if the velocity of light within the scintillator bar is constant throughout:
[TABLE]
The values are then combined to form the Best Linear Unbiased Estimator (BLUE) [16].
4.2.1 Scanning Results with 90Sr and 22Na
Example position characterizations with both the difference in timing and the log ratio of the charge amplitude is shown for 90Sr (Figures 5 and 6) and 22Na (Figures 7 and 8). Only interactions with an energy deposition between 300 and 400 keVee are used for this analysis. Both the mean of the Gaussian fit and the standard deviation as a function of distance is shown, and the position resolution is calculated as , in which is the slope of the first order polynomial fit to the mean as a function of , and is the average of the standard deviations as a function of determined with a zeroth order polynomial fit (22Na) or as a simple average (90Sr). Our data show only minor deviations from a linear fit in this regime. For example, for the 22Na data, the maximum deviation from the linear fit on the order of 50 ps. A summary of all the position resolution results are presented in Tables 3 and 4. For the 22Na data, each measurement in Table 4 corresponds to a specific and unique sample of scintillator, with the indicated wrapping. In order to study systematic effects, repeated measurements were performed on some bars for the 90Sr scans, and bars used with wrappings were also tested bare. The errors quoted are statistical, propagated from the errors on the fit values. The BLUE combination of the first two columns is shown in the third.
4.2.2 Comparison
The two independent measurement setups and sources provide a valuable tool to compare results and identify significant systematic effects that can cause differences in effective resolutions. An understanding of such systematic effects can lead to component selection and design decisions that improve the robustness of the resolution results. In order to make a direct comparison for each scintillator and wrapping at each test site, we have collected multiple repeated measurements into a combined measurement for each setup. This comparison is shown in Table 5, which accumulates results based off of entries from Tables 3 and 4.
When multiple measurements are made for different samples of the same scintillator and surface treatment, these measurements are averaged into a single entry. Statistical uncertainties in Table 5 are based on the average of statistical uncertainties for multiple entries, if available. Systematic uncertainties dominate the measurements, as can be seen from the significant variations in timing-based and amplitude-based resolution both between sites as well as within measurements taken at the same site using the same configuration. Our systematic uncertainty estimation assumes that systematic uncertainties at each site are unique, but that there is a single systematic uncertainty at each site that dominates uncertainties for all measurements taken there. We thus assume that our measurements at each site are normally distributed, with a standard deviation corresponding to the site’s systematic uncertainty. In this case, repeated measurements of resolution for the same material with the same surface treatment can be considered as drawing two samples from a single normal distribution of resolutions. We can estimate a standard deviation of all such differences, and then infer a site’s systematic uncertainty, , using the following formula:
[TABLE]
where A and B correspond to a pair of repeated measurements for the same configuration, and is the total number of measurement pairs. A graphical depiction of the results, including these systematic uncertainties, is shown in Figure 9.
The summary comparisons presented in Table 5 and shown graphically in Figure 9 show a few notable effects. In general, using timing differences seems to be a more robust approach to calculating : the agreement between the 90Sr and 22Na results is much closer for most measurements, despite significant differences in the experimental setups (to be described in Section 4.2.3). Furthermore, the systematic uncertainties associated with the timing-based measurements are generally much smaller, indicating better repeatability between identical setups.
We note that there are multiple methods that could be used to estimate systematic uncertainties, in particular with the 90Sr data taken at UH, since there are many repeated measurements over identical configurations. It is clear from the 90Sr data in Table 3 that the large systematic uncertainties are driven primarily by the EJ-204 measurements. If these are excluded from the above analysis, the amplitude-based systematic uncertainty drops from 4.5 mm to 1.8 mm, giving a result quite consistent between sites. Since the root cause of this larger variation for the EJ-204 samples is unclear, we include the EJ-204 data in the composite estimate to be conservative. We also note that the ESR data hints at larger systematics using ESR than that seen with bare bars. Again, it is not clear from the limited sample size whether this is a feature of the ESR wrapping or was specific to these samples or experimental setups, so we conservatively include these samples when calculating the overall site uncertainty.
4.2.3 Studies on Systematic Variations between Sites
While the relative trends in are the same in the two setups, the absolute agreement for is notably worse than for . In addition, the systematic uncertainties on are large, indicating substantial variations observed within data on the same setups. A number of studies were conducted in order to better understand these variations in , all conducted using the 90Sr setup at UH, and using bare EJ-204 bars.
The experimental setup for EJ-204 with no reflector material, which shows the most significant difference between the two measurement sites, was re-tested. Three different scenarios based on possible systematic differences are investigated and summarized in Table 6:
Modified optical coupling, using approximately three times more than the typical amount of EJ-550 silicone grease. 2. 2.
Modified triggering conditions, using a logical OR of trigger signals from either side of the bar, compared to the baseline AND trigger. 3. 3.
Added a metal support underneath the EJ-204 bar near the midpoint between the two ends, as shown in Figure 10.
The position resolutions using the difference in time remained within the systematic errors, with the exception of the addition of the metal support (configuration 3). For the log ratio of the charge amplitude, an improvement of less than 5% was obtained in by adding more silicon grease. It rose up to 11.1% when the condition of the trigger was changed, and it reached 40.1% up when a support for the bar was placed.
The relative invariance of the timing-based results is generally as-expected, since the rising edge of the pules is less susceptible to photon variations compared amplitude measurements, which should vary proportionally to the total number of detected photons. The number of detected photons can vary with optical coupling, triggering, or interaction with support structures. Optical coupling has a clear impact on observed amplitudes, so better coupling should generally improve performance due to a higher signal-to-noise ratio. Triggering conditions can cause an asymmetry in the types of interactions observed: the standard AND based trigger can result in a bias toward generally larger depositions, whereas depositions resulting in a single large pulse on one end and a small pulse on the other end might be missed entirely. These types of interactions are precisely those that would show good amplitude-based resolutions due to the large asymmetry between near- and far-end amplitudes, so this improvement is not unexpected.
On the other hand, the addition of the support structure had a much larger impact than originally anticipated. The significant improvement in is coupled with a substantially lower light yield, as observed in 137Cs calibration data. This implies that the support itself is causing an overall decrease in light collection, of order 20% for bare bars, possibly due to interfering with TIR at the contact positions. Since the baseline 90Sr data was taken with no mid-bar support and the 22Na data was taken with supports, this could explain some of the systematic differences seen there. It should be noted, however, that the support types likely differ in their effect on optical transport because of their shapes (rectangular vs. cylindrical) and reflectivity (bare aluminum vs. black felt wrapped). The effect of a support is less clear in the cases of ESR or Teflon, though we speculate that it should impact Teflon the least, since it is already in good contact with the bar, compared to ESR, which is loosely fitted around the bar.
4.2.4 Performance as a Function of Deposited Energy
It is expected that there will be variation in position resolution as a function of deposited energy due to improved photostatistics, which are not readily apparent in the limited 300–400 keVee measurements reported to this point. Figure 11 shows and for Teflon-wrapped EJ-204 as a function of energy from the 90Sr data. Using the same position calibration as that obtained for the nominal 300–400 keVee bin, resolutions were studied in the range of 250–600 keVee. As expected, both resolutions improve with energy, indicating that system performance for neutron imaging is expected to be better than our reported summary resolutions for higher energy depositions.
4.3 Timing Response
The overall timing response of the system is evaluated with the tagged 22Na data, in which the interaction time is defined as
[TABLE]
where is the pulse time of the tag scintillator, and are the pulse time of the bar interaction evaluated from SiPM1 and SiPM2, respectively. It should be noted that, to increase performance by a factor of ten compared to traditional two-plane scatter camera systems, we desire an overall timing resolution of roughly 1 ns () [2]. The distribution of for the center of the EJ-204, bare measurement is shown in Figure 12a, where only interactions in which the energy deposition is between 300–400 keVee are included. The interaction time defined in this manner is expected to be constant as a function of the z-position, if we assume a constant velocity throughout the bar, as in Equations 6 and 7:
[TABLE]
However, as Figure 12b shows, this is not the case. Nor is the standard deviation constant, as shown in Figure 12c. This effect, which was seen for all test configurations, may be due to the changes in the pulse shape along the rise as the light propagates down the bar. In order to ensure that electronic crosstalk is not contributing, the test configuration with EJ-204 and Teflon wrapping was repeated with a LeCroy WaveRunner 640zi oscilliscope capturing full waveforms and applying similar processing methods: this interaction time feature persisted, as shown in Figure 13. While this feature does not directly affect single bar characterizations, it will be critical to characterize for the purposes of double scatter imaging. The standard deviation of the interaction time is also dependent on the interaction location, however the effect may be statistical due to the lower light levels detected for interactions near the center of the bar. It should be noted that the results are an upper limit on the timing resolution, due to the unknown timing resolution of the tag scintillator. While the timing resolution of the tag scintillator could be calculated with the assumption of no correlations between , , and , it is not clear this is a valid assumption. The results for all configurations are presented in Table 7.
4.3.1 Timing Response with
Additional studies were carried out at UH with two scintillator bars triggered in tandem, as shown in Figure 14. The interaction time was calculated for each bar using Equation 8, and the difference between the interaction times was studied. The distribution of interaction time differences, is shown in Figure 15a for a fixed source position. The timing difference as a function of energy deposited in the second bar is shown in Figure 15b. A further test was carried out with the same setup and a moving 90Sr source, acquiring 1000 interactions in steps of 50 mm along the length of the bar. The mean and standard deviation of the timing distribution as a function of is shown in Figure 16a and 16b. Only interactions in which the energy deposition in bar 1 is MeVee are presented, and outliers with timing differences greater than 5 ns are excluded.
While we observe similar timing resolutions to the 22Na data, we do not appear to observe the same systematic time shift as a function of interaction position. We conclude that this is consistent with the hypothesis of pulse shape differences seen in the 22Na data, as in this case the effect happens on both the front and rear bars, and largely subtracts away.
5 Summary and Discussions
Table 7 summarizes the timing, position, and energy resolution for all configurations tested. In both amplitude-based and timing-based resolutions, Teflon-wrapped EJ-204 and EJ-230 show the best performance overall. As the performance is generally in agreement within uncertainties, EJ-204 is identified as the best candidate for neutron kinematic imaging, as it also offers significantly better light yield. Because the fission spectrum motivates the lowest possible detection threshold, we chose EJ-204 over EJ-230 for this particular application. The coupling of Teflon and ESR performed similarly in the case of EJ-204, however the difficulties associated with wrapping ESR in a uniform fashion for a 64-bar system, along with optical crosstalk concerns [20], motivated the use of Teflon.
The results generally suggest that timing-based position calculations should be more robust than amplitude-based calculations due to systematic effects related to optical coupling and triggering. Variations from mechanical construction and optical coupling may have a significant impact on amplitude-based calibrations, and could lead to more complicated requirements on calibration. We note other effects that also may have significant impact on a full-scale detector designed around such scintillating elements. For example, the systematic studies indicating variations due to optical coupling, trigger conditions, and structural supports all have significant impact on energy calibrations and light yields. We have also observed significant differences in performance between repeated measurements of the same scintillator with the same surface treatment, implying that careful calibration of individual elements may be required for a large array of such scintillators. These calibrations will likely need to be done in-situ, since many of our systematic uncertainties are attributed to effects, such as optical coupling, that will arise during assembly of the system. Nevertheless, the data reported here indicate that sub-cm position resolutions can be obtained.
Finally, we note that although the data presented here show reasonable linearity for the amplitude-based resolutions, prior data on longer bars ( m length) were better fit by a double exponential. This suggests strongly that the optimizations of both scintillator material and wrapping may need to be reevaluated for longer bars, and that the results reported here should not be extrapolated to significantly different geometries due to the complexities of the optical photon propagation.
6 Conclusions
We have performed a series of measurements to motivate the choice of scintillator and reflector material for an optically segmented scatter-based neutron imaging system. We have determined the top performing scintillator and reflector material in terms of the timing, position, and energy resolution, and overall detectable light to maximize the detection efficiency. In the case of scintillator bars coupled to SensL’s J-series SiPMs, the top performer was EJ-204 wrapped in Teflon. We expect a threshold of approximately 30 keVee given the light observed and the threshold of the device’s electronics.
We have also explored the systematic variability of the position resolution measurement, and have determined that the variability of the position as determined by the log ratio of the amplitudes is greater than by the position determined by the difference in pulse time. Finally, we observed that the measured interaction time is variable with the interaction location, which is presumed to be biased due to pulse-shape distortions on the rising edge as the light propagates along the bar.
7 Acknowledgments
Sandia National Laboratories is a multimission laboratory managed and operated by National Technology and Engineering Solutions of Sandia, LLC, a wholly owned subsidiary of Honeywell International, Inc., for the U.S. Department of Energy’s National Nuclear Security Administration under contract DE-NA0003525. This paper describes objective technical results and analysis. Any subjective views or opinions that might be expressed in the paper do not necessarily represent the views of the U.S. Department of Energy or the United States Government.
We would like to thank the US DOE National Nuclear Security Administration, Office of Defense Nuclear Non-proliferation for funding this work.
We thank Serge Negrashov for data acquisition software development that was utilized in this work, and Glenn Jocher for prior work on longer scintillating bars that helped to inform this study.
The reference list from the paper itself. Each links out to its DOI / PubMed record.
- 1[1] K. Weinfurther, J. Mattingly, E. Brubaker, and J. Steele “Model-based design evaluation of a compact, high-efficiency neutron scatter camera” Nuclear Instruments and Methods in Physics Research, A 883 (2018) 115-135
- 2[2] J. Braverman, J. Brennan, E. Brubaker, B. Cabrera-Palmer, S. Czyz, P. Marleau, J. Mattingly, A. Nowack, J. Steele, M. Sweany, K. Weinfurther, E. Woods. “Single-Volume Neutron Scatter Camera for High-Efficiency Neutron Imaging and Spectroscopy” ar Xiv:1802.05261 (2018)
- 3[3] J. Koblanski “Antineutrino Detection and Neutron Directionality Studies with the mini Time Cube, the World’s Smallest Neutrino Detector” Ph.D. Dissertation, University of Hawai‘i at Mānoa (2018)
- 4[4] J. E. M. Goldsmith, M. D. Gerling, and J. S. Brennan “A compact neutron scatter camera for field deployment” Review of Scientific Instruments 87 (2016) 083307
- 5[5] S. Vandenberghe, E.Mikhaylova, E. D’Hoe, P. Mollet and J.S.Karp “Recent developments in time-of-flight PET” EJNMMI Physics (2016) 3:3
- 6[6] M. Sweany, J. Brennan, B. Cabrera-Palmer, S. Kiff, D. Reyna, and D. Throckmorton “Above-ground antineutrino detection for nuclear reactor monitoring” Nuclear Instruments and Methods in Physics Research, A 769 (2015) 37-43.
- 7[7] S.Oguri, Y.Kurodaa, Y.Kato, R.Nakata, Y.Inoue, C.Ito, and M.Minowa “Reactor antineutrino monitoring with a plastic scintillator array as a new safeguards method” Nuclear Instruments and Methods in Physics Research, A 757 (2014) 33-39
- 8[8] J Ashenfelter et al. “The PROSPECT physics program” J. Phys. G: Nucl. Part. Phys. 43 (2016) 113001