Cavitation and ventilation modalities during ditching
Alessandro Iafrati, Silvano Grizzi

TL;DR
This study experimentally investigates cavitation and ventilation phenomena during aircraft ditching, revealing velocity-dependent flow modalities and their impact on aircraft hydrodynamics and safety during water landings.
Contribution
It provides new insights into the velocity thresholds and flow transitions between cavitation and ventilation during ditching, highlighting limitations of scaled model tests.
Findings
Cavitation starts at about 30 m/s.
Flow modalities vary significantly with small velocity changes.
Transition from cavitation to ventilation affects aircraft load distribution.
Abstract
The flow taking place in the rear part of the fuselage during the emergency landing on water is investigated experimentally in realistic conditions. To this aim, tests on a double curvature specimen have been performed at horizontal velocities ranging from 21 m/s to 45 m/s. Tests data highlight different cavitation and/or ventilation modalities which are highly dependent on the horizontal velocity, with substantial variations in the flow features occurring with velocity variations of few meters per second. For the specimen considered here, the inception of the cavitation is found at about 30 m/s, confirming that scaled model tests performed at small horizontal velocities are unable to capture the hydrodynamics correctly. By comparing pressure data, underwater movies and force measurements, it is shown that the transition from cavitation to ventilation condition has a significant effect…
Click any figure to enlarge with its caption.
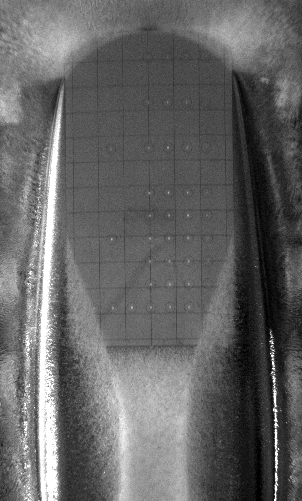 Figure 1
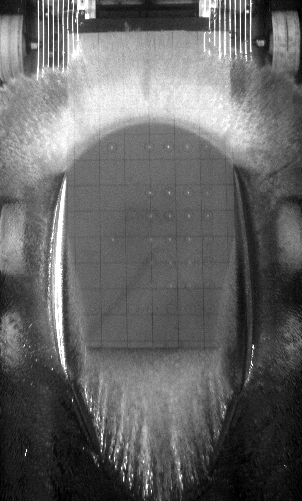 Figure 2
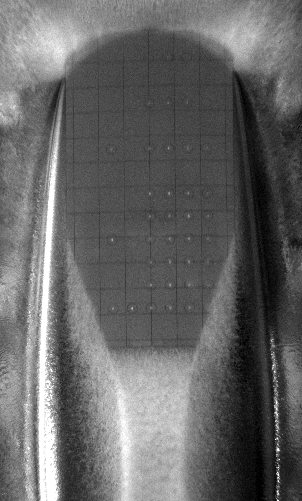 Figure 3
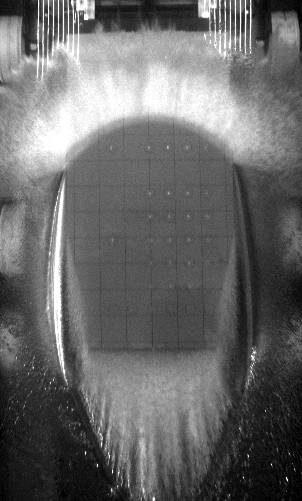 Figure 4
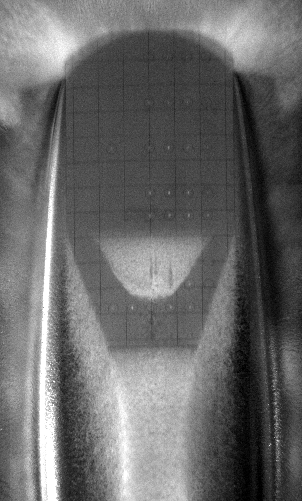 Figure 5
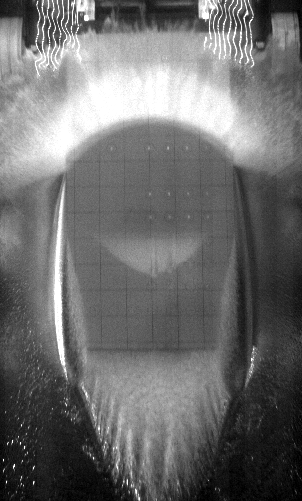 Figure 6
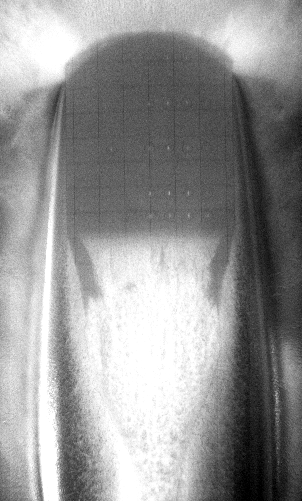 Figure 7
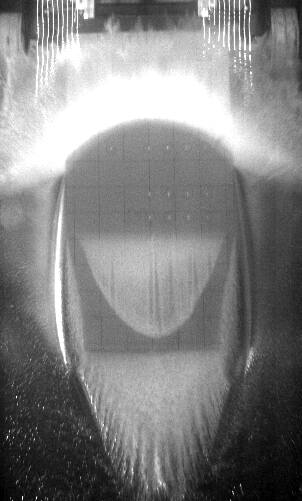 Figure 8
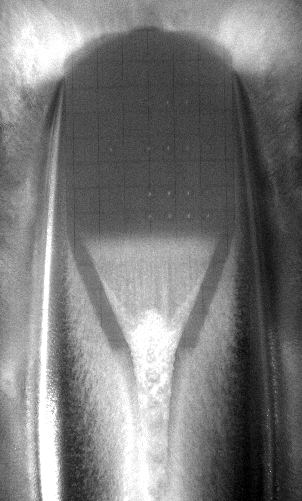 Figure 9
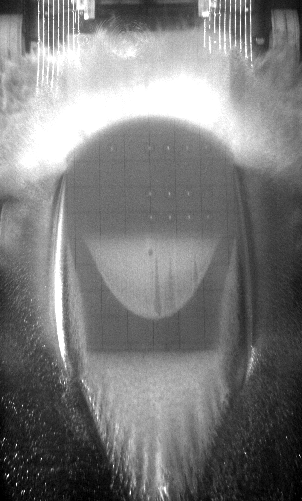 Figure 10
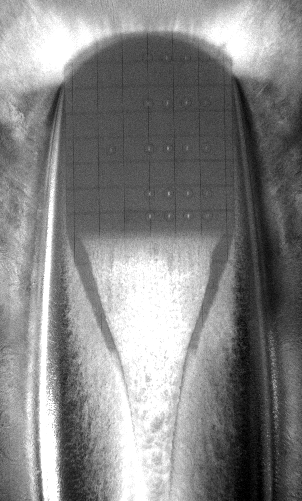 Figure 11
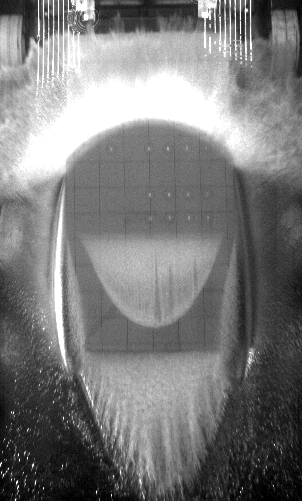 Figure 12
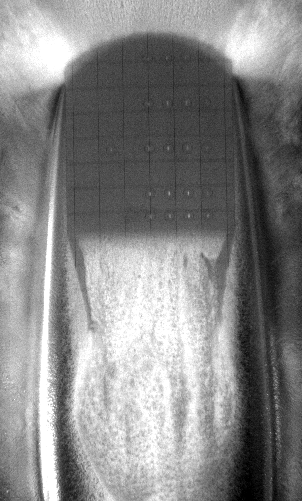 Figure 13
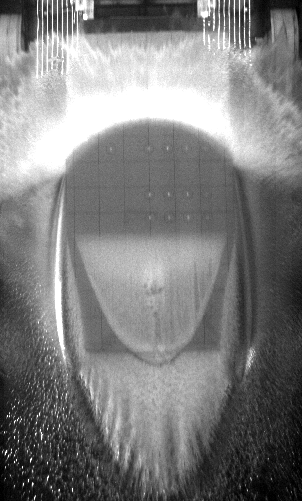 Figure 14
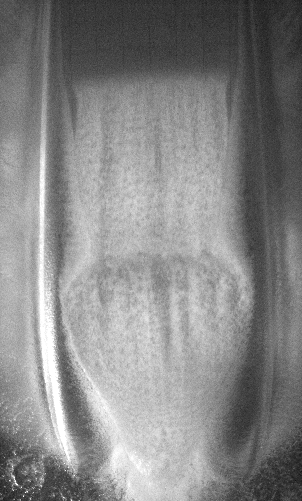 Figure 15
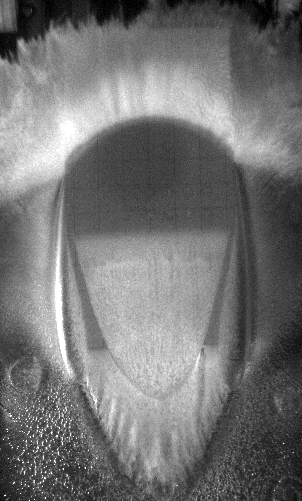 Figure 16
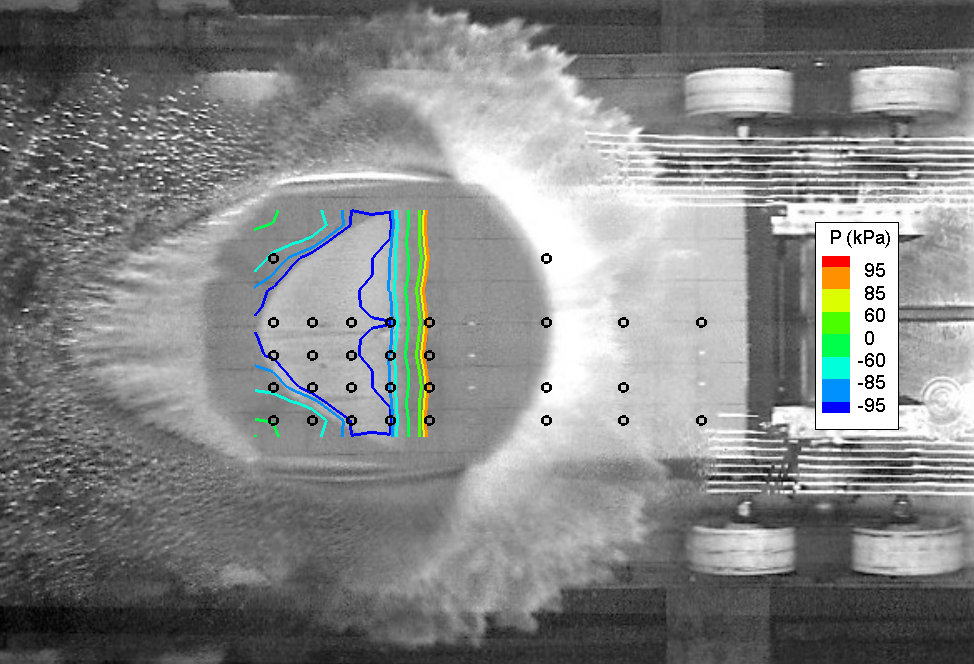 Figure 17
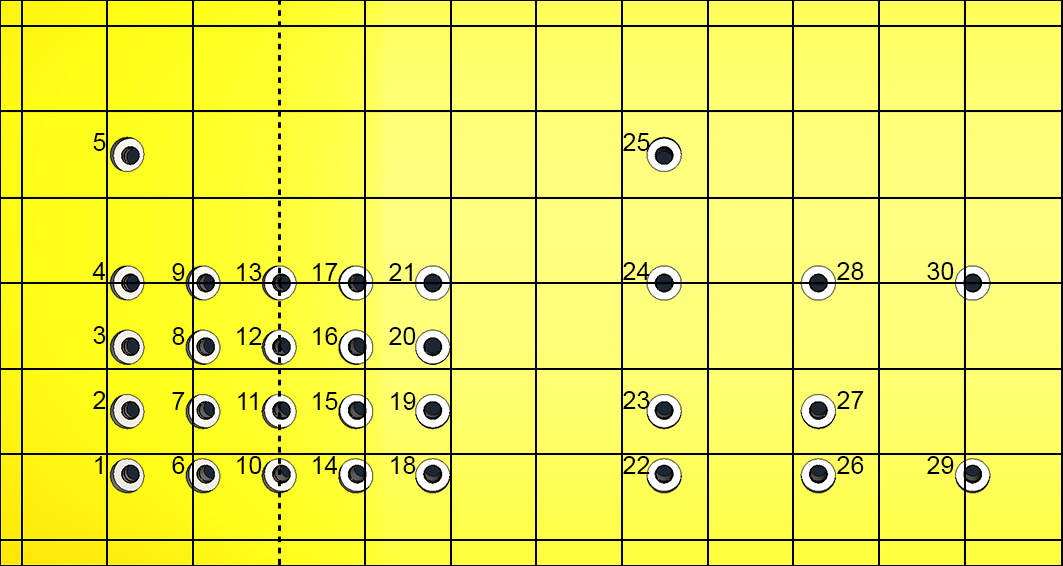 Figure 18
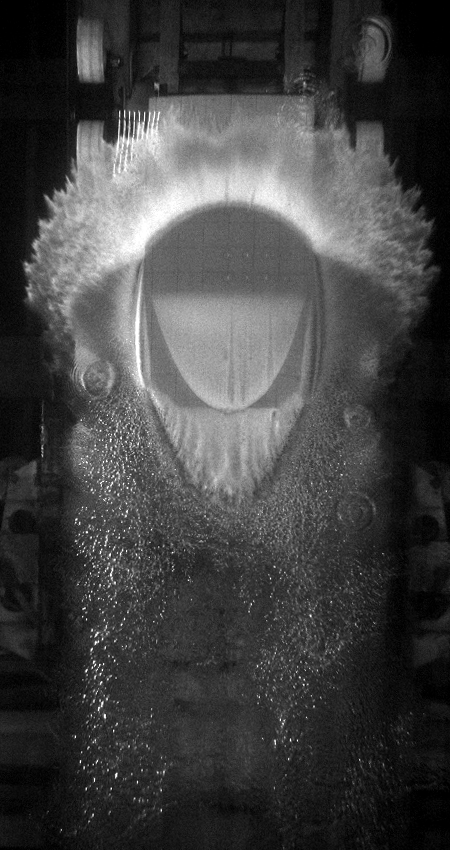 Figure 19
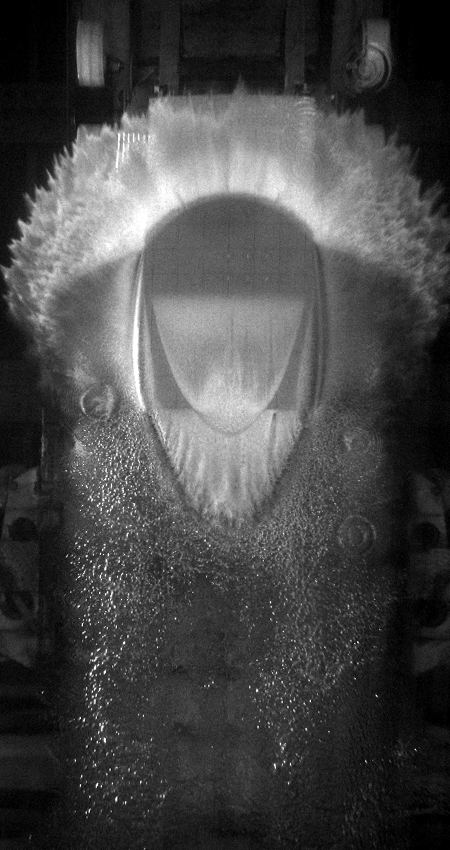 Figure 20
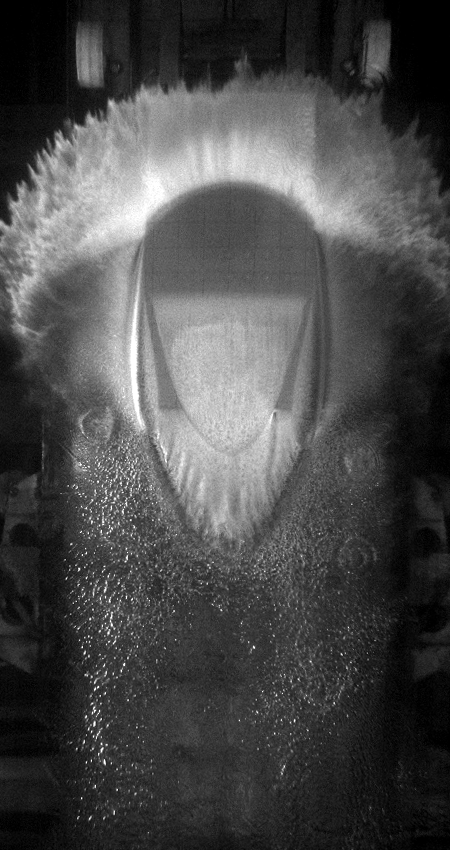 Figure 21
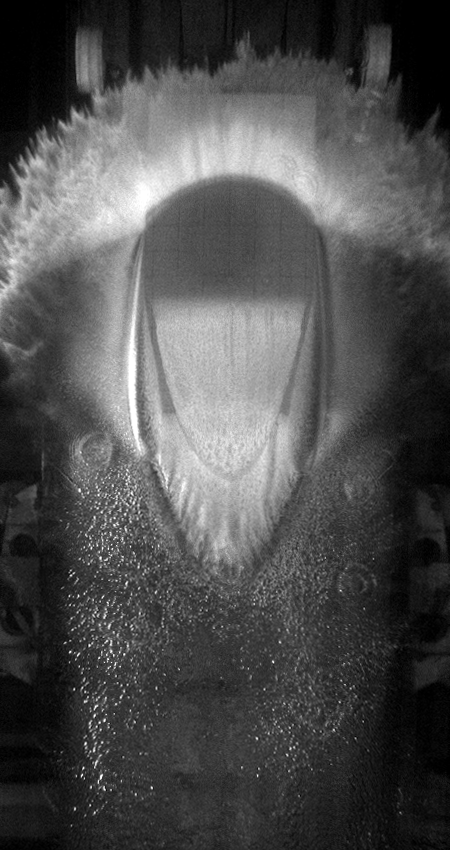 Figure 22
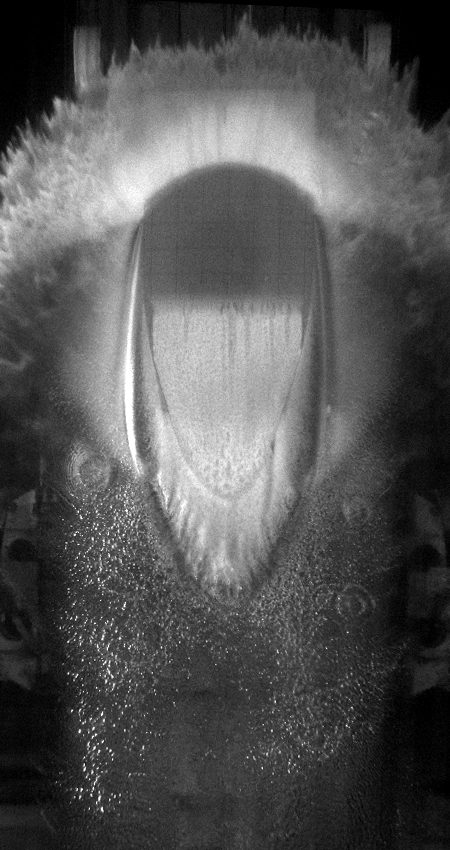 Figure 23
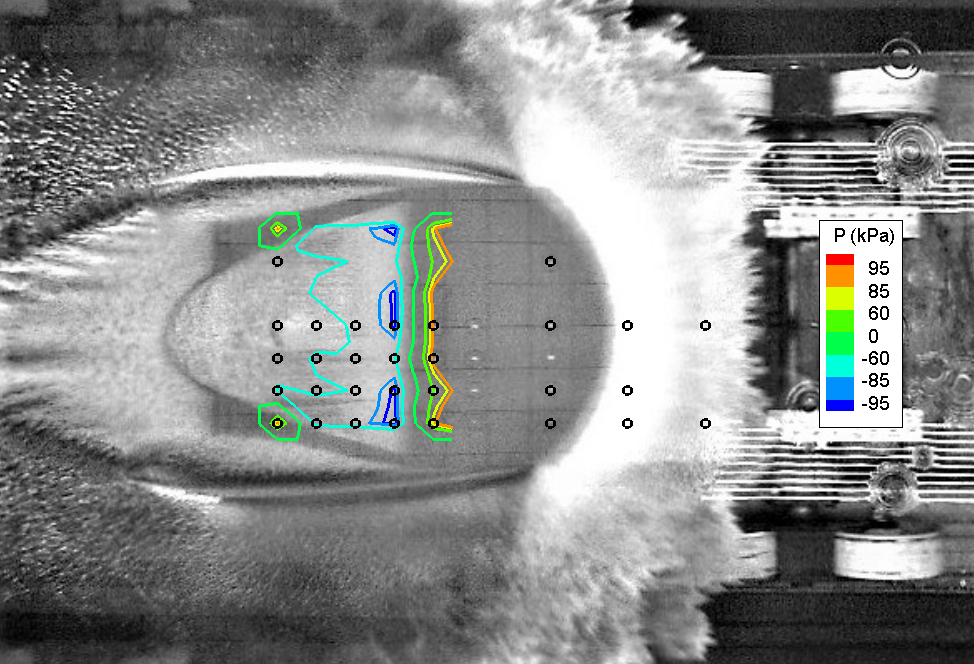 Figure 24
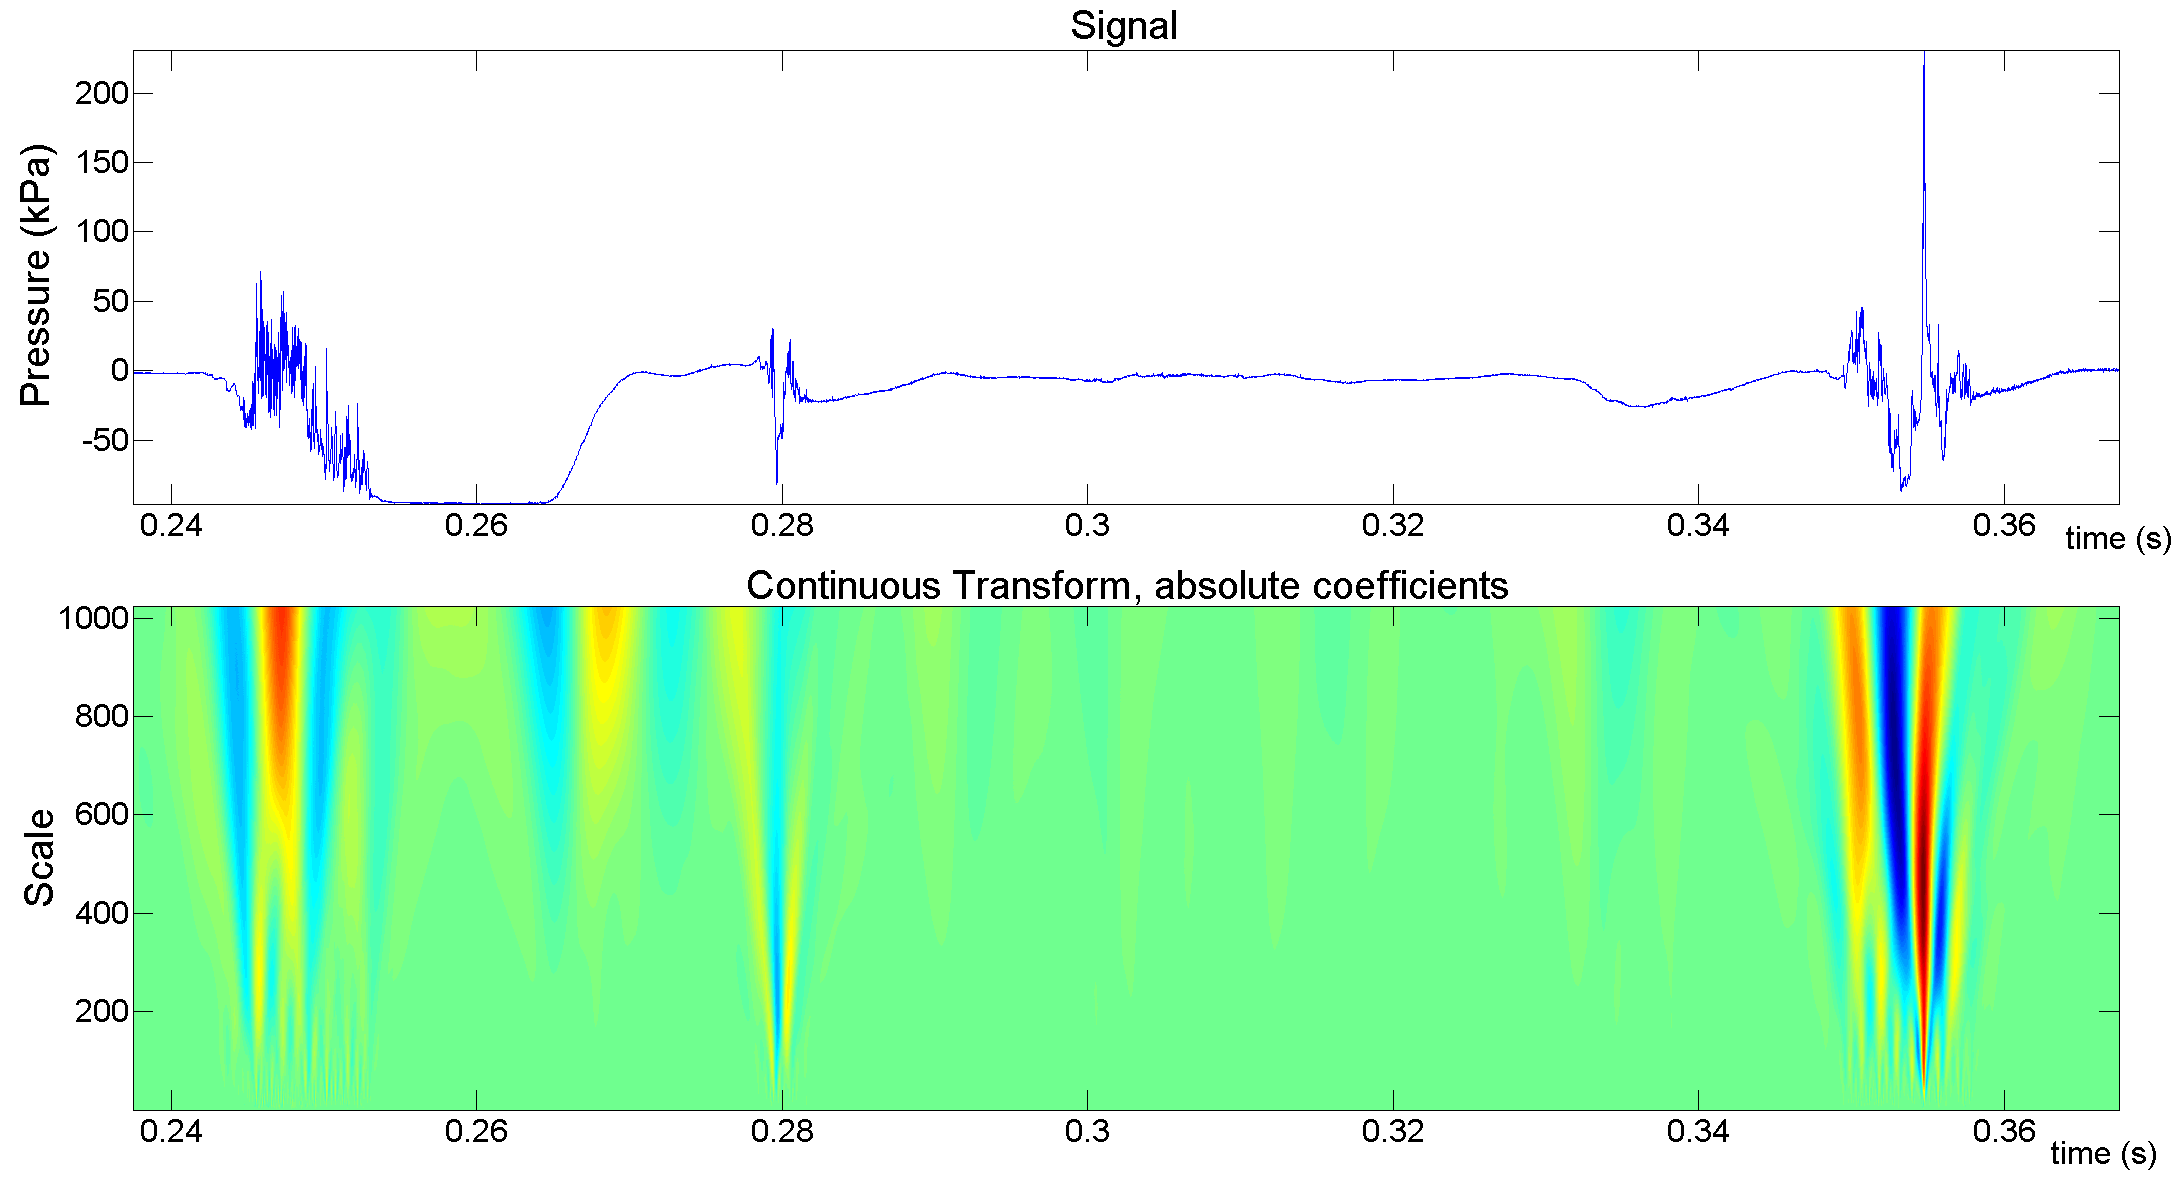 Figure 25
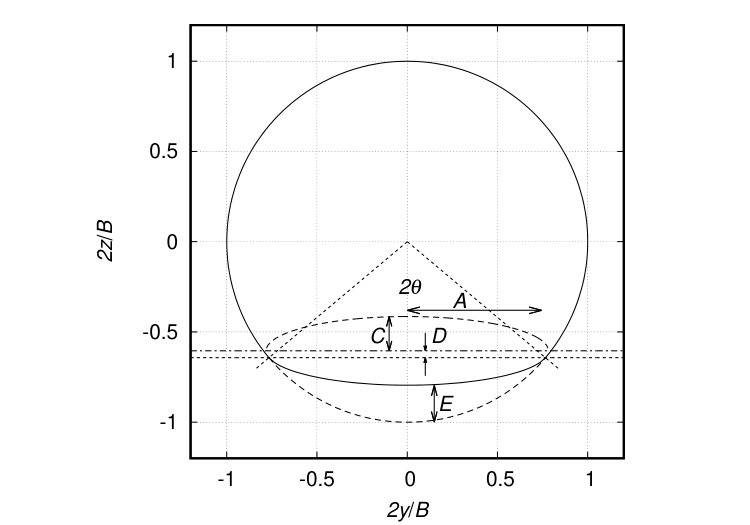 Figure 26
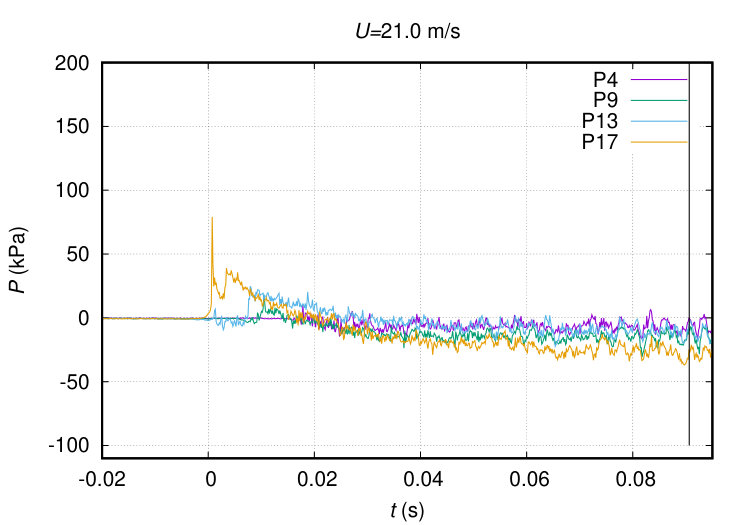 Figure 27
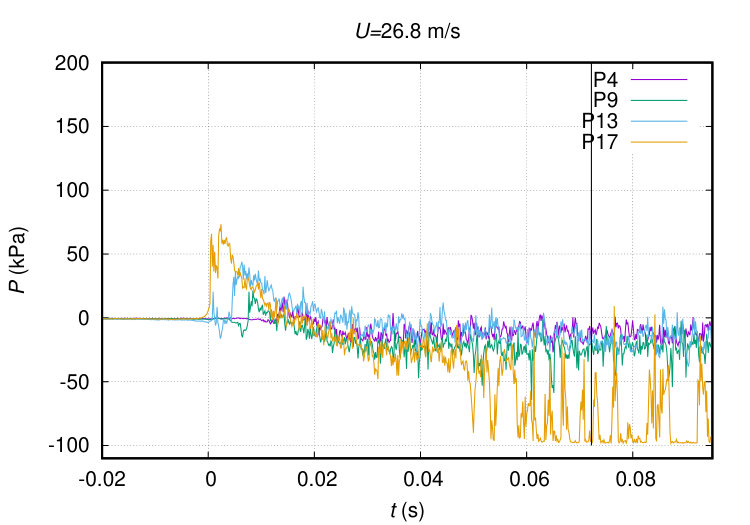 Figure 28
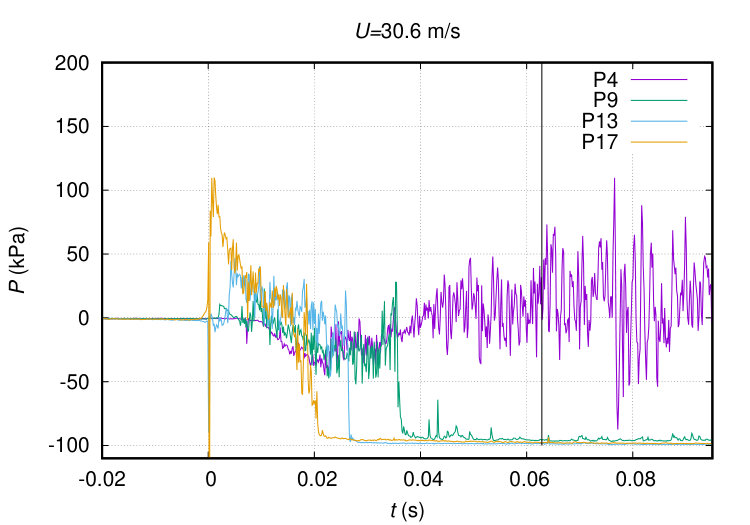 Figure 29
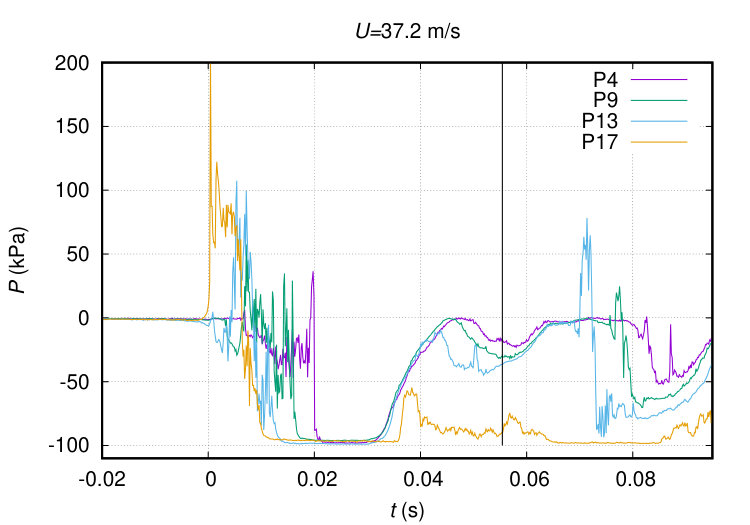 Figure 30
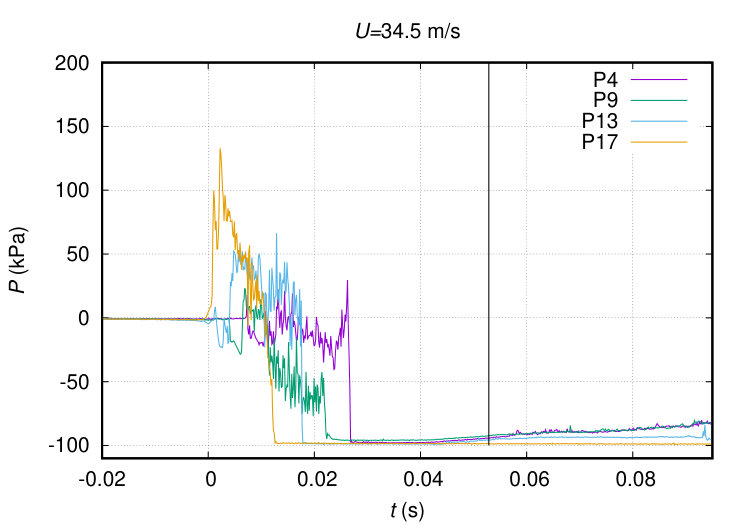 Figure 31
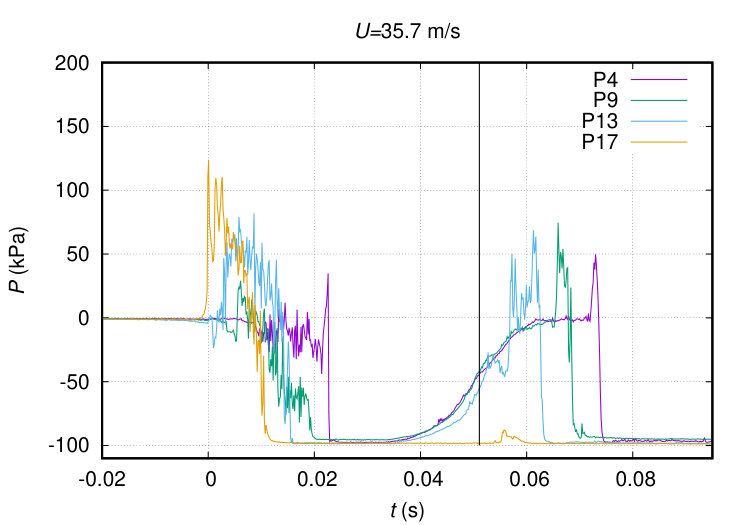 Figure 32
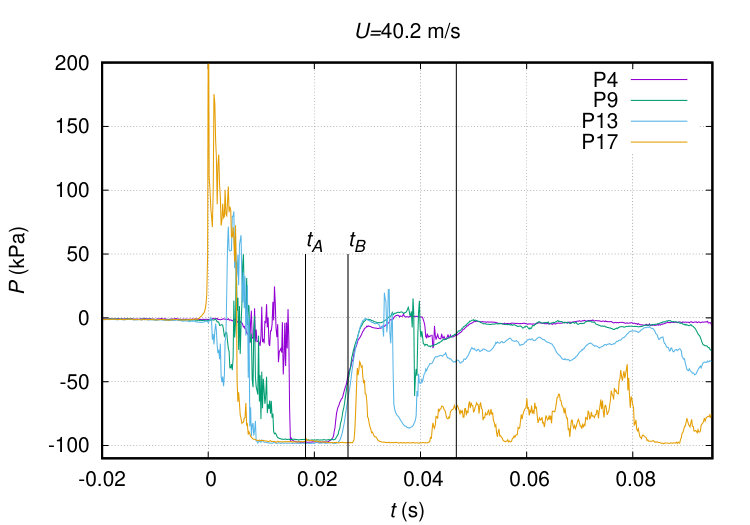 Figure 33
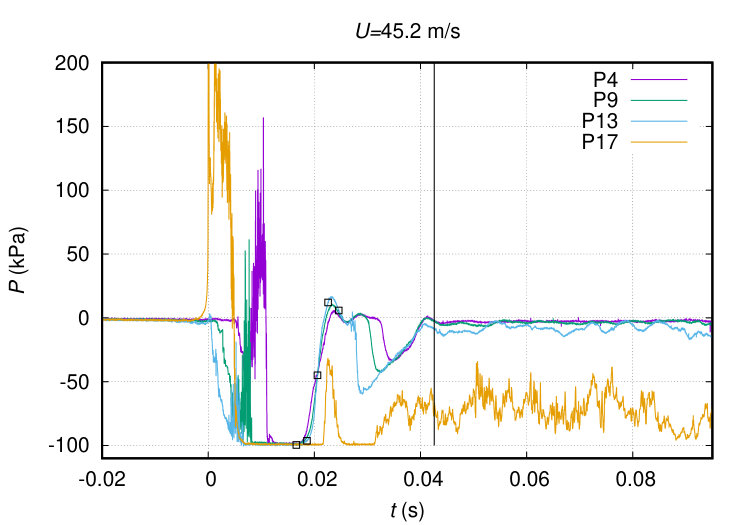 Figure 34
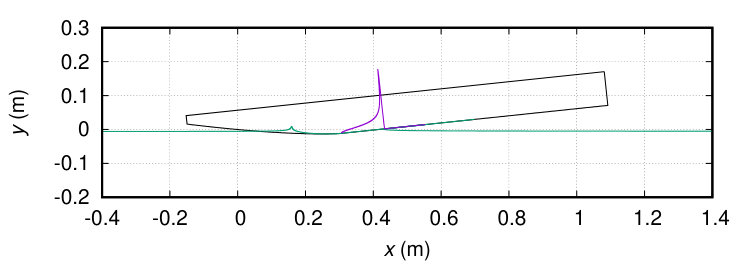 Figure 35
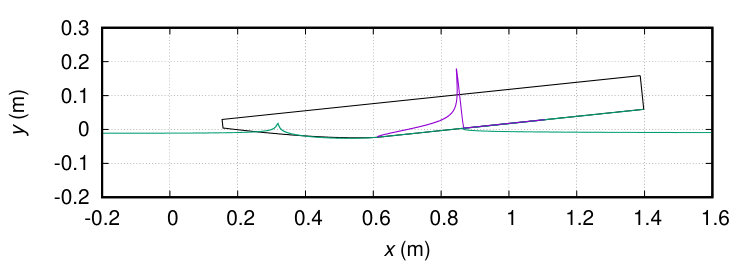 Figure 36
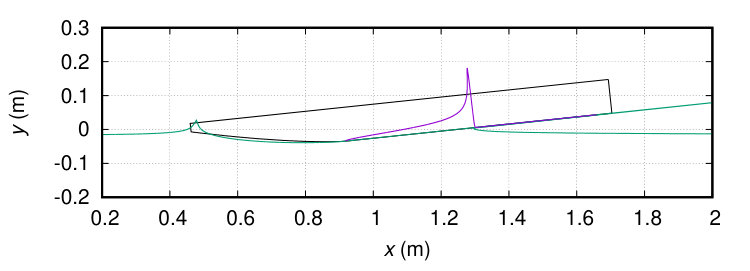 Figure 37
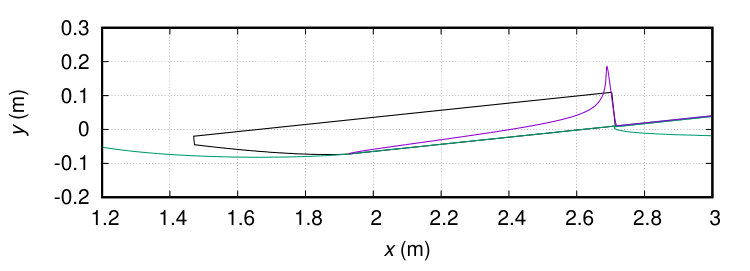 Figure 38
 Figure 39
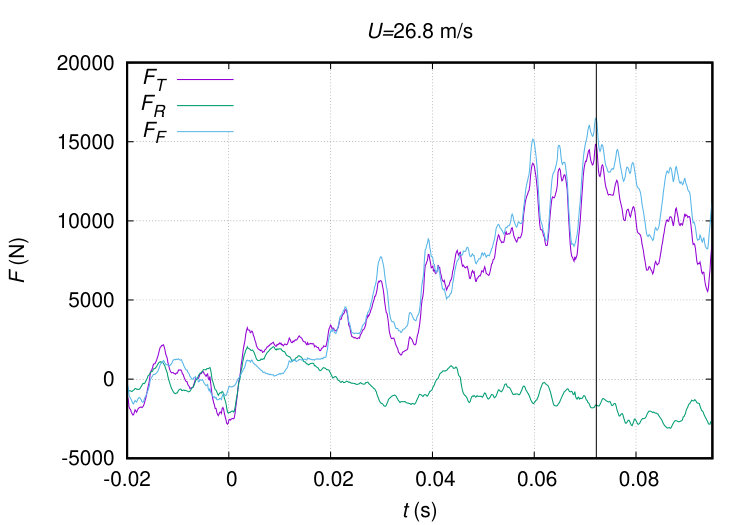 Figure 40
| (m/s) | ||||||||
|---|---|---|---|---|---|---|---|---|
| Type | NC | NC | IC | FCB | CAV | CV | CV | CV |
Peer Reviews
No public reviews on file for this paper yet. If you reviewed it on a platform where reviews are public (OpenReview, ICLR, NeurIPS, ICML), you can paste yours below so the community can read it here.
Videos
No videos yet. Explain this paper in a talk, walkthrough, or lecture? Add one.
Cavitation and
ventilation modalities during ditching
A. Iafrati
National Research Council - Institute of Marine Engineering - Rome, Italy.
S. Grizzi
National Research Council - Institute of Marine Engineering - Rome, Italy.
Abstract
The flow taking place in the rear part of the fuselage during the emergency landing on water is investigated experimentally in realistic conditions. To this aim, tests on a double curvature specimen have been performed at horizontal velocities ranging from 21 m/s to 45 m/s. Tests data highlight different cavitation and/or ventilation modalities which are highly dependent to the horizontal velocity, with substantial variations in the flow features occurring with velocity variations of few meter per second. For the specimen considered here, the inception of the cavitation is found at about 30 m/s, confirming that scaled model tests performed at small horizontal velocities are unable to capture the hydrodynamics correctly. By comparing pressure data, underwater movies and force measurements, it is shown that the transition from cavitation to ventilation condition has a significant effect of the longitudinal distribution of the loading which, together with inertia, aerodynamic loads and engine thrust, governs the aircraft dynamics.
††preprint: AIP/123-QED
I Introduction
The ditching is an emergency procedure consisting in a controlled landing on water. The event is well known and the risk of ditching is reminded on every flight before the take off. Whereas according to the statistics the event is fortunately rare, the ditching became popular after the Hudson river event in February 2009.
Of course for a successful event it is important that all influencing factors are well settled. One is certainly the pilot skill, but, equally important, the aircraft has to be properly designed. The design for ditching is not aimed at preventing failures in the structure but mainly at ensuring a floatation time long enough to allow a safe evacuation of the plane. The aircraft design cannot be validated by full scale tests as they would be too expensive and impractical. Nowadays, the tendency is to use computational tools Siemann and Langrand (2017); Siemann et al. (2018); Qu et al. (2015); Bisagni and Pigazzini (2018). However, the hydrodynamics of ditching and the resulting interaction with the structure, are highly nonlinear and challenging even for the most sophisticated numerical models available at this time and a careful validation versus representative experiments is deemed necessary.
Owing to the large dimensions and velocities involved, laboratory experiments are often conducted on scaled models by exploiting the Froude similarity that guarantees the correct reproduction of the ratio between inertia and gravitational forces. With such a scaling, the test velocity is reduced as the square root of the length. Of course viscous and surface tension effects, which are accounted for by the Reynolds and Weber similarities, are not properly scaledLandau and Lifshitz (1959), but their effects are minor, at least in the early stage of impactMoghisi and Squire (1981). Much more relevant are instead the effects of cavitation and ventilation which are not properly reproduced because of the different Euler number. Their relevance in the ditching phase was already discussed in previous studiesSmith et al. (1957); Zhang et al. (2012). Finally, when large structural deformations occur, the fluid loading is significantly different from that occurring on a rigid component and a proper scaling of the structure that enables a correspongly scaled hydrodynamic loading is impossible to be achievedCliment et al. (2006).
A unique opportunity to perform highly representative tests is offered by the High Speed Ditching Facility (HSDF), available at CNR-INM, where realistic specimen, albeit of limited size, may be tested at nearly full scale velocityIafrati et al. (2015). Thanks to the maximum achievable speed of 47 m/s, which is in the range of the ditching velocity for small passengers or cargo aircrafts, it allows reproducing all physical phenomena without any scaling issue.
In Ref. Iafrati, 2016a the water impact at high velocity of a thick rectangular plate is investigated. The high pressure peak at the spray root and the correspondingly large induced loads are analyzed and compared to theoretical solutions, showing the important role played by the three-dimensional effects on the of pressures and loads. The relevance of fluid-structure interaction is clearly highlighted in Ref. Iafrati, 2015a where ditching tests on flat plates undergoing very large and even permanent out-of-plane deformations are reported. The effects of the transverse curvature are analyzed instead in Ref. Iafrati, 2018. It is shown that convex curvatures, enhancing the possibility for the fluid to escape from the side, lead to a reduction of pressure and loads compared to the flat plate. In the case of a concave plate, the pressures peaks in the middle are much lower that in the flat plate case, but the total loading is essentially the same.
For the aircraft dynamics the longitudinal curvature is far more important. The effect of the fuselage shape on the aircraft dynamics was already investigated in Ref. McBride and Fisher, 1953. However, the tests, being performed at model scale, do not provide an accurate reproduction of the cavitation and ventilation phenomena that might take place at the rear. The occurrence of suction forces at the rear of the fuselage induced by the shrinking of the shape and by the longitudinal curvature is discussed in Ref. Tassin et al., 2013, albeit based on a simplified representation of the problem.
With the aim of investigating the flow taking place in the rear part of the fuselage, tests a double curvature specimen are performed. Results are provided in terms of pressures and loads, supported by underwater visualizations, and clearly shown the occurrence of cavitation/ventilation phenomena, although different scenarios are found depending on the test speed. It is found that the change from one condition to another is rather sharp and happens within velocity variations of few m/s.
Although the present study is primarily motivated by the aircraft ditching, the observed cavitation/ventilation modalities are of great interest in other applications, notably high-speed, supercavitating, underwater vehicles Wang et al. (2010) or drag reduction through air lubrication Ceccio (2010) where the occurrence of cavitation/ventilation conditions, if properly controlled, substantially enhances the vehicles’ efficiency.
II Experimental setup and instrumentation
Experimental tests were performed at the High Speed Ditching Facility: it is composed by a guide suspended over a water basin. The trolley bringing the specimen to be tested runs along the guide. The guide can be rotated enabling different vertical to horizontal velocity ratios. The specimen to be tested and the acquisition box are connected to the trolley. The trolley is accelerated by a set of elastic cords and, shortly before the contact with water, it is left to run freely thus ensuring that no external forces are acting on the trolley during the impact, but for the hydrodynamic ones and the reaction of the guide.
The tested specimen are portions of fuselage shapes described by analytical functionsIafrati and Olivieri (2017); Iafrati et al. (2019). The fuselage shape considered in this study has a circular-elliptical cross section (figure 1) typical for cargo aircrafts. The nondimensional cross section contour is defined in terms of two parameters which are the angle of tangency between the circle and the ellipse, , and the ratio . The ellipse semi-axes are given by
[TABLE]
Let
[TABLE]
the dimensional equation of the ellipse is
[TABLE]
where is the radius of the circular portion of the fuselage at the longitudinal position , origin of the axis being located at the bow.
Denoting with the breadth of the main fuselage, the local radius is given by
[TABLE]
where is the total length of the fuselage scaled by the fuselage breadth, and, similarly, and are the lengths of the forward and rear portions where the fuselage cross section shrinks with respect to the main body and is the rear end of the main fuselage. The function is the offset function which is given by:
[TABLE]
where and are real coefficients. The center of the cross section is located at for and at for . For the shape considered here the parameters are: , , , , , , degrees. The fuselage breadth for this shape is mm and thus, owing to the limits of the dimensions of the specimen allowed by the trolley, the fuselage portion used for the tests is that with mm and with and being 6710 mm and 7950 mm, respectively (figure 1) .
The acquisition box holding the plate is connected to the trolley by a set of piezoelectric load cells that provide the loads exerted by the fluid in both longitudinal and normal directions, the latter measured at rear and front positions. The rear and front cells are located 70 mm and 1455 mm ahead of the trailing edge of the specimen, respectively. A total of 30 pressure probes are installed on the specimen, most of them located in the rear part behind the 8 degrees contact line (figure 2). All signals from the sensors are acquired synchronous at a sampling rate of 200 kS/s, high enough to capture the pressure peak accurately(Van Nuffel et al., 2013). The on board acquisition is synchronized with two high speed cameras, one located at the side and used to retrieve the velocity at the impact and a second one located underwater. The latter, which is operated at 3000 fps, is positioned deep enough to cover all the impact phase, thus resulting in a resolution of about 4 mm per pixel.
III Results
The present study is focused on the effects of the horizontal velocity on the hydrodynamics of the tests performed at a pitch angle of 6 degrees and vertical to horizontal velocity ratio . The analysis of the data is limited to the impact phase, i.e. the phase lasting from the first contact of the specimen with the water surface up to the time at which the spray root reaches the leading edge of the specimen. After that time, the test speed drops suddenly as a consequence of the impact with the water on the front face of the specimen and the fore part of the trolley, and thus the data and the underwater hydrodynamics become too much dependent on the shape of the upper side of the acquisition box. As done in Ref. Iafrati, 2016b, the end of the impact phase is estimated from the propagation velocity computed on the basis of the times of the pressure peak passages at probe P28 and P30.
The analysis is started from the signals of the four pressure probes located at the rear, along the specimen midline. By combining the pressure data with the underwater images, different cavitation/ventilation modalities are observed when varying the impact velocity, with the transition from one modality to the other occurring within velocity variations of few m/s (Table 1). The time histories of the pressures recorded at different impact velocities by the four probes located along the midline in the rear portion of the specimen are shown in figure 3. It is worth noticing that all the data presented in the following are intentionally unfiltered. The data provide the relative pressure, the ambient pressure being used as reference value. The water temperature during the tests was between 18∘C and 21∘C. At such temperatures the absolute vapor pressure is in the range 2.0 to 2.7 kPa, which correspond to relative values of -99.30 kPa and -98.60 kPa, respectively.
In all cases, at the initial contact, probe P17 exhibits a sharp rise up and a pressure peak. A sharp rise is also found on P13 and P9, although the peak intensities are lower and are delayed with respect to P17 due to the time needed for the spray root to propagate. Next, the probes display a gentle pressure reduction and negative pressures are observed as well.
The occurrence of a pressure peak at P17 and P13 followed by the negative pressure can be explained with the asymmetry of the body shape and of the relative velocity. As shown in Ref. Semenov and Iafrati, 2006, in the case of asymmetric impact the pressure peak on the side with reduced deadrise angle is much higher than that on the other side. At the beginning of the entry process, the two peaks are close to each other and the pressure level in between is also high. However, as the body penetrates the two peaks move away and the pressure at the apex drops substantially. The pressure at the apex diminishes even more due to the large difference in the intensity of the pressure peaks which leads to a cross flow about the apex that generate negative pressures Riccardi and Iafrati (2004) and, depending on the conditions, it may eventually lead to cavitation or ventilation (Judge et al., 2004). Another interpretation of the phenomenon based on the flat plate solution is provided in the next section.
At m/s (figure 3), it is seen that indeed the pressure at all four probes turns negative, with P17, being very close to the sharp change in the shape, reaching the lowest values. However, the pressure measured by all probes is always much above the vapor pressure.
When increasing the test speed to 26.8 m/s, there is a corresponding growth of the pressure peaks at P9, P13 and P17 as well as a reduction in the negative values attained in the later stage. Shortly before the end of the impact phase, the pressure at P17 exhibits sudden drops to the vapor pressure indicating that cavitation is about to start (figure 3). By looking at the corresponding underwater images (figure 4) there is no clear evidence of cavitation and very likely cavitation is only local and it is associated with the interaction of the flow with the pressure probes and with their installation on the specimen, as explained in Ref. Iafrati, 2015b.
The occurrence of cavitation becomes evident at m/s, when P17, P13 and P9 exhibit sharp pressure drops remaining for long time intervals at the vapor pressure value (figure 3). The vapor cavity is indeed visible from the underwater images already at the middle of the impact phase (figure 4). However, differently from what happens at higher speeds, the cavity does not propagate much beyond P9 (figure 4). For such reason this is considered as an Inception Cavitation case.
It is worth noticing that whereas before the sharp drops the pressure signals are characterized by large and high-frequency fluctuations, which disappear once the vapor pressure is reached. The pressure fluctuations are a consequence of the irregularities in the relative motion between the body and the water surface caused by the structural vibrations of the trolley and of the guide together with the added mass of the water. Once the cavitation starts, the pressure inside the cavitation bubble is constant and the irregularities in the vertical motion are absorbed by the deformations of the cavity, whereas the added mass of the vapor is negligible.
More quantitatively, the phenomenon is highlighted by the continuous wavelet transform of the pressure signals, as that provided in figure 5. Whereas the signals are rather broad banded in the early stage and in the pressure drop, there are no frequencies appearing in the cavitation phase.
When increasing the horizontal velocity at the impact to 34.5 m/s, the cavity propagates till the backward step of the specimen, as it is seen from both the pressure measurements (figure 3) and the underwater images in figures 4. Figure 4 also displays the initial formation of the ventilated cavity but it remains confined to a limited portion at the rear of the specimen.
A further increase of the horizontal velocity of about one meter per second is already enough for the ventilation effects to propagate forward up to P13 at least. The pressure in the bubble rises quite gently in this case (figure 3). In such specific test the ambient pressure is reached shortly after the end of the impact phase. All probes, but for P17, display a positive pressure peak and next there is the development of a new cavitating bubble. The underwater picture 4, being taken at the end of the impact phase, shows the ventilated cavity only and not the formation of the new cavitation bubble.
The transition to ventilation becomes stable when increasing the horizontal velocity above 37.2 m/s. As shown in figures 3, the ventilated cavity propagates till P17. However, sensor P17 is just behind the lowest point of the geometry and in the sharply curved region so that, also due to the intense cross flow, never gets to the fully ventilated conditions.
By comparing the time histories of the pressures for the different cases it is seen that the time duration of the cavitating phase shrinks with increasing the horizontal velocity and the development of the ventilation is anticipated to less than half of impact phase. Whereas the delay of the pressure drops of the different probes indicates that the cavitating bubble needs some time to reach the different probes, when the bubble reaches the probe the pressure drops suddenly. Differently from that, when the ventilation occurs the pressure rises at a given level at all probes at the same time, and it is instead the growth rate of the pressure that increases with increasing the test speed. This is because when the cavitating bubble gets in contact with the air at the rear of the specimen, the higher pressure is felt everywhere within the bubble. However, the pressure in the bubble does not jump instantaneously to the ambient value but it grows as the ventilation effects propagate forward into the bubble. The propagation of ventilation effects is highlighted by the sequence of underwater images provided in figure 8 which correspond to the boxes in the time histories of the pressure shown in figure 3.
The propagation of the cavitation and ventilation bubbles can be further inferred from figure 6 where the pressure contours at two different times during the impact phase of the test at 40.2 m/s are drawn over the corresponding underwater images. As the probes are located only on one side of the specimen, the symmetry of the pressure is exploited. In spite of the limited number of probes, the pressure contours are well overlapped to the cavitation bubble. Somewhat more noisy are the contours in the ventilation phase, but it is still possible to recognize the propagation of the front.
Whereas the analysis of the pressures is essential to understand the hydrodynamic phenomena taking place beneath the specimen, their practical consequences are more understandable from the time histories of the normal forces, and particularly by the comparison of the forces measured at the rear and at the front, provided in figure 7. The data clearly show that until ventilation appears around 35 m/s, the force at the rear is more and more negative as the horizontal velocity is increased, although the total force keeps increasing of course. However, as soon as the ventilation enters into play a sudden increase in the force at the rear is observed, which is concurrent with the pressure growth. This is made evident at the highest test speed where it can be noticed that the marks placed along the pressure rise (figure 3) perfectly correlate with the sharp growth of the force measured at the rear (figure 7).
Results in figure 7 indicate that the ventilation also leads to an increase of the total loading, which is to say that because of the ventilation, the change in the pressure distribution at the rear of the specimen does not only affect the position of the center of loads but also the total force on the specimen. The sudden changes in the pressure distribution and their consequences in terms of the center of loads discussed above are remarkably different from what found for the flat plate in Ref. Iafrati, 2016b, where a much smoother behavior of the loads and a monotonic motion of the center of loads, arriving up to about 80 of the plate length, was found.
The sudden changes in the hydrodynamics and the subsequent effects on the loading distribution which are a consequence of the fuselage curvature and of the high horizontal speed, are expected to have important effects on the aircraft dynamics and have to be correctly reproduced in the ditching analyses.
IV Discussion
The above results show what is actually happening and how the phenomena change when increasing the horizontal velocity but they do not explain the reasons. Without additional considerations, the message could be misleading as it is not the horizontal velocity itself that triggers the phenomena but it is its combination with the body shape and with the longitudinal curvature in particular. Unfortunately, the problem cannot be easily represented by a simple model and a full three-dimensional flow solver capable of describing the nonlinear free surface dynamics would be necessary. Such high fidelity models are not available at this time, which is one of the motivations for the present study, and thus some attempts to explain the phenomenon can only be done based on approximate representations.
The problem can be examined by analyzing what happens in two-dimensional planes, and this can be done either in the cross plane or in the longitudinal plane. The former is often exploited in the so called 2D+t assumption, like that used for instance in Ref. Tassin et al., 2013; Battistin and Iafrati, 2003, within the potential flow approximation. Let us consider the water particles lying on an earth-fixed cross plane when the body first touches the water surface, and let us assume that the body has a double curvature, like that considered in Ref. McBride and Fisher, 1953, and has a positive pitch angle. When the body moves forward, the liquid particles in the cross plane are pushed downward by vertical velocity component of the body , plus the vertical velocity component , being the local slope of the bottom line in the longitudinal plane. Owing to the longitudinal profile, the local slope is positive the in the fore part and turns negative at the rear. Therefore, there is a progressive transition from a water entry to a water exit phaseTassin et al. (2013). Because of the upward motion of the cross section of the body, and due to the inertia of the fluid moving downward, a negative pressure at the rear occurs, which is a combined effect of the upward velocity and of the upward acceleration. The latter depends on the product of the curvature of the bottom profile by the square of the horizontal velocity.
Although the above representation is rather intuitive and it is indeed the most used, it is unable to account for the flow taking place in the longitudinal direction as a consequence of the pressure differences induced by the asymmetry of the flow Semenov and Iafrati (2006). As anticipated before, the shape considered in the present study is characterized by a single curvature portion in the fore part, followed by a double curvature zone at the rear. In the longitudinal plane, the fore part can be approximated by a flat plate, 6 degrees pitch, impacting the water with a velocity ratio . The self-similar solution to such problem is derived in Ref. Iafrati, 2016b by using a fully nonlinear potential flow model and compared to the experimental measurements. It is shown that the self-similar solution over predicts the propagation velocity of the spray root along the plate and, consequently, the intensity of the pressure peak but the pressure profile along the plate is well captured by the model provided a suitable scaling is adopted.
Bearing the above considerations in mind, the free-surface shape provided by the self-similar solution for the flat plate is scaled so that trailing edge of the plate is located at the end of the single curvature portion, i.e. at , whereas the spray root is at the leading edge of the specimen at the end of the impact phase (see figure 9). The self-similar solution is then further scaled by the corresponding time fractions and drawn beneath the longitudinal profile of the specimen at different times for the test at m/s (figure 9). The self-similar solution is drawn in terms of both free-surface shape and pressure distribution. In the figures, the pressure is not in scale and it is drawn to give an estimate of the point where the pressure peak is located.
In figure 9, which is at s from the initial contact, it is shown that the free surface shed by the trailing edge is inside the fuselage profile. This implies that in the impact of the fuselage specimen, the free surface hits the body surface and thus positive pressures should be expected, as it happens indeed looking at figure 3. The rear bump of the free surface profile is about 90 mm behind the first contact point and that explains why the pressure at P13 and P9 is relatively high, whereas the pressure at P17 has already drop, although it is still positive.
Figure 9, which is at s, shows that just behind the lowest point of the fuselage profile, the free surface has already detached from the body and thus negative pressures, and even cavitation may occur. This is actually confirmed by the time history of the pressure measured at P17 which drops to the vapor pressure exactly at that time. However, the free surface profile still intersect the body contour at the rear, which explains why P4 and P9 still have higher pressures. At s, figure 9 indicates that the free surface bump is at the trailing edge of the specimen and all probes, but for P4, are in cavitating conditions. Once the rear bump of the free surface profile leaves the body, the cavity gets in contact with the atmospheric pressure and the ventilation start. Of course similar considerations also hold for lower impact velocities but since the pressure scale with the square of the velocity, only negative pressures, much above the vapor pressure value, are found.
From the self-similar solution it is seen that the free surface leaves the trailing edge with a tangential velocity which is about 1/11 of the horizontal velocity. If the fluid particles have to follow the curvature of the body, there should be a normal pressure gradient toward the body equal to the square of the tangential velocity divided by the local curvature. Hence, this is an additional effect that contributes to lower the pressure together with the upward velocity and accelerations observed in the cross plane. It is the combination of the different effects in the cross and in the tangential plane that makes full three-dimensional fully nonlinear flow solvers essential for a precise picture of the problem.
V Conclusions
The hydrodynamics taking place beneath the aircraft fuselage during the emergency landing on water has been experimentally investigated. To avoid scaling issues, realistic shapes and impact velocities have been considered. The study has revealed that cavitation and ventilation conditions occur when the horizontal velocity is above a threshold limit which depends on the body shape. Different cavitation and ventilation modalities have been observed, with the transition from one to another taking place within small velocity variations.
The analysis of pressure and forces acting on the specimen has shown that the occurrence of cavitation and ventilation significantly affects the distribution of the loads and thus the aircraft dynamics. Although the specific results presented depends on the shape and on the test conditions adopted, e.g. the fixed attitude of the specimen, the outcomes suggest that an accurate modelling of the hydrodynamics, either in the experiments or in the numerical simulation, is essential for a correct prediction of the aircraft behavior at ditching.
Acknowledgements.
This project has received funding from the European Union’s Horizon 2020 Research and Innovation Programme under grant agreement No 724139 (H2020-SARAH: increased SAfety & Robust certification for ditching of Aircrafts & Helicopters)
The reference list from the paper itself. Each links out to its DOI / PubMed record.
- 1Siemann and Langrand (2017) M. Siemann and B. Langrand, Coupled fluid-structure computational methods for aircraft ditching simulations: Comparison of ale-fe and sph-fe approaches, Comput Struct 188 , 95 (2017).
- 2Siemann et al. (2018) M. Siemann, D. Schwinn, J. Scherer, and D. Kohlgrüber, Advances in numerical ditching simulation of flexible aircraft models, Int J Crashworthines 23 , 236 (2018).
- 3Qu et al. (2015) Q. Qu, M. Hu, H. Guo, P. Liu, and R. Agarwal, Study of ditching characteristics of transport aircraft by global moving mesh method, J Aircraft 52 , 1550 (2015).
- 4Bisagni and Pigazzini (2018) C. Bisagni and M. Pigazzini, Modelling strategies for numerical simulation of aircraft ditching, Int J Crashworthines 23 , 377 (2018).
- 5Landau and Lifshitz (1959) L. D. Landau and E. M. Lifshitz, Fluid mechanics , Pergamon, New York (1959).
- 6Moghisi and Squire (1981) M. Moghisi and P. Squire, An experimental investigation of the initial force of impact on a sphere striking a liquid surface, J Fluid Mech 108 , 133 (1981).
- 7Smith et al. (1957) A. G. Smith, C. H. E. Warren, and D. F. Wright, Reports and Memoranda 2917, Aeronautical Research Council, Ministry of Supply (1957).
- 8Zhang et al. (2012) T. Zhang, S. Li, and H. Dai, The suction force effect analysis of large civil aircraft ditching, Science China - Technological Sciences 55 , 2789 (2012).