Data-taking strategy for the precise measurement of the $W$ boson mass with a threshold scan at circular electron positron colliders
P. X. Shen, P. Azzurri, C. X. Yu, M. Boonekamp, C. M. Kuo, P. Z. Lai,, B. Li, G. Li, H. N. Li, Z. J. Liang, B. Liu, J. M. Qian, L. S. Shi

TL;DR
This paper proposes an optimized data-taking strategy for circular electron-positron colliders to measure the $W$ boson mass and width with high precision using a threshold scan, considering systematic uncertainties.
Contribution
It introduces a realistic data-taking scheme involving three energy points to maximize measurement precision of the $W$ boson properties at future colliders.
Findings
Achieves 1.0 MeV precision for $W$ mass
Achieves 3.4 MeV precision for $W$ width
Recommends data collection at three energy points
Abstract
Circular electron positron colliders, such as the CEPC and FCC-ee, have been proposed to measure Higgs boson properties precisely, test the Standard Model, search for physics beyond the Standard Model, and so on. One of the important goals of these colliders is to measure the boson mass with great precision by taking data around the -pair production threshold. In this paper, the data-taking scheme is investigated to maximize the achievable precisions of the boson mass and width with a threshold scan, when various systematic uncertainties are taken into account. The study shows that an optimal and realistic data-taking scheme is to collect data at three center-of-mass energies and that precisions of 1.0 MeV and 3.4 MeV can be achieved for the mass and width of the boson, respectively, with a total integrated luminosity of ~\mbox{ab} and several…
Click any figure to enlarge with its caption.
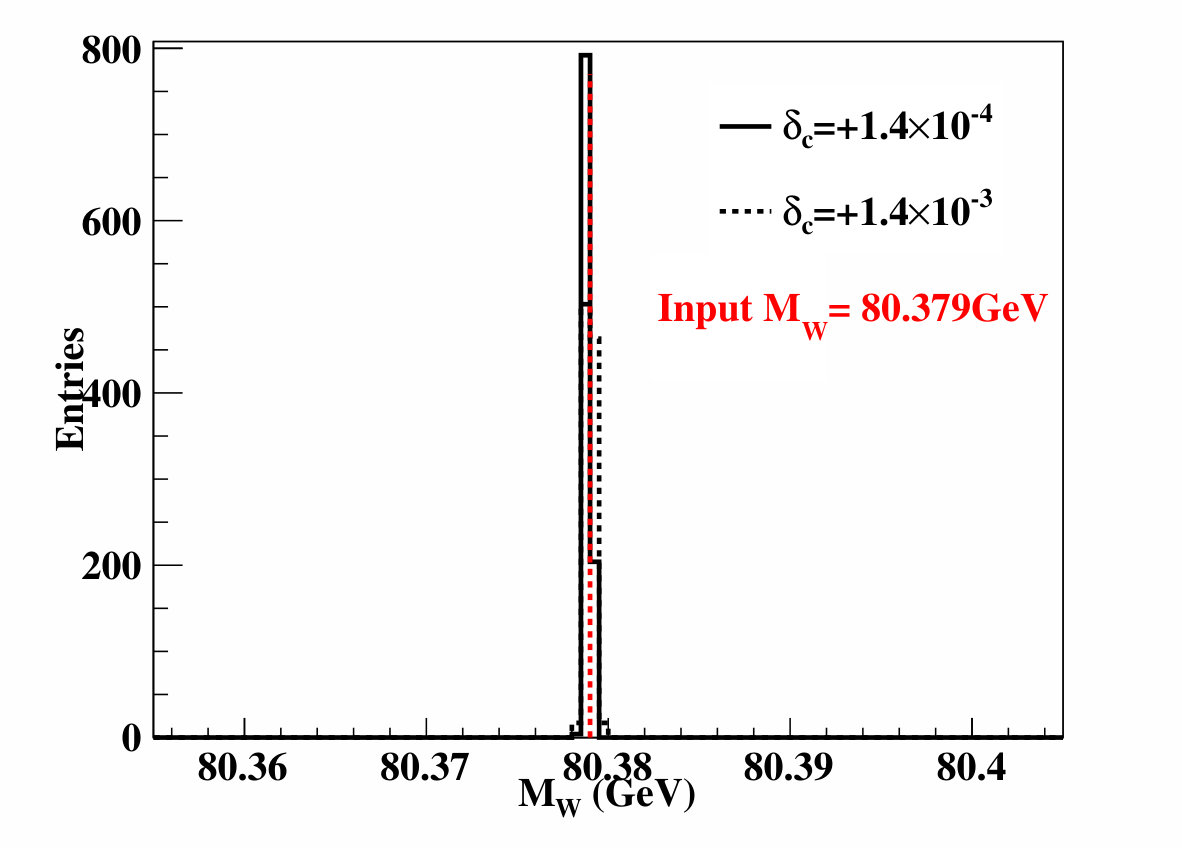 Figure 1
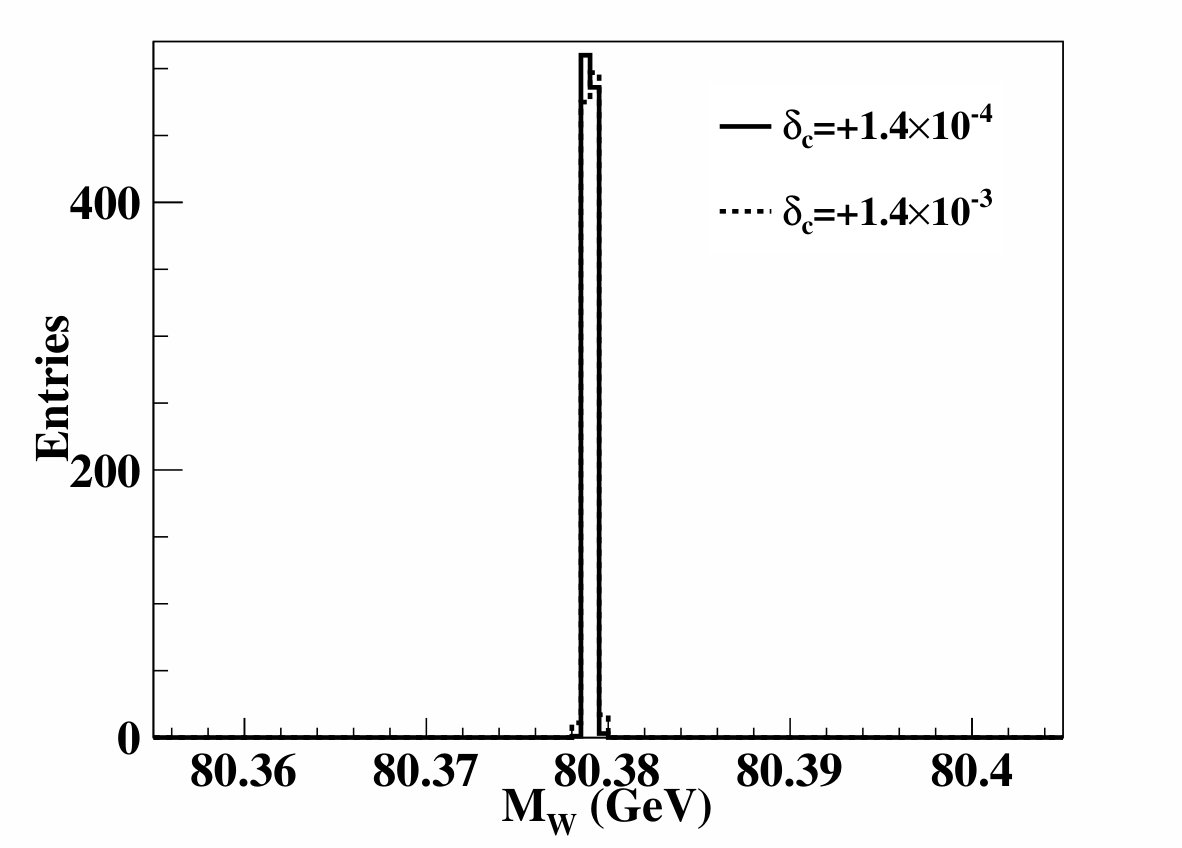 Figure 2
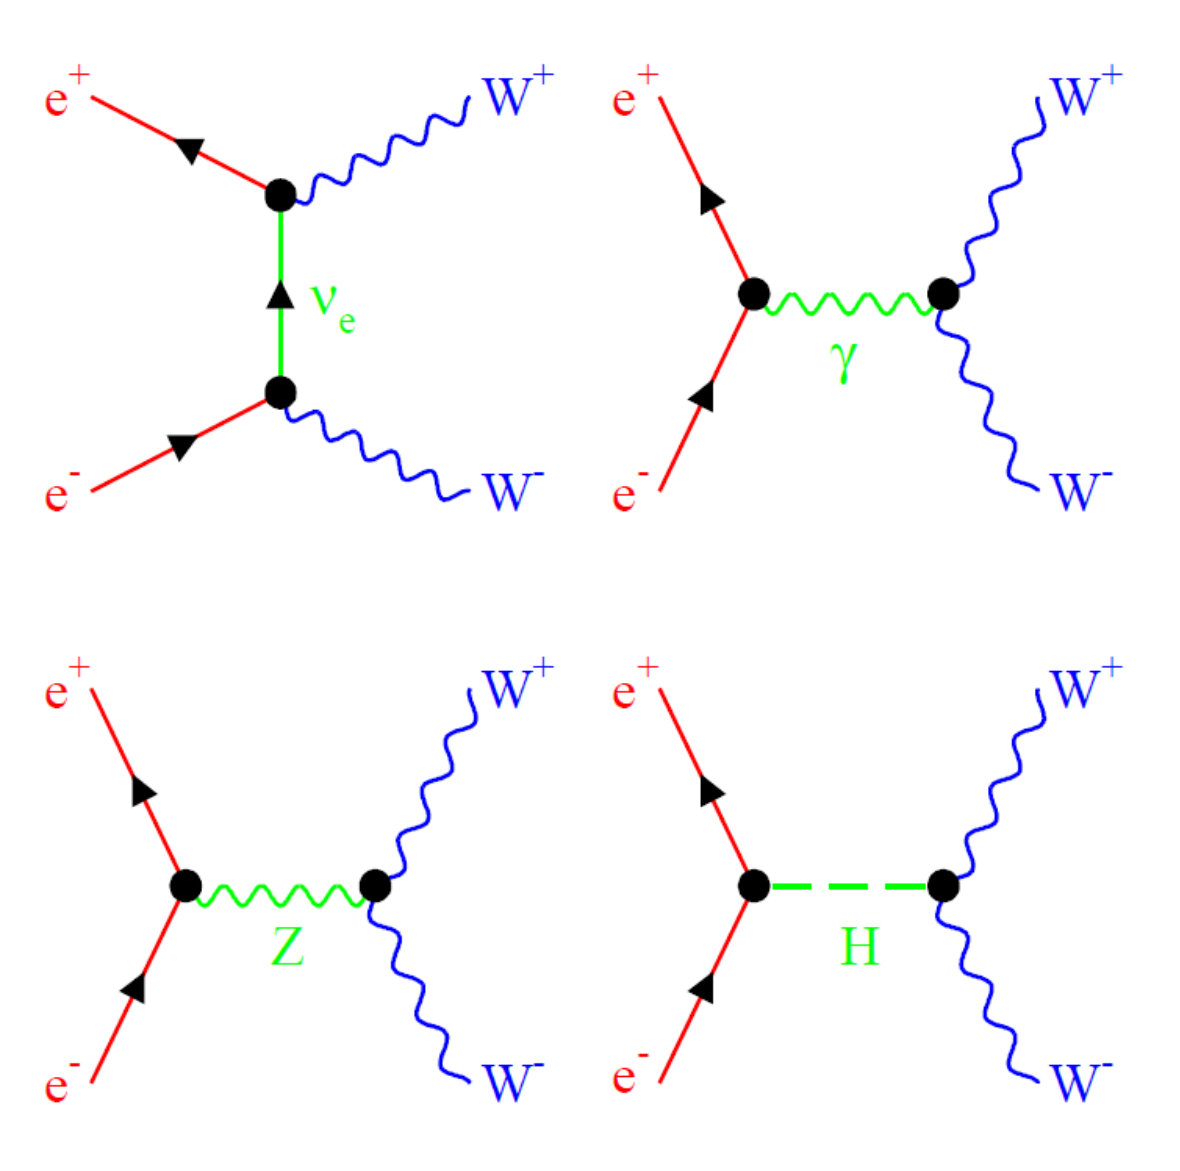 Figure 3
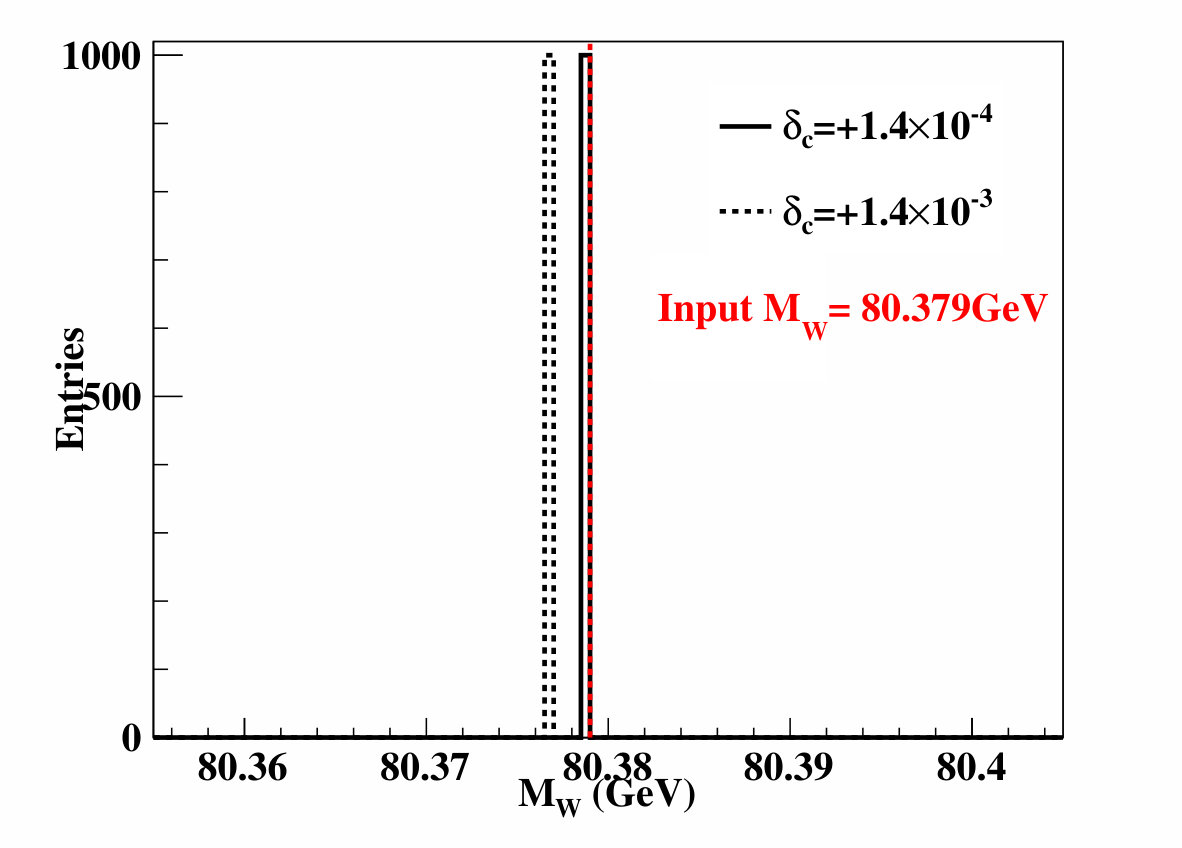 Figure 4
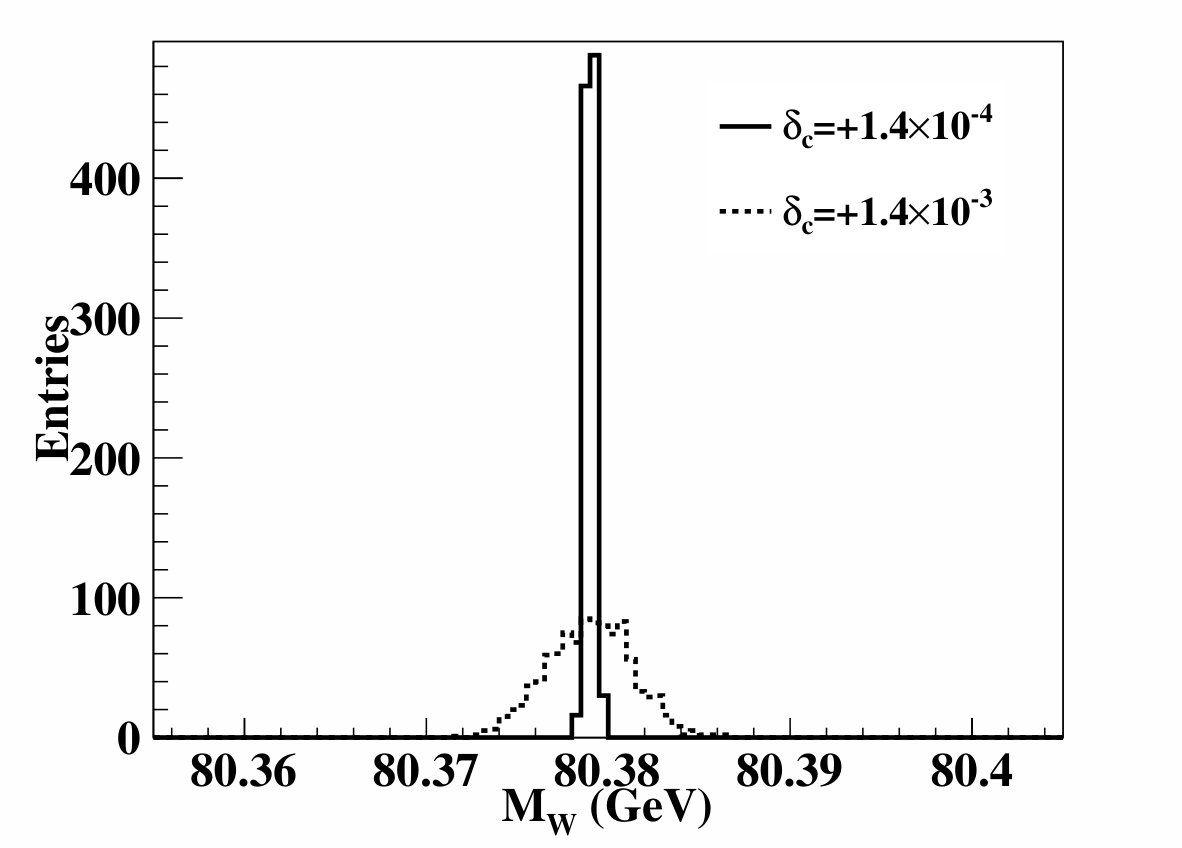 Figure 5
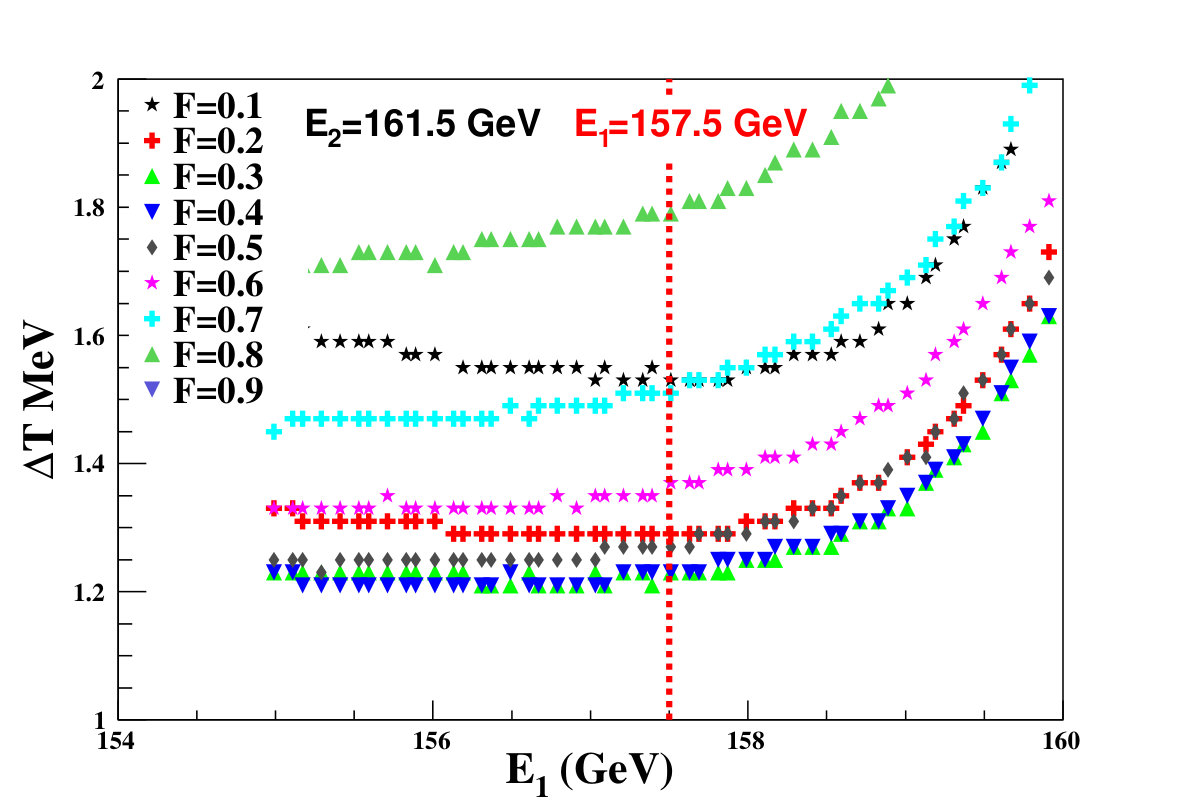 Figure 6
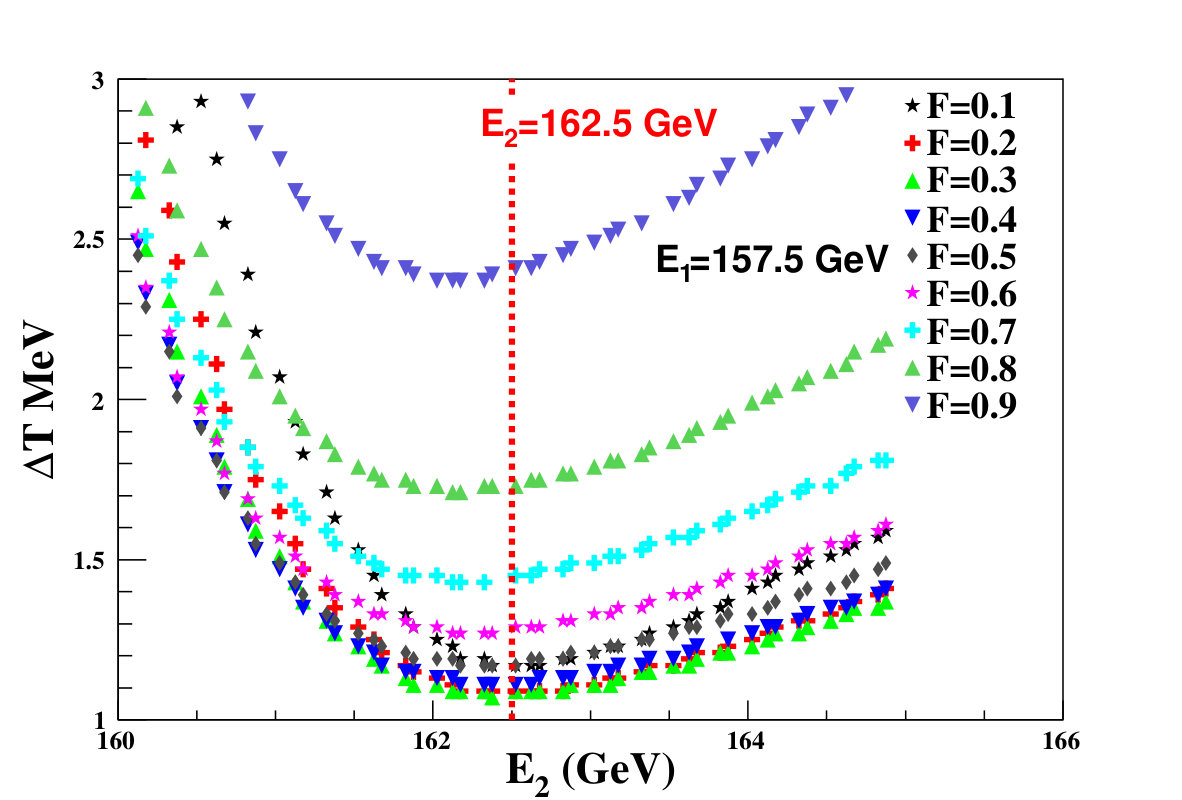 Figure 7
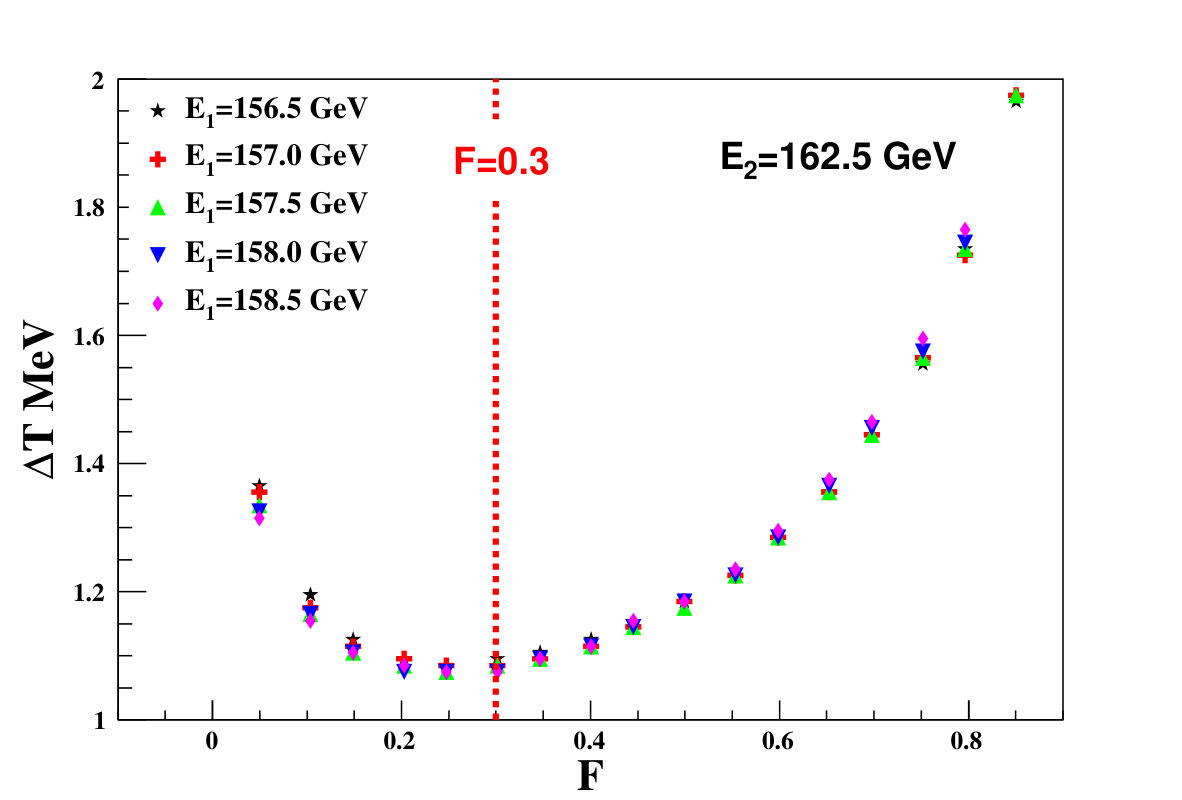 Figure 8
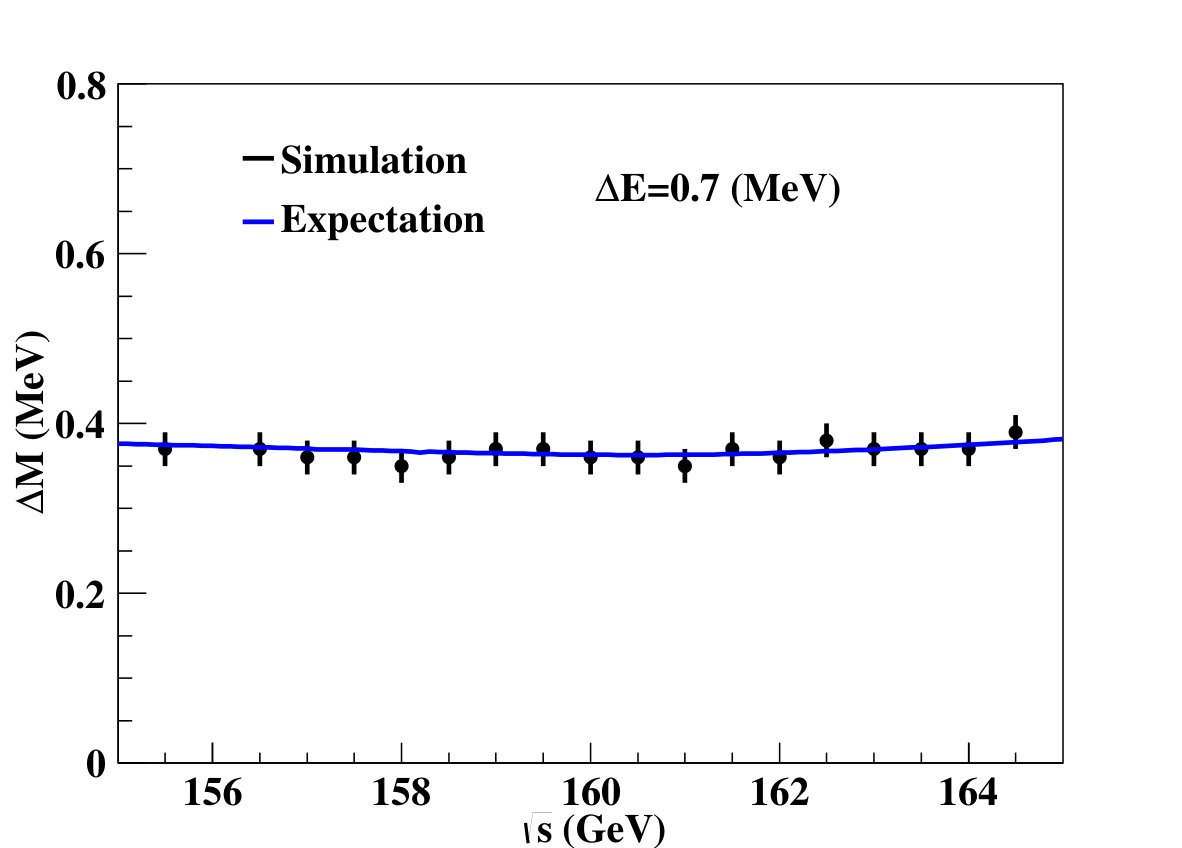 Figure 9
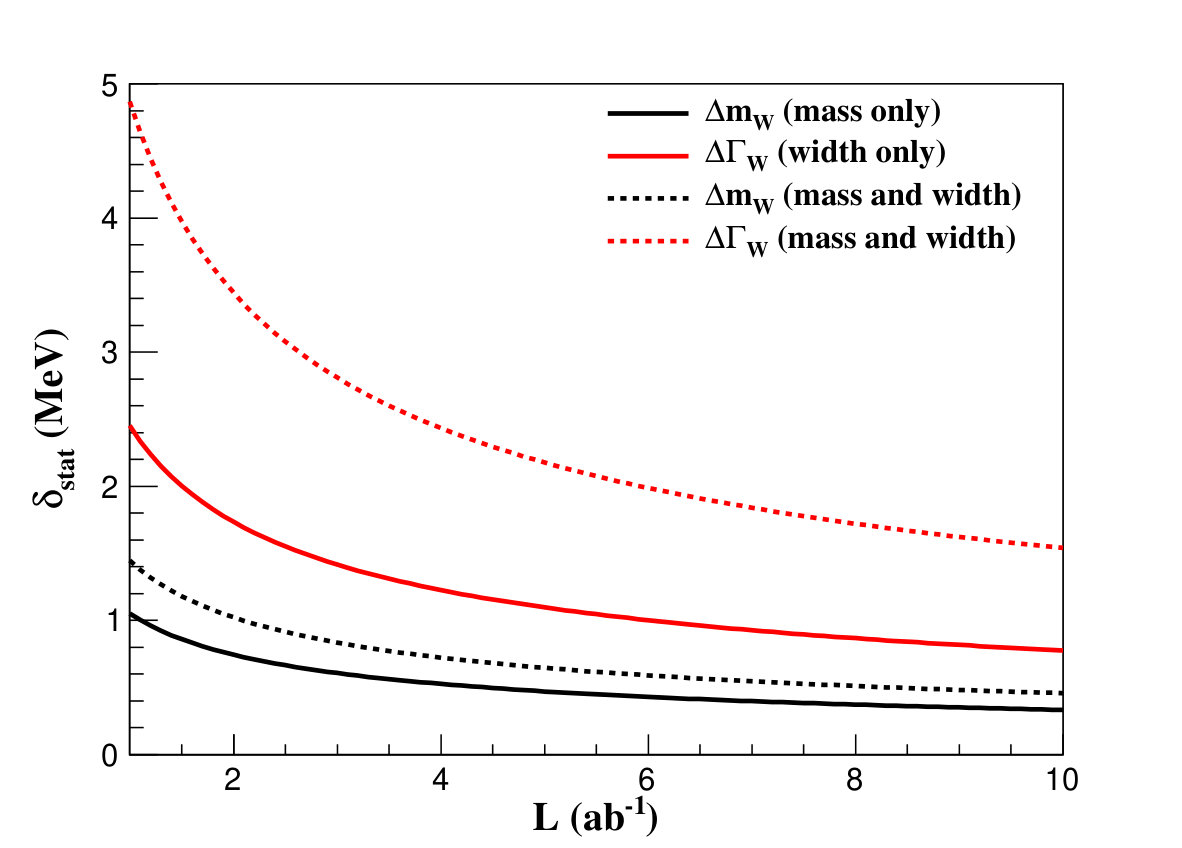 Figure 10
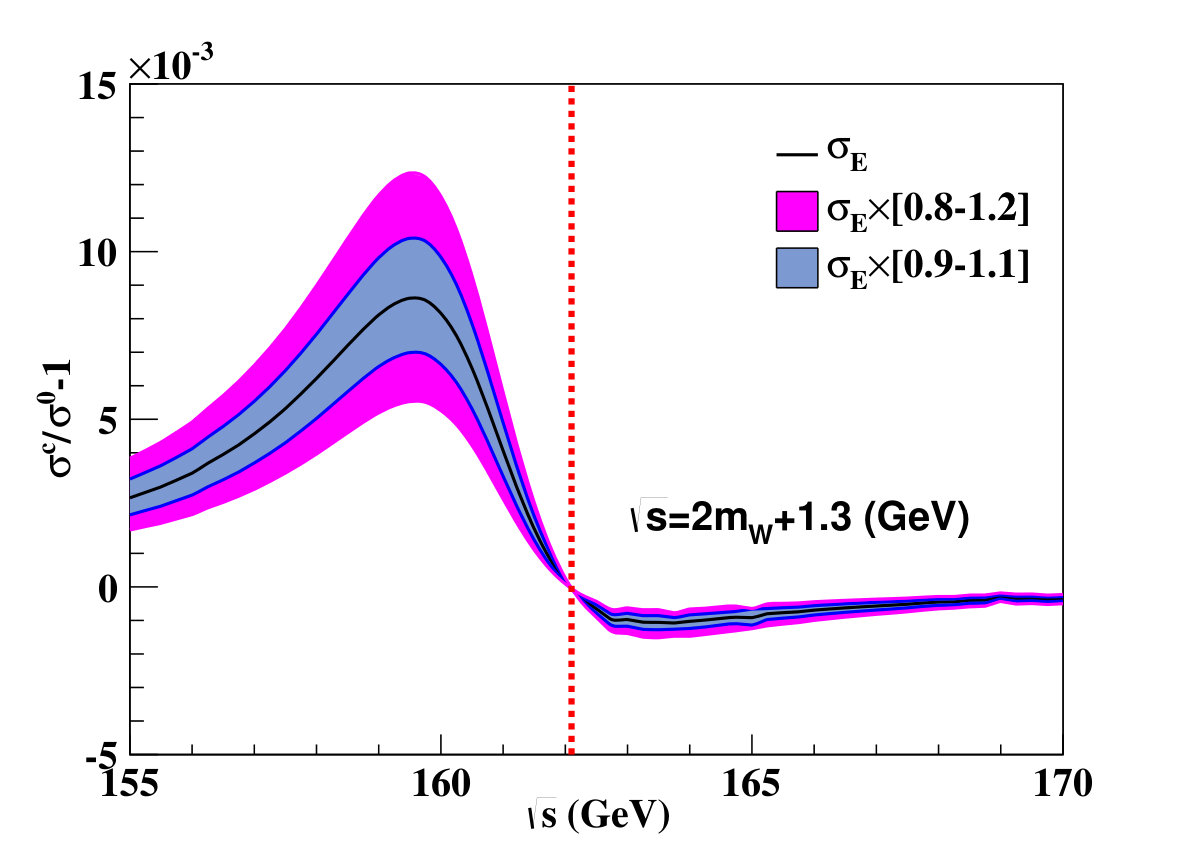 Figure 11
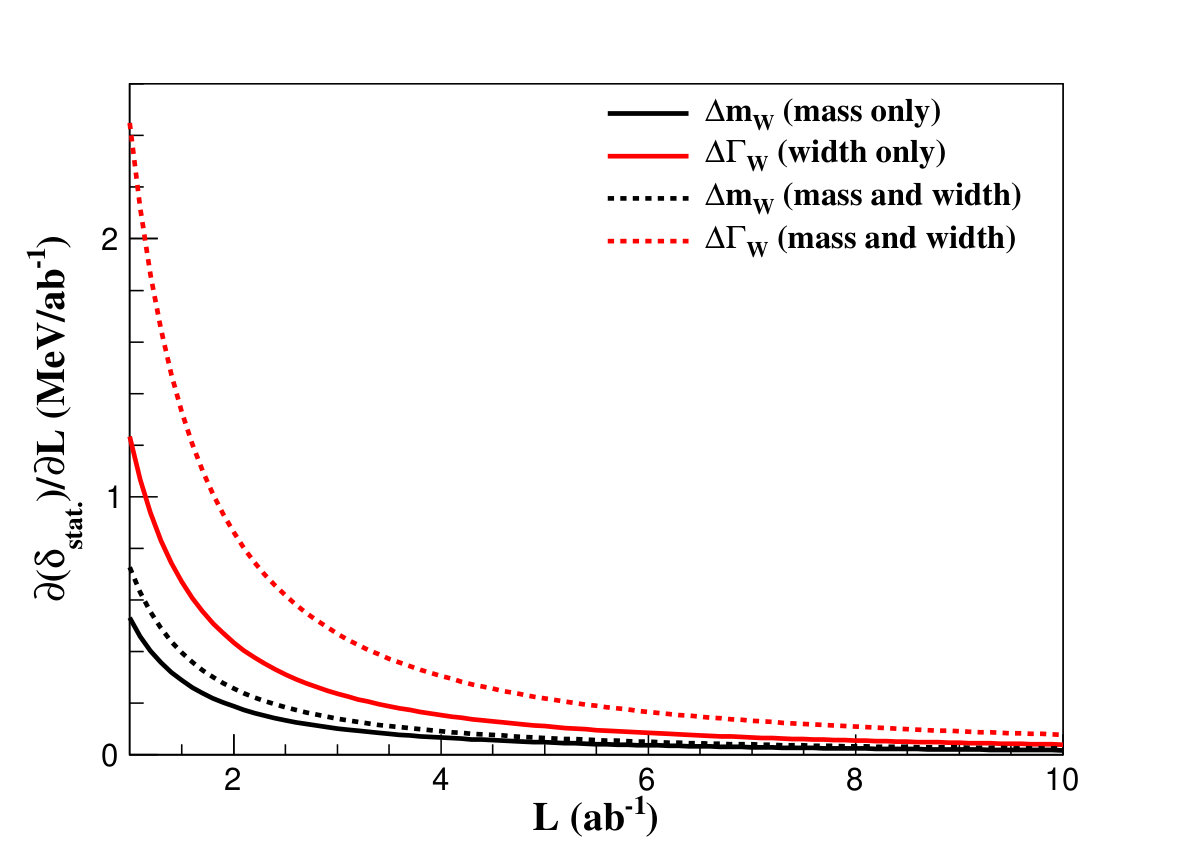 Figure 12
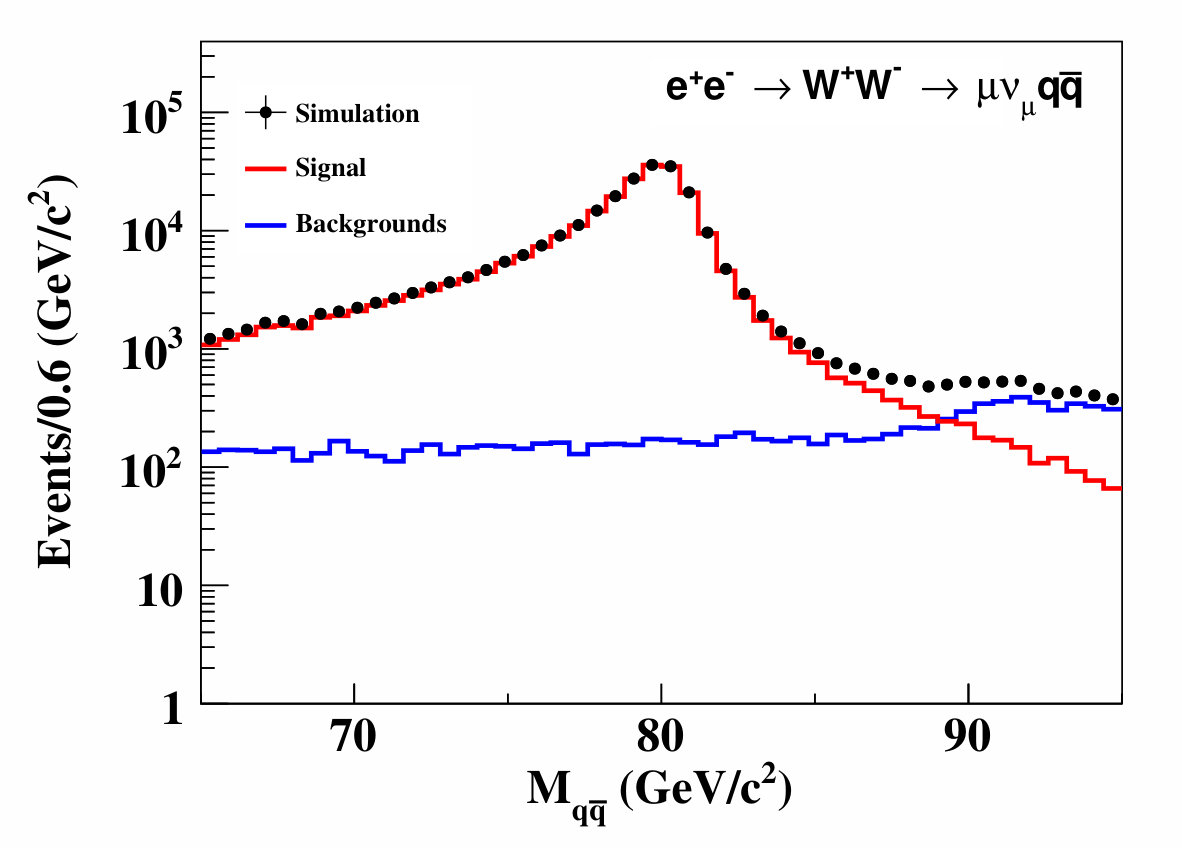 Figure 13
 Figure 14
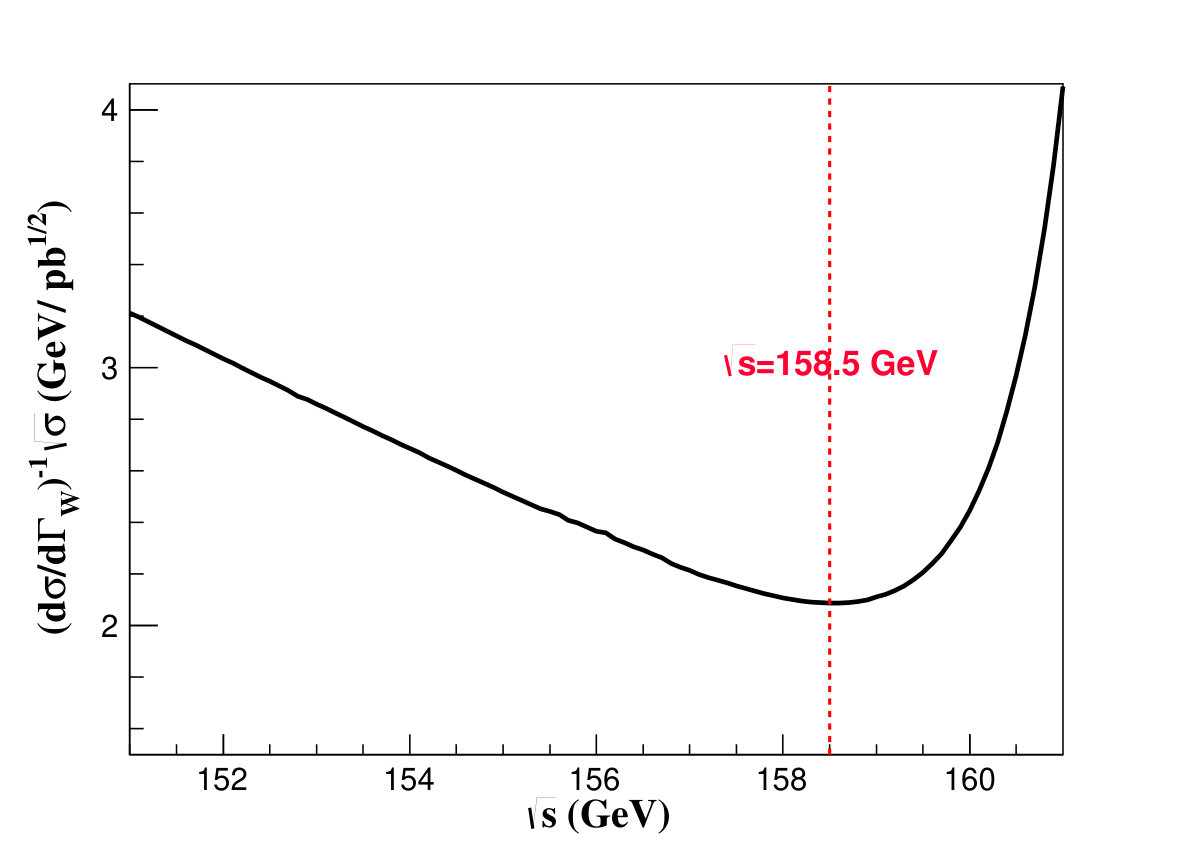 Figure 15
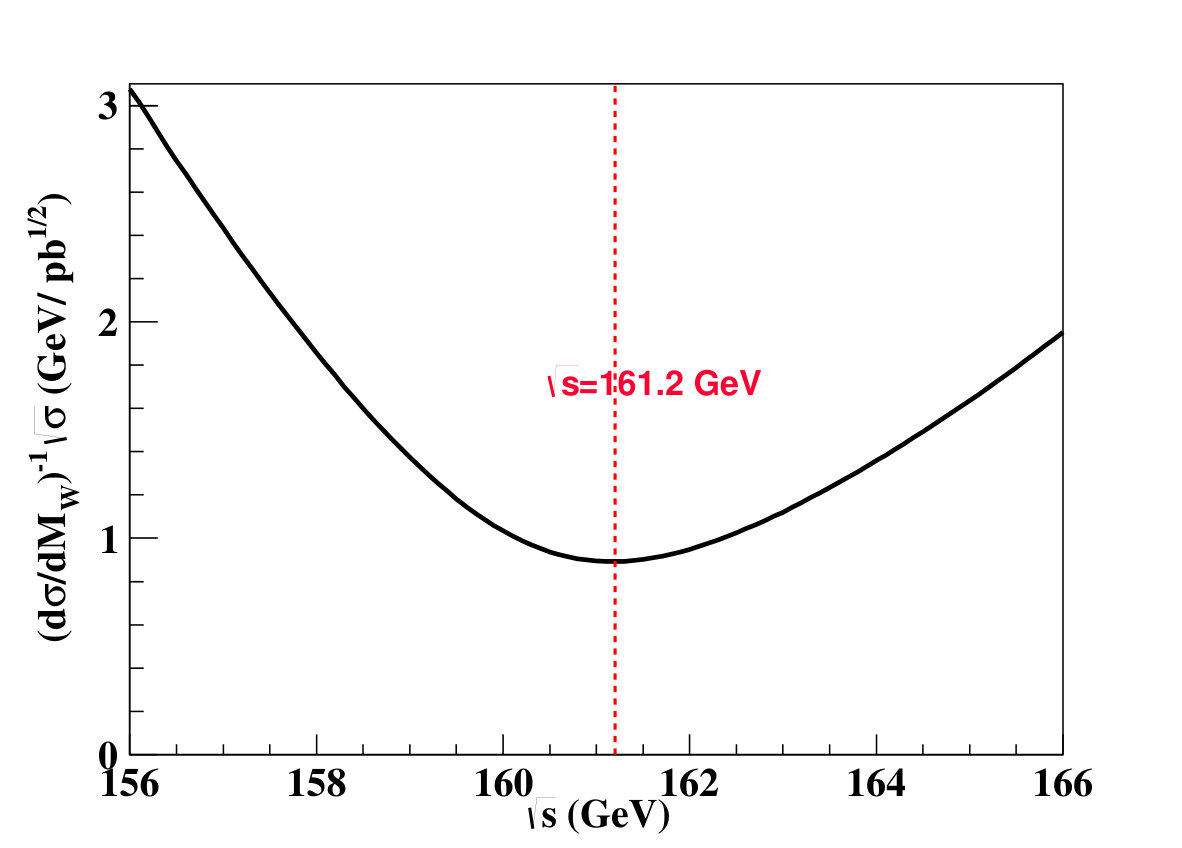 Figure 16
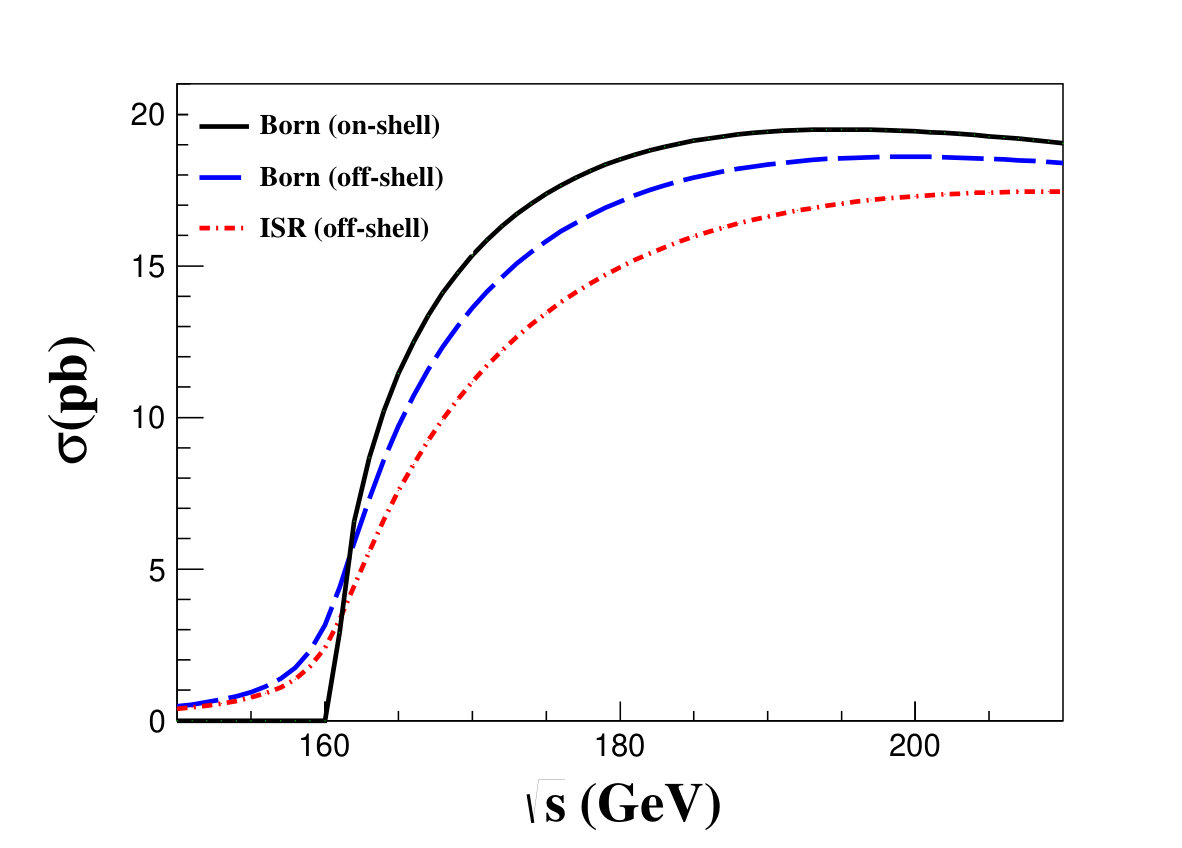 Figure 17
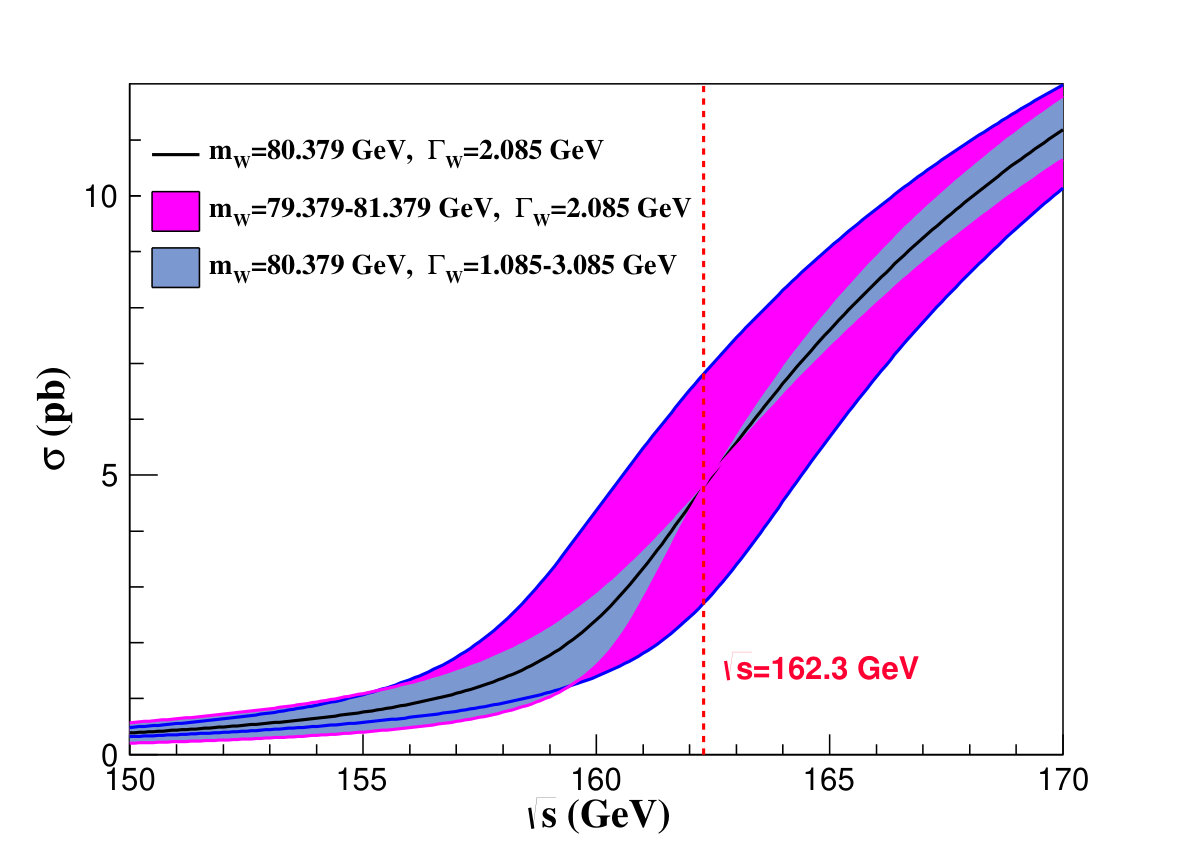 Figure 18
| Configurations | This study | FCC-ee work |
|---|---|---|
| (GeV) | 80.379 0.012 | |
| (GeV) | 2.085 0.042 | |
| () | 3.2 | 15 |
| (%) | 0.1 | 0.09 |
| 0.8 | 0.75 | |
| (pb) | 0.3 | 0.3 |
| (%) | 10 | 5 |
| (MeV) | 0.5 | 0.24 |
| Energy/source | (stat.) | Total | ||||||
|---|---|---|---|---|---|---|---|---|
| (MeV) | 161.2 (GeV) | 0.59 | 0.36 | 0.20 | 7.49 | 0.17 | 0.24 | 7.53 |
| 162.3 (GeV) | 0.65 | 0.37 | - | - | 0.17 | 0.34 | 0.84 | |
| Data-taking scheme | mass or width | (MeV) | (MeV) | Total (MeV) | |||
|---|---|---|---|---|---|---|---|
| One point | 0.65 | 0.37 | - | 0.17 | 0.34 | 0.84 | |
| Two points | 0.80 | 0.38 | - | 0.21 | 0.33 | 0.97 | |
| 2.92 | 0.54 | 0.56 | 1.38 | 0.20 | 3.32 | ||
| Three points | 0.81 | 0.30 | - | 0.23 | 0.29 | 0.98 | |
| 2.93 | 0.52 | 0.55 | 1.38 | 0.20 | 3.37 | ||
| Data-taking scheme | mass or width (MeV) | Luminosity (ab-1) | FCC-ee | |||||
|---|---|---|---|---|---|---|---|---|
| 1 | 3 | 6 | 9 | 12 | 15 | 15 | ||
| One point | 1.15 | 0.67 | 0.47 | 0.39 | 0.33 | 0.30 | 0.25 | |
| Two points | 1.42 | 0.82 | 0.58 | 0.47 | 0.41 | 0.37 | 0.41 | |
| 5.21 | 3.02 | 2.13 | 1.74 | 1.51 | 1.35 | 1.10 | ||
| Three points | 1.43 | 0.82 | 0.58 | 0.48 | 0.41 | 0.37 | - | |
| 5.24 | 3.02 | 2.14 | 1.75 | 1.51 | 1.35 | - | ||
Peer Reviews
No public reviews on file for this paper yet. If you reviewed it on a platform where reviews are public (OpenReview, ICLR, NeurIPS, ICML), you can paste yours below so the community can read it here.
Videos
No videos yet. Explain this paper in a talk, walkthrough, or lecture? Add one.
Taxonomy
TopicsParticle physics theoretical and experimental studies · Particle Detector Development and Performance · Radiation Therapy and Dosimetry
††thanks: Electronic address: [email protected]††thanks: Electronic address: [email protected]††thanks: Electronic address: [email protected]
Data-taking strategy for the precise measurement of the boson mass with threshold scan at circular electron positron colliders
P. X. Shen
Nankai University, Tianjin 300071, People’s Republic of China
P. Azzurri
INFN, sezione di Pisa, Italy
C. X. Yu
Nankai University, Tianjin 300071, People’s Republic of China
M. Boonekamp
IRFU, CEA, Universite Paris-Saclay, Paris
C. M. Kuo
Department of Physics and Center for High Energy and High Field Physics, National Central University, Tao yuan
P. Z. Lai
Department of Physics and Center for High Energy and High Field Physics, National Central University, Tao yuan
B. Li
Department of Physics, Yantai University, Yantai, Shandong
G. Li
Institute of High Energy Physics, Beijing 100049, People’s Republic of China
H. N. Li
South China Normal University, Guangzhou, Guangdong
Z. J. Liang
Institute of High Energy Physics, Beijing 100049, People’s Republic of China
B. Liu
Institute of High Energy Physics, Beijing 100049, People’s Republic of China
J. M. Qian
Department of Physics, University of Michigan, Ann Arbor, MI
L. S. Shi
School of Physics, Sun Yat-sen University, Guangzhou, Guangdong
Abstract
Circular electron positron colliders, such as the CEPC and FCC-ee, have been proposed to measure Higgs boson properties precisely, test the Standard Model, search for physics beyond the Standard Model, and so on. One of the important goals of these colliders is to measure the boson mass with great precision by taking data around the -pair production threshold. In this paper, the data-taking scheme is investigated to maximize the achievable precisions of the boson mass and width with a threshold scan, when various systematic uncertainties are taken into account. The study shows that an optimal and realistic data-taking scheme is to collect data at three center-of-mass energies and that precisions of 1.0 MeV and 3.4 MeV can be achieved for the mass and width of the boson, respectively, with a total integrated luminosity of ab*-1* and several assumptions of the systematic uncertainty sources.
I Introduction
In the Standard Model (SM) of particle physics, the electroweak (EW) interaction is mediated by the boson, the boson, and the photon, in a gauge theory based on the symmetry Gauge_1 ; Gauge_2 ; Gauge_3 . The so called symmetry-breaking mechanism is based on the interaction of the gauge bosons with a scalar doublet field and predicts the existence of a new physical state known as the Higgs boson Higgs_1 ; Higgs_2 ; Higgs_3 . The and bosons were discovered by the UA1 and UA2 Collaborations in 1983 WZ_boson_1 ; WZ_boson_2 ; WZ_boson_3 ; WZ_boson_4 and the Higgs boson was discovered by the ATLAS and CMS Collaborations in 2012 Higgs_E_1 ; Higgs_E_2 .
In the EW theory, the boson mass, , can be expressed as a function of the boson mass, ; the fine-structure constant, ; the Fermi constant, ; the top-quark mass, ; and the Higgs boson mass, . With the measured values of these parameters, the SM predicted value of the boson mass has been calculated to be GeV in Ref. WMass_1 and GeV in Ref. WMass_2 . The current Particle Data Group (PDG) world average value of MeV WMass_PDG2018 is dominated by the measurements at LEP2 and Tevatron as well as the latest measurement by the ATLAS Collaboration. In the context of global fits to the SM parameters, constraints on physics beyond the SM are currently limited by the precision of , , and . High precision measurements of these masses are essential to test the overall consistency of the SM and search for new physics beyond the SM.
There are several methods to measure the , as proposed for the LEP2 program WMass_TH_LEP1 ; WMass_TH_LEP2 ; HSCheng ; Stirling_1 ; Stirling_2 . The first one is the direct reconstruction method, with kinematically-constrained or mass reconstructions of , which is the most used in the current experimental results of both hadron and lepton colliders. This method suffers from large systematic uncertainties such as those from hadronization modeling, radiative corrections, lepton energy scale, missing energy, and so on. The second method for measuring is to use the lepton end-point energy. This method encounters the lepton energy calibration problem. The third method is that the boson mass can be determined by comparing the observed -pair production cross section(s) () near their kinematic threshold. Just like the measurement of the lepton mass Tau_1 ; Tau_2 , this method has potential to measure the with high precision when collecting large data sample around the threshold. Based on this strategy, LEP2 experiments have measured the -pair cross section at a single energy point near 161 GeV, with a total integrated luminosity of about 10 for each of the four experiments. The boson mass was determined with a precision of 200 MeV ALEPH ; DELPHI ; L3 ; OPAL , dominated by the statistical uncertainty. With much larger data samples, the precision of the boson mass using this method is expected to be improved significantly. After the discovery of the Higgs boson Higgs_1 ; Higgs_2 ; Higgs_3 , several large electron positron colliders have been proposed, such as the ILC ILC , FCC-ee Fcc_ee ; EPOL17 and CEPC CEPC_1 . One of their important physics goals is the precise measurement of the boson mass. With the expected high integrated luminosity, the threshold scan method is well suited.
For the linear colliders, the -pair threshold scan using polarized beams have been studied by TESLA physics program TESLA , and ILC ILC_WMass . The different polarization states have a advantage to enhance signal cross section and to measure the background in situ. For the circular colliders, the concept of a multi-point scan of the W threshold to extract mass and width of the W boson, and the related data-taking optimization strategy was introduced in the context of FCC-ee studies Fcc_ee_WMass , which reveal that an optimal strategy would include measuring at the -independent energy point GeV, and “off-shell” at - (1–2). Scenarios where systematic uncertainties would be limiting the precision have been examined separately for different sources, and provided the indication that systematic effects that are correlated at different energy points could be partially canceled by measuring at additional energy points where the differential coefficients relevant to the systematic uncertainties are equal FCCW16Azzurri ; FCCW17Azzurri ; FCCW18Azzurri ; EPOL17Janot ; EPOL17Azzurri .
In this paper we follow the same methodology, extending it to the context of the CEPC planned data-taking, and produce comparisons with current FCC-ee projections. Additional care and insight is given to a comprehensive evaluation of the impact and possible limitations of systematic uncertainties on the final measurements.
The threshold scan method is introduced in section II, together with the theoretical tools used to obtain the -pair production cross section. Since the data-taking scheme, including the number of data-taking points, the center-of-mass (CM) energy ( ) of each data point, and the allocation of the integrated luminosity, directly impacts the statistical and systematic uncertainties of the measured and , these uncertainties are studied firstly as described in section III. The investigation of the data-taking scheme and the corresponding expected precision on are presented in section IV.
II Methodology and Theoretical setup
The cross section of the -pair production around its threshold depends sensitively on the mass and width of the boson, and the dependency can be precisely calculated in the EW theory. Therefore by measuring the cross sections at one or more energy points around the -pair threshold, the boson mass and width can be determined by comparing the measured cross sections with the theoretical predictions.
Figure. 1 shows the leading order Feynman diagrams for production at electron positron colliders. Due to the small electron mass, the production of through the Higgs boson is highly suppressed and is therefore neglected in the discussion below. Then the Born-level matrix element of the on-shell production can be written as WW_XS_1 ; WW_XS_2 :
[TABLE]
where is the total amplitude of production, , , and are the amplitudes for the coupling channels with , , and , propagators, respectively; ; ; () and () are the components of the electron (positron) and () spins ( their polarization state), respectively; , is the minimum angular momentum of the system; is the velocity of the boson; and is the Weinberg weak mixing angle.
The production cross section of -pair at colliders, , is calculated using the GENTLE package Gentle with the CC03 mode CC11 . Figure 2 shows the cross section as functions of with and fixed to their world average values: GeV and GeV WMass_PDG2018 . The Born-level cross sections are shown in black for a zero-width boson and in blue for a finite-width boson. The red curve includes the effects of both the finite width and the Initial State Radiation (ISR) contribution.
The goal of this study is to optimize the data-taking scheme for a fixed total integrated luminosity and given beam parameters with their corresponding systematic uncertainties. Table 1 summarizes the inputs and configurations used in this study. For comparisons, the configurations used by the FCC-ee study are also listed.
Among the configurations listed in Table 1, the mass and width of the boson are from the PDG WMass_PDG2018 ; the total luminosity is assumed to be 3.2 expected at the CEPC in one year data-taking; the parameters for beam energy and its spread are from the CEPC’s Conceptual Design Report CEPC_1 ; other assumptions on the systematic uncertainties are largely the same as the ones in the FCC-ee’s paper Fcc_ee_WMass , except for the signal selection efficiency. To estimate the selection efficiency and purity for the -pair events, the semi-leptonic process is simulated at the generator-level using the Monte Carlo (MC) package whizard Whizard_1 ; Whizard_2 at GeV. The signal candidates are selected by requiring two jets, one muon. The energy of the muon must be larger than 30 GeV. The corresponding signal selection efficiency is about 90% with a signal purity of about 98%. Figure 3 shows the distributions of the invariant and recoil mass of the two selected jets. For the pure leptonic and hadronic processes, , signal event selections are more complex, thus the selection efficiency and the purity are expected to be lower than those of the semi-leptonic decays. For this study, weighted selection efficiency and purity of 80% and 90%, respectively, are assumed for selecting -pair events.
For the energy calibration, resonant depolarization is the most precise method, which is successfully applied at LEP LEP_Redipo_1 ; LEP_Redipo_2 ; LEP_Redipo_3 . This method are proposed also by both FCC-ee Fcc_ee ; EPOL17 and CEPC CEPC_1 for pole and -pair threshold energy regions. And FCC-ee’s study shows that the precision of 500keV of the beam energy calibration at -pair threshold can be achieved FCC-ee_CDR , but require a dedicated operation mode, specific hardware elements, and carefully controlling and monitoring of the operating conditions.
For what concerns the energy spread, it has been shown in FCC-ee studies EPOL17 ; EPOL17Janot that it can be measured and monitored to a precision of 5% making use of the acollinearity distribution of dimuon events EPOL17 . For CEPC, the further study of the energy spread is in progress, so the 10% is taken as the uncertainty the energy spread conservatively.
III Consideration on the uncertainties
Once the configurations of the data samples described above are assumed, the data-taking scheme can be optimized. The guideline of the optimization is to obtain the highest precision of the mass (width) of the boson based on the fixed total integrated luminosity. Thus the statistical and systematic uncertainties of the and measurements are investigated firstly, following with the estimations of the total uncertainties of the and measurements for specific data-taking schemes.
III.1 Statistical uncertainty
The -pair cross section can be experimentally determined by counting the number of (-pair) events. It should be noted that boson’s three major decay channels (, , ) are all used to increase the statistical power. Although each channel has its own efficiencies and background, the global analysis and the simultaneous fit could be applied to get the total -pair events.So the number of the total W pairs can be determined by combining all various channels with all branching ratios and efficiencies taken into account.
The -pair cross section at a specific CM energy point is determined by:
[TABLE]
where is the signal yield, and the numbers of observed events and estimated background events, respectively, the integrated luminosity, and the signal selection efficiency. With Eq. 2, the statistical uncertainty of the can be expressed as (assuming Poisson distribution):
[TABLE]
where is the signal purity of the selected sample, is the surviving rate of background events (i.e. background efficiency) and is the total background cross section.
If the data is taken at one single energy point, the statistical sensitivities of the boson mass and width can be obtained individually:
[TABLE]
Figure 4 shows the statistical uncertainties of and as functions of of the data-taking. The distributions show minimal statistical uncertainties for and , but at two different values. Please note, however, only one of them can be determined at one single data point, with the another one fixed to the world averaged value WMass_PDG2018 .
For taking data at more than one energy point, and can be measured simultaneously. The statistical uncertainties can be obtained by the covariance matrix, which is the inverse of the second-order derivative matrix of the log-likelihood or function with respect to its free parameters, usually evaluated at their best values (the function minimum). The minimum method is used in this study and the is constructed as:
[TABLE]
which is minimized using the minuit package Minuit .
Therefore the covariance matrix can be written as:
[TABLE]
The diagonal elements of the second-order derivative matrix, are de-coupled from other parameter(s), but when the matrix is inverted, the diagonal elements of the inverse contain contributions from all the elements of the second derivative matrix. When the number of fit parameters is reduced to one, Eq. 6 is simplified to Eq. 4.
Fig. 5(a) shows that the dependence of the precision of and/or are in inversely proportional to integrated luminosity, which is consistent with the Eq. 4 and 6. The derivatives of the statistical uncertainties are shown in the Fig. 5(b), and it become almost stable when luminosity is greater than 6 ab*-1*.
III.2 Systematic uncertainties
Since the boson mass and width are determined by comparing the measured cross section(s) of -pair with the theoretical prediction(s), there are various sources could contaminate the measured precisions, which can be separated into two categories: 1) The "X-value" (abscissa of Fig. 2) uncertainties, such as the beam energy calibration () and the beam energy spread () measurement. Generally speaking, there will be some dedicated approaches to measure and , and the uncertainties after the measurements are defined as and , respectively; 2) The "Y-value" (ordinate of Fig. 2) or "yield uncertainties", which are affected by the integrated luminosity, the selection efficiency and the background determinations.
III.2.1 "X-value" uncertainties
The energy and energy spread of each beam are associated with the accelerator performance, and their uncertainties are treated as point-to-point, which means that these uncertainties of different data points are independent with each other. The uncertainties of energy and energy spread of each beam are both assumed to follow Gaussian distribution, and , where and are the nominal values for the energy and its spread, respectively.
Take the energy spread into account, the measured cross section at a specific energy point, , reads:
[TABLE]
When both and are considered, the becomes:
[TABLE]
The associated with the can be written as
[TABLE]
Figure 6 shows the dependence of the uncertainty of on the , with MeV (since the two beam energies are thought to be independent, the uncertainty of the beam energy is 0.5 MeV, and 0.7 MeV for the total CM energy). The black dots with error bars are the simulations results and the blue curve is the numerical result from Eq. 9, which are consistent with each other. It can be seen that the associated with the almost insensitive to the energy from 155 GeV to 165 GeV, which indicates that this uncertainty can be estimated separately with the optimization of the data-taking strategy.
The distributions of -pair cross section with different energy spreads are shown in Fig. 7, whose Y-axis is the ratio between the cross sections with different and the nominal one without the spread. We can see that the dependence of cross section on the beam energy spread intersects at a point at GeV, which means that the cross section is insensitive to the beam energy spread in the vicinity of this specific energy point. So the effects of the energy spread and its uncertainty to the cross section are both can be neglected here. Analytic way to consider the effect of the energy spread can be performed using the Taylor expansion of the FCCW18_2Azzurri , which reads
[TABLE]
With the above expansion, the Eq. 7 becomes
[TABLE]
The variation of the cross section is
[TABLE]
The third item of Eq. 11 is about two orders of magnitude smaller than the second one, therefore the high order items can be neglected safely. So the effect of the uncertainty of energy spread on the can be expressed as
[TABLE]
With , , and at 161.2 GeV, associated with is about 0.2 MeV, which is consistent with the result obtained by simulation.
III.2.2 "Y-value" uncertainties
From the Eq. 2 we can see that the signal yield (number of events), is affected by the uncertainties related to the luminosity, efficiency, and background in different ways, which can be shown from the error propagation:
[TABLE]
where and are the relative uncertainties of luminosity and efficiency, and is the uncertainty of background.
For the production above their threshold, the potential main background processes include , , , , and ALEPH ; DELPHI ; L3 ; OPAL . The effect of the backgrounds has two parts, the statistical fluctuation and the uncertainty of the theoretical predictions of their cross sections. The effective background cross section is set as 0.3pb in this study, which is consistent with LEP2’s result ALEPH ; DELPHI ; L3 ; OPAL and the one in FCC-ee’s work Fcc_ee . The contribution of the statistical uncertainty of background to is
[TABLE]
[TABLE]
where and are the selection efficiency and cross section of backgrounds, respectively, and their product is the effective background cross section, and is the relative uncertainties of the background cross section. The ratio of them can be written as
[TABLE]
With ab*-1*, , and pb at 161.2 GeV, the corresponding and the is about MeV. The contributions of have already been considered by embodying in the product of the efficiency and purity as shown in Eq. 4, which is a simply dilution of the statistical power of data sample. It should be noted that the input for used in this work is at level, which is comparable with FCC-ee’s work Fcc_ee_WMass . But this assumption is quite challenging for the current knowledge about the background, especially for the hadronic processes. Based on this spot, the background could be studied using the data-based method, such as data samples collected at the pole or below the -pair threshold to calibrate the background. If systematic uncertainty of background could be controlled at same level as its statistical part, this uncertainty will not be limiting the precision of the measured .
The uncertainties of luminosity and efficiency affect the cross section in same way, so we define the combined uncertainty, , to consider their total contributions of these two items. The associated with is
[TABLE]
With Eq. 18, one can obtain the of a specific energy point, and the similar result can be applied for width.
When there is more than one energy point, the uncertainties of luminosity and efficiency have often been treated as the non point-to-point ones in experiment. Since the same detector, signal model, and theoretical calculation (Bhabha process for determining the luminosity) are used for all the energy points. The cross sections of -pair production at different energy points are expected to vary in same unknown direction and in similar relative amount simultaneously, which means that these uncertainties of different data points are correlated.
There are two common to consider :
Gaussian case: is assumed to follow Gaussian distribution, which means that the cross section can be written as
[TABLE]
where is the nominal value.
- 2)
Non-Gaussian case: the is treated as a fixed value, so the cross section is
[TABLE]
For the Gaussian case, the measured follows the Gaussian distribution as well, and its standard deviation is . Figure 8(a) shows the simulation results with and at 161.2 GeV (the is enlarged 10 times for demonstration). The fitted are 0.24 and 2.4 MeV, respectively, which are consistent with the direct calculations from the Eq. 18.
For the non-Gaussian case, the situation is different. The measured cross section will be changed of , and the is turned to be the shift now, as shown in Fig. 8(b). We can see that the fitted is shifted to left with positive inputs for , since the is negative at this energy. This shifts becomes significant with the increasing , so the correlation should be taken into account to reduce the contribution from , especially for the non-Gaussian case.
In general, there are several ways to consider the correlation between multiple energy points in experiment, such as the covariance matrix and scale factor methods CELLO_R ; ConvMatrix . These two methods are discussed and compared in the Refs. Chisq_Equi ; Four_Chisq ; Further_Chisq ; Sys_Chi2 and the latter is used in this work, with the constructed as
[TABLE]
where is the combination of the statistical and uncorrelated systematic uncertainties, is the total relative correlated systematic uncertainty, is a free parameters and represents the potential shift of the measurement.
The scale factor method is adopted for both the Gaussian and non-Gaussian cases. Since an additional fit parameter, , is needed for this method, the energy point at 162.5 GeV is added. Figure 9(a) shows the simulation results for the Gaussian case. We can see that even when increases by 10 times, the corresponding variation on is still very small. The advantage of this method is more obvious for the non-Gaussian case, as shown in Fig. 9(b). Even though the uncertainties are increased by an order of magnitude, the shift of is well controlled.
Apart from the uncertainties discussed above, the one on the theoretical calculated -pair cross section , , is an important source which may limit the precision of the measured (). The contribution of is in the same form as Eq. 18, and will have a prominent effect if is quite large. With the at level, the corresponding is about 1.7 MeV at 161.2 GeV, which dilutes the statistical power obviously. The precision of at threshold in LEP2 era was at level, so it is extremely important to improve this for the precise measurement of () in future.
IV Data-taking strategies
In the above discussion, the main sources of the uncertainties of ( for data-taking at more than one point) are studied, including both the statistical and systematic ones. Generally, () depends on the energy of the data point, and the statistical part is also limited by the integrated luminosity. The optimization of the data-taking strategy is to determine the number of data-taking points, the energy of each data point, and the allocation of the integrated luminosity for a fixed total integrated luminosity. The FCC-ee has investigated data-taking at one and two energy points to measure and Fcc_ee_WMass . When the systematic uncertainties are taken into account, especially for the correlated ones, more energy points are beneficial for an optimal measurement.
MC experiment method is used to optimize the data-taking schemes. The number of -pair events is compared with the theoretical predictions, and the corresponding ( and ) and its (their) uncertainties can be obtained. The construction is listed in Eq. 5 for data taking at one or two energy points, and in Eq. 21 for three energy points.
For each MC experiment, the statistical and uncorrelated systematic uncertainties, are assumed to follow independent Poisson and Gaussian distributions at all energy points, respectively; and for each correlated systematic uncertainty, the Gaussian distribution is assumed. The experiments are repeated 500 times, the corresponding distributions of and are expected to follow Gaussian distribution, whose standard deviation represent the combinations of all different uncertainty sources.
IV.1 Measurement of the boson mass at one energy point
For data taking at a single energy point, there is an ideal choice, GeV, to measure with the best statistical sensitivity as shown in the Fig. 4 (a). But the contributions from systematic uncertainties need to be included for a realistic measurement. An interesting feature is the effect of the uncertainty on the boson mass. Figure 10 shows how the line-shape of -pair cross section varies according to the boson mass and width, where the black line is the one with and fixed to the world averaged values WMass_PDG2018 , GeV and GeV, and bands correspond to the variations of the boson mass or width in large ranges, GeV. It can be seen that although the variation of the boson width changes the cross section line-shape, there is a common intersection of all the line-shape curves with different , GeV, which indicates that the cross section around this energy points is insensitive to the uncertainty of the boson width.
Based on the above discussion, two specific energy points are favored for the mass measurement. The first is the most statistically sensitive one, GeV, and the other is GeV, where the uncertainties of and the have negligible effects on the mass measurement. At 161.2 GeV, the effect of uncertainty from on mass can be written as , which could be estimated with numerical calculation. With and at 161.2GeV and MeV WMass_PDG2018 , the corresponding is about 7.5 MeV.
Table 2 summarizes the results for the data taking at either one of the above two energy points with the configurations in Table 1. It can be seen that the dominant contribution to at 161.2 GeV is from the uncertainties of , which is negligible at GeV. Thus 162.3 GeV is a better choice when only is measured and the expected precision is about .
IV.2 Measurement of the boson mass and width at two energy points
In the previous section, data taking at one energy point is investigated, the best precision of can be obtained with GeV. With one energy point, only can be measured. Alternately, both and can be determined simultaneously if two energy points near the -pair threshold are adopted for data-taking. In this case, the statistical uncertainties of and can be obtained using Eq. 6.
To obtain the best precision of and for a given total integrated luminosity, the data-taking scheme of the energy points and luminosity allocation for each energy point are optimized. A 3-dimensional (3D) scan of the energy points and (), and the luminosity fraction of the energy point is performed, which defined as . The scan step sizes of and are 100 MeV, and 0.05 for .
The best energy point for is above the -pair threshold, while the one for is below the threshold, as shown in Fig. 4, making it impossible to simultaneously achieve the best precisions for both. Thus an objective function is defined to quantify the relative importance of the two measurements: , where is the weight factor to be chosen. Since the boson mass is thought to be more important than its width, is used throughout this paper, and the goal of optimization is to minimize . Figure 11 (a)-(c) show the optimization of , , and . For the scheme of two energy points, the optimized parameter values are:
[TABLE]
where GeV is consistent with the expectation, since is minimal around this energy region and has more weight to . The -pair cross section is not very sensitive to when is less than 158 GeV, thus the distribution of is generally flat in this energy region. The corresponding luminosity fraction is smaller than the one around GeV. The projected precisions for and are summarized in Table 3.
IV.3 Measurement of the boson mass and width at three energy points
For taking data at more than two energy points near the -pair threshold, the correlation in the and measurements among different energy points can be taken into account by redefining the form and introducing additional parameter(s) as shown in Eq. 21. Therefore the effects of the correlated systematic uncertainties are reduced, leading to improved precisions of the measurements.
The procedure of optimization for three energy points scheme is analogous to the case for two energy points by adding another two scan parameters. The energies of the three data points, , , and , as well as the two luminosity fractions and are optimized to reach the best precisions of and , where and . The scan procedure is similar to that for the two energy points, except it is over a 5-dimensional parameter space now. The optimized parameter values are:
[TABLE]
With these results and the assumptions of total integrated luminosity and the systematic uncertainties, the expected and are listed in Table 3, and the total projected uncertainties would be
[TABLE]
where and are the theoretical uncertainties of the boson mass and width due to the cross section calculation Though the precisions of the boson mass and width for the three energy points are not improved much compared with those for the two energy points, the results for the three energy points are more realistic and robust. Since more energy points have the advantage of better background understanding and the sophisticated treatment of correlated systematic uncertainties.
IV.4 Discussion about the data-taking plan
Three data-taking schemes are investigated above for the best measurement precisions of the boson mass and width with the threshold scan method. With the fixed total integrated luminosity and expectations on systematic uncertainty controls, the data-taking is optimized to minimize the total uncertainties on the boson mass and width measurements.
The integrated luminosities of the CEPC and the FCC-ee at the -pair threshold are expected to be much larger than that at the LEP. In the ideal case of one single energy point, both the analytic and MC simulation method have showed that a statistical precision of less than 1 MeV can be achieved for . It indicates that the systematic uncertainties such as theoretical calculation, beam energy calibration, luminosity determination, etc. become more important. One interesting feature is that the due to the boson width and the beam energy spread vanishes around GeV. These two systematic uncertainties can be neglected for the data taking at this energy point.
For taking data at a single energy point, the boson mass and width cannot be determined simultaneously. Moreover, the best precision of either is obtained at different energies. However, the optimized for the two or three energy points is only slightly larger than the one for a single energy point as shown in Table 3. In this case, can be measured simultaneously. Also, although the optimized precisions on and are similar for the two and three energy points, the latter is beneficial for the treatment of the correlated systematic uncertainties, especially when the effects of these uncertainties are in the absolute form, which will cause shifts to the obtained and . Therefore, data taking at three different energy points is preferred, the corresponding optimal data-taking scheme is listed in Eq. LABEL:Optimize_3P.
Thanks to contributions from FCC-ee EPOL17 ; Fcc_ee_WMass studies, the different types of systematic uncertainties are considered comprehensively in this work, and the numerical results of the contributions of the dominant backgrounds are estimated. In this paper, the data taking schemes are optimized for a total integrated luminosity of 3.2 CEPC_1 . The results of the optimization can be scaled to other integrated luminosities. Table 4 lists the precisions of and with the threshold scan method, varying the total luminosity between 1 and 15. The three data taking schemes in the table are the optimized results described above, and all the uncertainties are statistical only. One can obtain the total uncertainty by adding the systematic uncertainties summarized in Table 3. The results for an integrated luminosity of 15 are comparable with FCC-ee’s results: (1) for the one energy point scheme, our result of MeV at 162.3 GeV is slightly worse than that of the FCC-ee study, i.e., 0.25 MeV at 161.4 GeV . Since the uncertainty of has significant contribution to around the most statistically sensitive energy point (up to 8 MeV), so the one at 162.3 GeV is chosen in this work, where the -pair cross section is insensitive to the and the statistical uncertainty of the increases a bit. (2) for the two energy points scheme, since the mass is thought to be more important than its width, it’s reasonable to allocate more luminosity to the energy point that benefits the measurement. So the precision of is slightly better than FCC-ee’s result, contrary to the precision on . It is worth noting that the contribution to from systematic uncertainties will become more important with the increasing of the luminosity, so the consideration of the systematic uncertainties is more important. With this in mind, the three energy points data-taking scheme is preferred since it allows for better control and treatment of the systematic uncertainties.
V Summary
In this paper, different data-taking schemes are investigated for the precise measurements of the boson mass and width at further circular electron positron colliders, such as the CEPC and FCC-ee. For a fixed total integrated luminosity, , and the expectations of the systematic uncertainties, taking data at three energy points is found to be optimal with the energies and luminosity allocations listed in Eq. LABEL:Optimize_3P. The corresponding projected uncertainties on the boson mass and width are MeV and MeV, respectively. Various systematic uncertainties are taken into account in the investigation. The one related to the theoretical calculation of the -pair cross section is discussed but not included in the numerical results and listed separately. It’s critical to improve the calculation for the high precision measurement of () using the threshold scan method.
Acknowledgements.
This work is supported in part by National Key Basic Research Program of China (Grant No. 2017YFA042203); National Natural Science Foundation of China (NSFC) (Grant No. 11875278); National Key Program for S&T Research and Development of China (Grant No. 2016YFA0400400); Joint Large-Scale Scientific Facility Funds of the NSFC and CAS (Grant Nos. U1332201, U1532258); the Hundred Talents Program of the Chinese Academy of Sciences (CAS) (Grant No. Y6291150K2); Beijing Municipal Science and Technology Commission project (Grant Nos. Z191100007219010, Z181100004218003).
The reference list from the paper itself. Each links out to its DOI / PubMed record.
- 1(1) S. L. Glashow, Nucl. Phys. 22 , 579 (1996).
- 2(2) A. Salam and J. C. Ward, Phys. Lett. 13 , 168 (1964).
- 3(3) S. Weinberg, Phys. Rev. Lett. 19 , 1264 (1967).
- 4(4) F. Englert and R. Brout, Phys. Rev. Lett. 13 , 321 (1964).
- 5(5) P. W. Higgs, Phys. Rev. Lett. 13 , 508 (1964).
- 6(6) P. W. Higgs, Phys. Lett. 12 , 132 (1964).
- 7(7) G. Arnison et al . (UA 1), Phys. Lett. B 122 , 103 (1983).
- 8(8) G. Arnison et al . (UA 1), Phys. Lett. B 126 , 398 (1983).