Characterization of immune cell populations in the tumor microenvironment of colorectal cancer using high definition spatial profiling
Michelli F. Oliveira, Juan P. Romero, Meii Chung, Stephen Williams, Andrew D. Gottscho, Anushka Gupta, Susan E. Pilipauskas, Syrus Mohabbat, Nandhini Raman, David Sukovich, David Patterson, Sarah E. B. Taylor
TL;DR
This study uses a new high-resolution spatial profiling method to map immune cells in colorectal cancer tissues and reveals distinct immune cell populations at the tumor periphery.
Contribution
The study introduces the use of the Visium HD platform for high-definition spatial profiling of FFPE CRC tissues, enabling single-cell-scale transcriptomic analysis.
Findings
Two pro-tumor macrophage subpopulations were identified with distinct gene expression profiles in specific tumor regions.
A clonally expanded T cell population was localized using in situ gene expression analysis.
An anti-tumor macrophage subpopulation was identified in the microenvironment of the clonally expanded T cells.
Abstract
Colorectal cancer (CRC) is the second-deadliest cancer in the world, yet a deeper understanding of spatial patterns of gene expression in the tumor microenvironment (TME) remains elusive. Here, we introduce the Visium HD platform (10x Genomics) and use it to investigate human CRC and normal adjacent mucosal tissues from formalin fixed paraffin embedded (FFPE) samples. The first assay available on Visium HD is a probe-based spatial transcriptomics workflow that was developed to enable whole transcriptome single cell scale analysis. We demonstrate highly refined unsupervised spatial clustering in Visium HD data that aligns with the hallmarks of colon tissue morphology and is notably improved over earlier Visium assays. Using serial sections from the same FFPE blocks we generate a single cell atlas of our samples, then we integrate the data to comprehensively characterize the immune cell…
Genes, proteins, chemicals, diseases, species, mutations and cell lines named across the full text — each resolved to its canonical identifier and authoritative record.
Click any figure to enlarge with its caption.
 Figure 1
 Figure 2
 Figure 3
 Figure 4
 Figure 5
 Figure 6
 Figure 7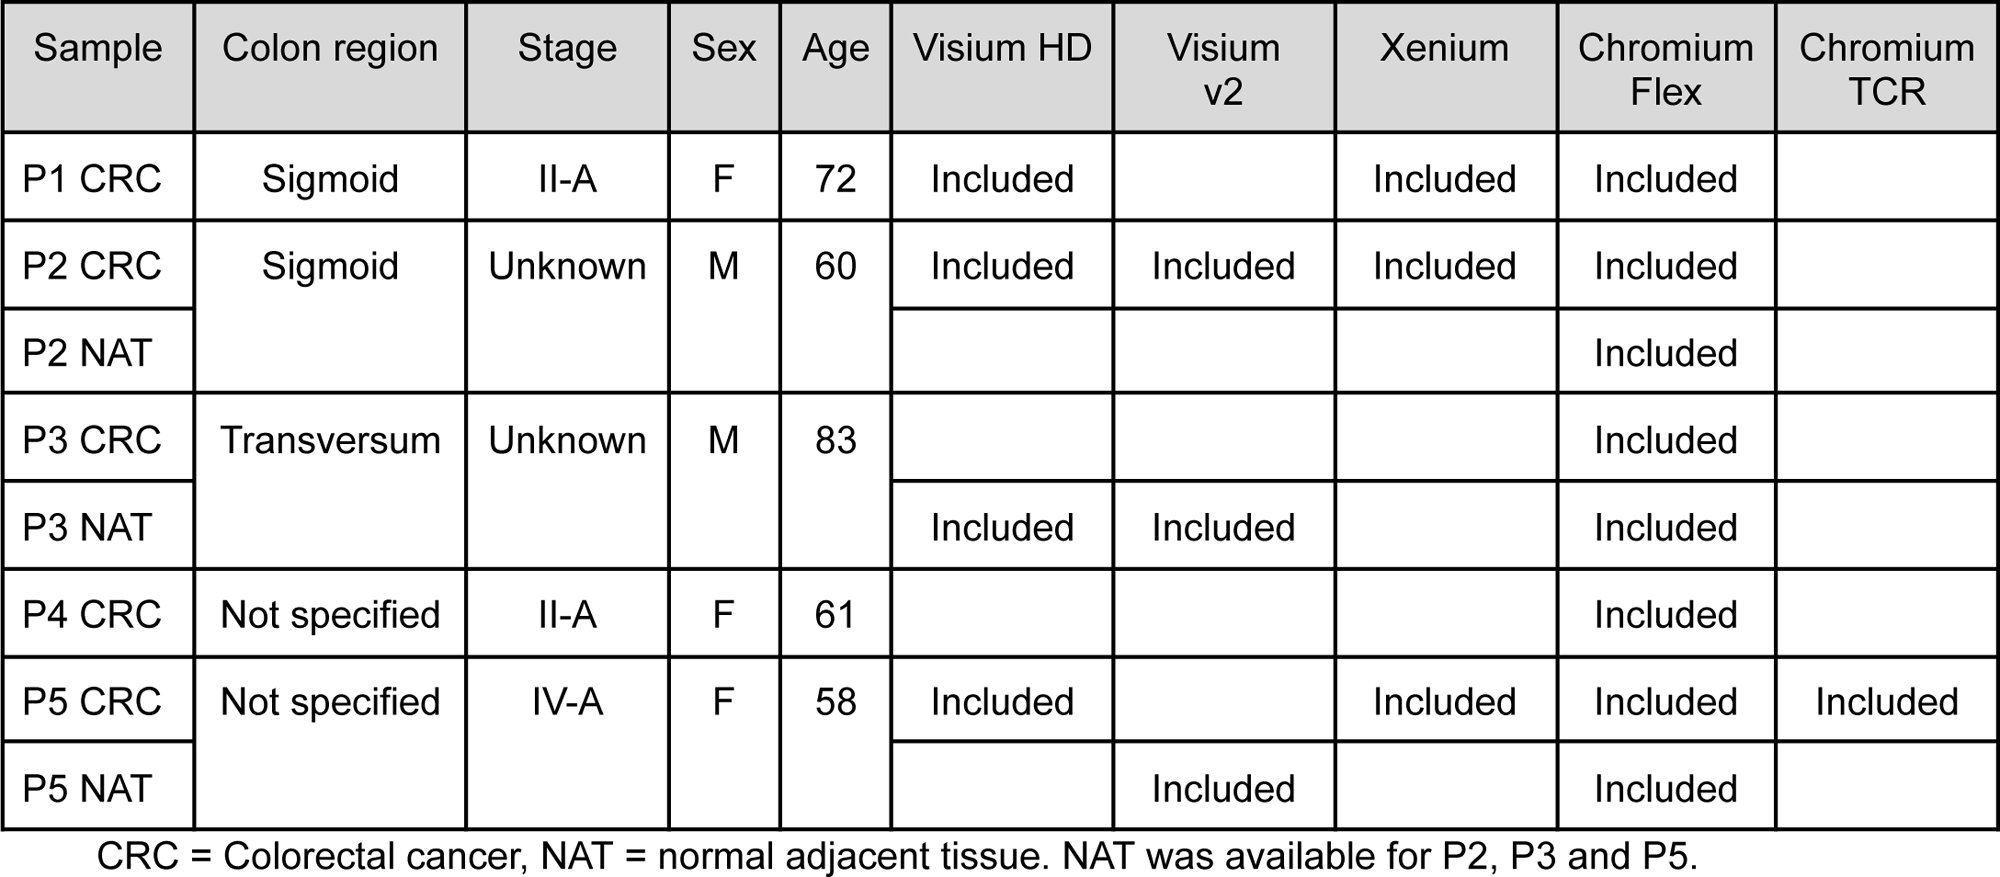
Peer Reviews
No public reviews on file for this paper yet. If you reviewed it on a platform where reviews are public (OpenReview, ICLR, NeurIPS, ICML), you can paste yours below so the community can read it here.
Videos
No videos yet. Explain this paper in a talk, walkthrough, or lecture? Add one.
Taxonomy
TopicsSingle-cell and spatial transcriptomics · Cancer Immunotherapy and Biomarkers · Immune cells in cancer
Introduction
Colorectal cancer (CRC) accounted for 9.4% of cancer-related deaths (0.9 million) in 2020, and its global incidence is predicted to double by 2035^1,2^. Its poor overall 5-year survival rate highlights the need for better early detection and prognostic biomarkers that can be used in future disease management strategies^3^. During the past decade, there has been growing evidence that tumor heterogeneity is best described at the transcriptome level, rather than with classical histological or mutation-centered disease classifications^4^. Therefore, technologies that refine our understanding of the tumor microenvironment (TME), including the diverse roles of innate and adaptive immune responses and cellular crosstalk in CRC, have the potential to inform better clinical intervention strategies.
Sequencing-based genomics technologies have played an important role in building our current knowledge of CRC biology^4–7^. However, bulk sequencing approaches, which average the data from cells and tissues, are confounded by the complexities of the tumor microenvironment (TME) and intratumor heterogeneity. Single cell transcriptomics (scRNA-seq) technologies have in part filled this gap and allowed for detailed exploration of the cell types within the TME in CRC^8–16^. While these studies add critical single cell level resolution to our understanding of CRC, they lack any information about the organization of the cells within the tissue. Spatial transcriptomics technologies offer a solution. Several commercial technologies are currently available for discovery-based spatial transcriptomics, including Visium CytAssist Spatial Gene Expression (“Visium v2”, 10x Genomics), STOmics (BGI), and Curio Seeker (Curio Bioscience). Other published methods include Seq-Scope^17^, Nova-ST^18^, Open-ST^19^, HDST^20^, DBiT-seq^21^, Pixel-seq^22^, and XYZeq^23^. These methods have enabled the localization of cell types within tissues, which is critical for understanding the interaction between cells in the TME of CRC^24–27^. However, these technologies lack resolution at the single cell scale, or are typically only compatible with fresh frozen tissues, and as such, a deep understanding of tumor organization based on readily available biobanked samples remains elusive.
Here, we introduce Visium HD Spatial Gene Expression (“Visium HD”) and demonstrate its use as a discovery platform for profiling CRC in multiple patients using FFPE tissue blocks. Visium HD slides provide a dramatically increased oligonucleotide barcode density over the Visium v2 slides (11,000,000 continuous features in a 6.5 mm Visium HD capture area, compared to 5,000 features with gaps between them in a 6.5 mm Visium v2 capture area). The single cell scale resolution of Visium HD allowed us to map distinct populations of immune cells, specifically macrophages and T cells, and evaluate differential gene expression at the tumor boundary to explore the potential contribution of these immune cell populations in the TME.
Using an FFPE compatible single cell workflow (the probe-based, Chromium Single Cell Gene Expression Flex) we also generated a multi-patient single cell reference dataset from a larger cohort of FFPE samples and used it to refine our ability to identify distinct cell types. We used this dataset to deconvolve the Visium HD data bins, validating the cell type populations identified by Visium HD and subsequently using the integrated data to comprehensively map the cellular composition and molecular signatures of the TME in CRC. To better understand the interaction between the tumor and its surroundings, we examined the peripheral region that surrounds the tumor by 50 µm. This analysis allowed us to spatially map distinct subpopulations of macrophages to specific regions of the tumor, and compare their transcriptomic profiles which indicate they may exert pro-tumor roles via different pathways. This level of TME characterization was only possible at the resolution of Visium HD, which allowed us to specifically interrogate the cells in closest proximity to the tumor which are likely to have the greatest impact on tumor progression.
With any new technology, validation of findings with an orthogonal approach is critical. To validate the spatial accuracy of Visium HD, we analyzed a subset of genes using an independent spatial technology (Xenium In Situ Gene Expression) and saw strong concordance between the different technology readouts. Next, we mapped macrophages, tumor subpopulations, and T cells that we had observed in the TME via Visium HD data, at single cell resolution using the Xenium technology. Xenium corroborated the presence of the two pro-tumor macrophage subpopulations in different niches and allowed us to pinpoint the location of the T cells within the TME. Using Xenium, we were also able to detect a clonally expanded T cell population and the cellular microenvironment in which it resides, revealing an anti-tumor niche with a third macrophage subpopulation.
Our study underscores the importance of using high resolution spatial technologies in exploring the heterogeneity of tumor biology. These advanced tools are crucial for precisely mapping the diverse immune cell niches within CRC and elucidating the complex interactions between these cells and their microenvironment. By leveraging spatial technologies, we can gain a detailed understanding of spatial variations in cell types and subpopulations, and cell-to-cell relationships, which are key to developing targeted therapies and personalized medicine approaches. The combination of whole transcriptome and targeted in situ spatial technologies used in our investigation provides deeper insights into the complex and dynamic nature of the TME, highlighting the importance of spatial context in understanding cancer heterogeneity and progression.
Results
Visium HD specifications and performance
In this study, we included five patients with colorectal adenocarcinoma (Table 1), from which we obtained FFPE (CRC n = 5, and normal adjacent tissue (NAT) n = 3) blocks. Serial sections of FFPE tissues were prepared and selected samples were included to benchmark the technology performance or to explore the TME using Visium HD. Additionally, selected serial sections from the same FFPE blocks were used to generate a single cell RNA-seq dataset and for evaluation via in situ gene expression (Figure 1).
Analysis of CRC and NAT samples using Visium HD. Serial tissue sections were taken from colorectal adenocarcinoma (CRC, n = 5 samples) and normal adjacent tissues (NAT, n = 3 samples) FFPE blocks. A subset of samples were selected and analyzed with the Visium HD assay (n = 3 CRC and n = 2 NAT). Sections from the same FFPE blocks were assayed with single cell RNA-seq (Chromium Single Cell Gene Expression Flex; n = 8). Serial sections were analyzed with Xenium In Situ gene expression (n = 4 CRC) and assayed via the Visium v2 assay (n = 1 CRC and n = 2 NAT). Single cell data were used to create a reference dataset for cell type annotation. In situ data were used for validation of the findings from the Visium HD data and for subsequent analyses. Technology performance comparisons were performed using data from matched datasets.
Table 1.: Samples evaluated in this study
The Visium HD assay enables spatial gene expression analysis with probes targeting the whole transcriptome at single cell scale. Visium HD slides contain two 6.5 x 6.5 mm capture areas within a 8 x 8 mm fiducial frame, where each capture area consists of ∼11 million 2 x 2 µm squares arranged in a continuous array of uniquely barcoded oligonucleotides (Figure 2A). Importantly, the 2 µm squares are directly adjacent to each other, resulting in a continuous lawn of capture oligonucleotides with no gaps between features, representing an improvement over earlier Visium slides, which have 55 µm circular capture areas with gaps between them (Figure 2B). For downstream analysis, the 2 µm data can be used directly or collated into larger bins to increase the coverage of the data; the Space Ranger (v3.0) pipeline outputs the 2 µm data and data binned at 8 and 16 µm resolution (unless otherwise described, the 8 µm binned data were used in this study). To assess the increased resolution afforded by Visium HD, we analyzed serial sections from a normal colon mucosa sample run on Visium v2 and Visium HD. Visium HD generated notably higher resolution data, as shown in the improved unsupervised clustering, both in terms of the total number of clusters detected (18 clusters in Visium HD vs. 3 clusters in Visium v2), and the ability to map them to morphological features of the colon mucosal tissue (Figure 2C). Next, we assessed the correlation between Visium v2 and Visium HD data using serial sections of colon samples (2 NAT samples and 1 CRC sample, Figure 2D and Supplemental Figure 1). Our data show a strong correlation between UMI counts at the whole transcriptome level at similar sequencing depth across an entire tissue (matched tissue areas), highlighting that the data obtained from each assay are highly comparable in terms of sensitivity across the colon tissues analyzed (R^2^ = 0.82, Figure 2D; R^2^ = 0.81 and 0.90, Supplemental Figure 1). To remove any potential bias arising from off-target probe binding events, i.e., probes binding to genomic DNA (gDNA), which could introduce sensitivity biases in this analysis, we compared the UMI counts for the subset of probes that spanned only exon-exon junctions (7,605 probes out of 54,580). The estimated fraction of molecules (measured by the number of UMIs) arising from gDNA was 4.1% in Visium v2 and 0.5% in Visium HD. When comparing counts from the probes spanning exon-exon junctions, we observed a stronger correlation between assays (R^2^ = 0.92, Figure 2D; R^2^ = 0.93 and 0.96, Supplemental Figure 1), indicating that the increased resolution of the Visium HD assay maintains the high assay sensitivity of Visium v2.
Visium HD Spatial Gene Expression slide architecture and performance. A. Visium HD slide with two 6.5 x 6.5 mm capture areas, each containing a continuous lawn of uniquely barcoded 2 x 2 µm squares, which are binned to 8 µm squares for downstream analysis. B. Visium HD slides, compared to Visium v2, which have spots of 55 µm diameter spaced 100 µm apart. C. Comparison of serial sections of a representative normal colon mucosa sample P3 NAT. Visium HD detects eighteen clusters that closely correspond to tissue morphology, while Visium v2 detects three clusters. D. Sensitivity comparison between Visium HD and Visium v2 on representative sample P3 NAT. Left plot shows expression levels of all probes (whole transcriptome); the right plot shows only probes spanning an exon-exon splice junction. Diagonal lines represent x = y. E. Transcript localization accuracy analysis performed across four randomly selected regions of interest (ROIs) per tissue section for selected goblet cell gene markers (CLCA1, FCGBP, MUC2); source masks are colon gland structures, adjacent masks are the immediately adjacent regions containing lamina propria. Images show selected ROIs in a representative normal sample P3 NAT; red lines outline the source mask, yellow lines the adjacent mask. Table shows the median percentage of localized transcripts in the source and adjacent masks, the density of selected transcripts in both masks, and the distance of selected transcripts from source masks (). Four ROIs in each colon sample were included in this analysis.*
In array-based spatial technologies, mRNA must migrate from the tissue to come into contact with a primer (or vice versa, the primer must come into contact with the mRNA molecule). However, because transcript migration does not occur linearly, if the tissue placement and subsequent molecular biology reactions are not carefully controlled, the spatial accuracy of mRNA detection may be impacted, i.e., transcripts may be detected away from their origin. Similar to the Visium v2 assay, Visium HD utilizes a controlled environment to transfer analytes from tissues to the capture arrays (the CytAssist instrument), improving spatial accuracy of RNA detection^28,29^. Poor transcript spatial accuracy has the potential to impact biological interpretations, thus we sought to assess this in samples run through the Visium HD workflow. For this analysis, we evaluated two NAT samples and one CRC sample (Figure 2E). We selected genes that are known to be localized within glands of normal colon mucosal tissue (goblet cell gene markers: CLCA1, FCGBP, MUC2). In each tissue section, we manually selected four random regions of interest (ROIs) matching colon glands (“source masks”) and their immediate adjacent regions containing lamina propria (“adjacent masks”) and measured the transcript localization accuracy of the selected goblet cell gene markers. Across each sample, the majority of transcripts were localized in their expected morphological locations within the source masks (98.3 – 99%), and only a small proportion (0.97 – 1.73%) were in adjacent masks (Figure 2E), demonstrating the high spatial accuracy of mRNA detection obtained from Visium HD.
Visium HD reveals the spatial landscape of CRC tumors at single cell scale
To characterize the spatial landscape of the CRC samples, sections from three blocks (P1 CRC, P2 CRC and P5 CRC) were selected for profiling using Visium HD. The resulting unsupervised clusters aligned with the expected morphological features, highlighting the spatial organization of the samples (Figure 3A). Since each section was analyzed independently, the results were patient specific and thus limited our ability to perform cell type comparisons between sections. To ensure we had the most refined and consistent cell type labels across all samples, we generated a single cell reference atlas from serial FFPE sections of CRC and NAT (n = 8 blocks, Table 1), which included the same three blocks selected for Visium HD. This approach enabled us to sample and profile 245,494 cells (after quality control analysis), which gave us more power for cellular annotations. We then applied differential gene expression (DGE) analysis to identify marker genes between these clusters. We manually classified the graph-based clusters into ten broad cell types, denoted as level 1 annotations. For level 2 annotations, we repeated the clustering process within each level 1 cluster, maintaining 25 PCs but adjusting the resolution parameter to 0.1 to prevent over-splitting. We identified marker genes through DGE and annotated cell types manually based on published cell gene markers (Supplemental Figure 2). We then used this annotated single cell dataset as a reference to deconvolve the HD data, assigning a homogeneous set of cell type labels across the different samples (See Methods and Figure 3B). To compare the Visium HD unsupervised clustering results with the deconvolved labels, we plotted confusion matrices for each sample as heatmaps and observed that the most prominent cell types were also detected by unsupervised clustering (Figure 3C). These findings confirm that the expected cell types in the colon mucosa can be identified based on the Visium HD data alone and deconvolution using single cell data is not required. However, deconvolution based on single cell data and assignment of uniform labels is useful for performing comparisons between samples.
Spatial mapping of CRC samples using Visium HD reveals high resolution, accurate transcript mapping. A. Spatial mapping of three CRC samples (P1 CRC, P2 CRC and P5 CRC) with 8 µm bins colored based on unsupervised clustering. B. Spatial mapping of the same three CRC samples with 8 µm bins colored by cell types predicted by deconvolution using the single cell reference dataset. C. Confusion matrices denoting the relationship between the unsupervised clusters (rows) and labels assigned by deconvolution labels (columns). Data is scaled by row. D. Validation of selected cellular gene markers with known spatial localization: PIGR (goblet cells and enterocytes), CEACAM6 (tumor) and COL1A1 (fibroblasts). Samples correspond to those in A. For each sample, the tissue-level view is shown on the left, with the inset as a black box, and the inset view is shown on the right. Scale bars: black = 1 mm; blue = 80 µm.
The deconvolved Visium HD data provided a highly resolved map of the cell types observed in the single cell reference data, aligning with tissue morphology. For example, we mapped most goblet cells and enterocytes in the normal mucosa, cancer-associated fibroblasts and tumor cells were mapped to the tumor area, and multiple immune cell types were mapped throughout the tissue sections (Figure 3B). We observed that each patient sample was associated with a major and distinct tumor cell type (Supplemental Figure 3 and Supplemental Figure 4) mapped onto the morphological tumor regions across each tissue section. We validated the spatial arrangement of these cell labels in Visium HD with the expression of well known markers such as PIGR (goblet cells and enterocytes), CEACAM6 (tumor) and COL1A1 (fibroblasts) (Figure 3D).
Macrophages are enriched at the tumor boundary
Given that immune cell dynamics are known to play a key role in CRC progression, we wanted to characterize the immune cell populations within the TME of our CRC samples. We focused on the tumor boundary region so that we could understand immune cell dynamics and function in these tumors. Taking advantage of the improved resolution afforded by Visium HD, we used distance-based analysis to resolve the cellular composition of tumor boundary, an analysis that is not possible to do at the resolution of Visium v2. We selected all barcoded 8 µm bins within 50 µm of the regions we had labeled as tumor cells via spot deconvolution (Figure 4A) that include only a determined single cell type (i.e. not a mixture of, or undetermined cell types). Once the set of barcodes in these tumor peripheral regions was defined, we quantified the composition of cell types present in the 50 µm region peripheral to the tumor. When compared to the rest of the tissue, cancer associated fibroblasts (CAF) were the most prominent cell type, while macrophages were consistently identified as the most abundant immune cell type, across all tissue blocks studied (Figure 4B). We corroborated these findings, which were derived from the cell type annotation, by examining the expression of known macrophage (C1QC) and CAF (COL1A1) markers (Figure 4A).
Cellular composition of the tumor periphery in each CRC section. A. Analysis of the tumor periphery. 8 μm bins annotated as tumor cells are shown in red, with bins within 50 µm of the tumor periphery shown in blue. Rows correspond to three different samples. The first column shows the 6.5 x 6.5 mm capture area, the second column shows the zoomed in view, the third column shows the corresponding expression of C1QC (macrophages), and the fourth column shows the corresponding expression of COL1A1 (fibroblasts). Scale bars: green = 1 mm; black = 125 µm. B. Dot plot with the proportion of cell types in the tumor periphery (blue) and the rest of the tissue section (gray) for the three different blocks.
Transcriptomic analysis of the macrophage-enriched tumor regions reveals two macrophage subpopulations
As the most abundant immune cell type in the tumor periphery, we focused our analysis on the tumor regions enriched with macrophages to gain insights on their interplay with the TME. First, we evaluated if these cells presented heterogeneous gene expression signatures and spatial locations within the tumor region. To do this, we selected the 8 µm bins deconvolved as macrophages around the tumor region to perform an independent unsupervised clustering analysis. We found two macrophage subpopulations with specific gene expression profiles mainly defined by expression of SELENOP or SPP1 genes (Figure 5A). We then took advantage of the whole transcriptome nature of the assay and performed an enrichment analysis of the differentially expressed genes to further characterize these macrophage subpopulations. We observed that *SELENOP^+^*macrophages were differentially enriched for pathways such as TNF-α signaling via NFK-β, apoptosis pathways, and UV response to DNA damage. Meanwhile, SPP1^+^ macrophages were enriched for coagulation, cholesterol homeostasis, and upregulation of KRAS signaling pathways (Figure 5B).
Identification and localization of two macrophage subpopulations in the tumor microenvironment. A. Dot plot showing expression profiles of two distinct macrophage subpopulations identified at the boundary in the tumor samples studied. B. Bar plot showing the enriched gene sets for the macrophage subpopulations identified. C. Kernel density maps showing the differential spatial localization of SELENOP+ and SPP1+ macrophages and how they are associated with tumor areas. D. Heatmap showing the expression of REG family genes (REG1A or REG3A) and TGFBI in the CRC sections. Scale bar = 1 mm.
To add the spatial context of these macrophage subpopulations in the TME, we identified highly enriched regions using density estimation (see Methods) and observed that the SELENOP^+^ and SPP1^+^ macrophages were mostly in different spatial niches in the tissue (Figure 5C). Analysis of the gene expression profiles of the tumor cells close to these macrophage subpopulations revealed that the different macrophage subpopulations were localized in tumor regions with differential gene expression profiles. Tumor cells in areas enriched for SPP1^+^ macrophages showed differential expression of TGFBI, while tumor regions closer to SELENOP^+^ macrophages were enriched for REG1A and REG1B (Figure 5D). Both TGFBI and the REG gene families have been implicated in tumor progression.
Characterization and spatial localization of T cells in the TME
The recruitment and function of T cells into the TME has been suggested to be associated with the dynamics of the cells in the tumor niches, and has long been associated with favorable disease outcomes^30^. As with most solid tumor types, CRC tumors are typically cold tumors, which have implications to immunotherapy interventions^31^. However, since our investigation employs high resolution spatial technologies, we wanted to leverage this to specifically explore T cell localization and behavior at the tumor boundary. In our initial analysis, we only included bins predicted to contain only one cell type (singlet 8 µm bins). However, we observed that the tumor periphery region (50 µm around the tumor) displayed enrichment in the number of bins labeled as doublets (two cell types co-existing in the same bin) compared to the rest of the tissue (Figure 6A). This finding is expected, given the known cellular heterogeneity at the boundary of morphologically distinct regions. We found that most T cells were assigned to doublet bins or rejected (the algorithm was unable to predict the cell type), and therefore excluded from our initial analysis, making it more challenging to spatially localize these immune subpopulations (Supplemental Figure 5). To overcome this, we first identified regions enriched in either CD4^+^ or CD8^+^ T cells, independent of whether they were assigned to a singlet or doublet bin (Figure 6B), and performed nuclei segmentation on these regions. We then leveraged the higher resolution 2 µm binned data and assigned the corresponding 2 µm bins that were located within the nuclei polygons to create a gene by nuclei UMI count matrix for further processing. Following this strategy, we were able to identify T cells at the tumor boundary (Figure 6C), but observed that cells expressing CD8A and CD4 were sparsely distributed. We also examined the expression of known T cell markers in this region (TRAC, CD3) and other cell type markers such as PECAM1 (endothelial), IGKC (plasma), COL1A1 (CAF), SPP1 or SELENOP (macrophages), and CEACAM5 (tumor) (Supplemental Figure 6) to obtain a fine grained map of the cell types in these areas of the tissue. This analysis allowed us to identify and localize both CD4 and CD8 T cells at the tumor periphery but not in the surrounding normal tissue, suggesting that these infiltrating lymphocytes may be playing an active anti-tumor role.
Spatial localization of T cells in the tumor microenvironment. A. Barplot showing the proportion of each 8 µm bin class (singlet, doublet, rejected) for each tissue region. B. Density maps showing the spatial location of CD8+ and CD4+ T cells in the different samples. C. Zoomed-in view of regions with bins labeled by deconvolution results at 8 µm (left), nuclei segmentation results in the zoomed-in regions (center) and normalized expression of CD4 and CD8A (right) of the transformed UMI matrix by grouping 2 µm bins within each of the segmented nuclei. Scale bars: black = 1 mm; yellow = 50 µm.
Xenium in situ analysis validates Visium HD findings and reveals the spatial distribution of clonally expanded T cells in the TME
To further investigate the spatial distribution of immune cells within the TME and to validate findings from the Visium HD data, we profiled the samples using the Xenium Analyzer. Xenium is an in situ spatial analysis platform that provides subcellular resolution for a targeted set of genes. We have previously shown that Xenium is ∼8.4x more sensitive on a per-gene basis than Visium v2 on a cohort of breast cancer samples^32^, and thus we wanted to use Xenium to validate our Visium HD findings and interrogate the T cell populations more closely. We first set out to benchmark the sensitivity of Xenium with Visium HD in this study. We used the Xenium Human Colon gene expression panel (322 genes) and a custom add-on panel targeting 100 additional genes, which was designed to target diverse immune populations we observed in the Visium HD data (Supplemental Table 1). The panel was used with the Multimodal Cell Segmentation workflow, which allows segmentation of cells based on boundary stains and morphology rather than relying on nuclear expansion alone. To compare the Xenium data to the Visium HD data, we limited the Visium HD data to the 422 genes on the Xenium panel, and found that Xenium was ∼5.7x more sensitive on a per-gene basis. However, when we compare total transcripts identified in the shared region, we see that Visium HD captures ∼6.5x more transcripts than Xenium due to its whole transcriptome nature (Supplemental Figure 7). Both of these results are in line with our previously published comparisons. We expect some differences in sensitivity gains due to differences in the specific genes that are included on the Xenium panels and the nature of the samples used in each study.
We then sought to validate our findings to confirm that the subtypes and localization of macrophages we had observed in the Visium HD data were correct. Consistent with the Visium HD findings, Xenium revealed heterogeneity within both tumor cells and macrophage populations (Figure 7A, 7B). SELENOP^+^/STAB1^+^-macrophages were found near REG1A^+^ tumor cells (Figure 7C, 7D) while SPP1^+^ macrophages were localized in close proximity to TGFBI^+^-tumor cells (Figure 7E, 7F). Interestingly, we observed that cancer associated fibroblasts (CAFs) which localized at the border of TGFBI^+^ tumor also expressed MMP11 (Figure 7E, 7F), a matrix metalloproteinase that breaks down ECM and is associated with poorer prognosis^33^. This colocalization of SPP1^+^ macrophages, TGFBI^+^ tumor cells, and MMP11^+^ CAFs within the TME may suggest a coordinated effort to promote tumorigenesis.
Xenium in situ confirms the existence and localization of macrophage subtypes and clonally expanded T cells in the tumor microenvironment. A, B. Expression of REG1A and TGFBI transcripts (right panels) and SPP1 (bottom left panel) within tumor region (top left panel). C, D. STAB1+ macrophages near REG1A+ tumor cells. STAB1 was used to visualize the macrophage subtype co-expressing SELENOP. E, F. SPP1+ macrophages shown in proximity of TGFBI+ tumor cells and MMP11+ cancer associated fibroblasts. G. Combined expression of clonotype TRA1/TRA2/TRB in sample P5 CRC. H. Clonally expanded CD8 cytotoxic T cells reside closely to tumor cells and within CXCL9/CXCL10/CXCL11 foci. I. Zoom in view of the same regions using Visium HD with 2 µm bins assigned to segmented nuclei. Bins are colored by the normalized log UMI counts of CEACAM5, SELENOP, C1QC, JCHAIN, TRAC, and CXCL9. Scale bars: 2 mm in A, B, G; 100 µm in C, D, E, F; 20 µm in H; 50 µm in I.
To better understand the T cell response at play we wanted to explore the clonality of the antigen recognizing T cell receptors (TCRs) of the T cells in and around the CRC tumors. To do this, we obtained dissociated tumor cells from the same patient samples and isolated the T cells. We then profiled the TCR clonality of these T cells using the Single Cell Immune Profiling v2 workflow. This analysis revealed a clonotype with 11% representation within the T cell population of sample P5 CRC (TRAV38-1 TRAJ58; TRAB38-2/DV8 TRAJ57; TRBV4-2, TRBJ2-1. Supplemental Table 2), but no expansions in the other samples. To confirm this was a novel clonotype specific to this patient tumor and not present due to on ongoing or prior infection, we searched VDJdb (https://vdjdb.cdr3.net/) and found no known matches to the CDR3 sequences, indicating that this clonotype recognises to a neoepitope specific to this tumor.
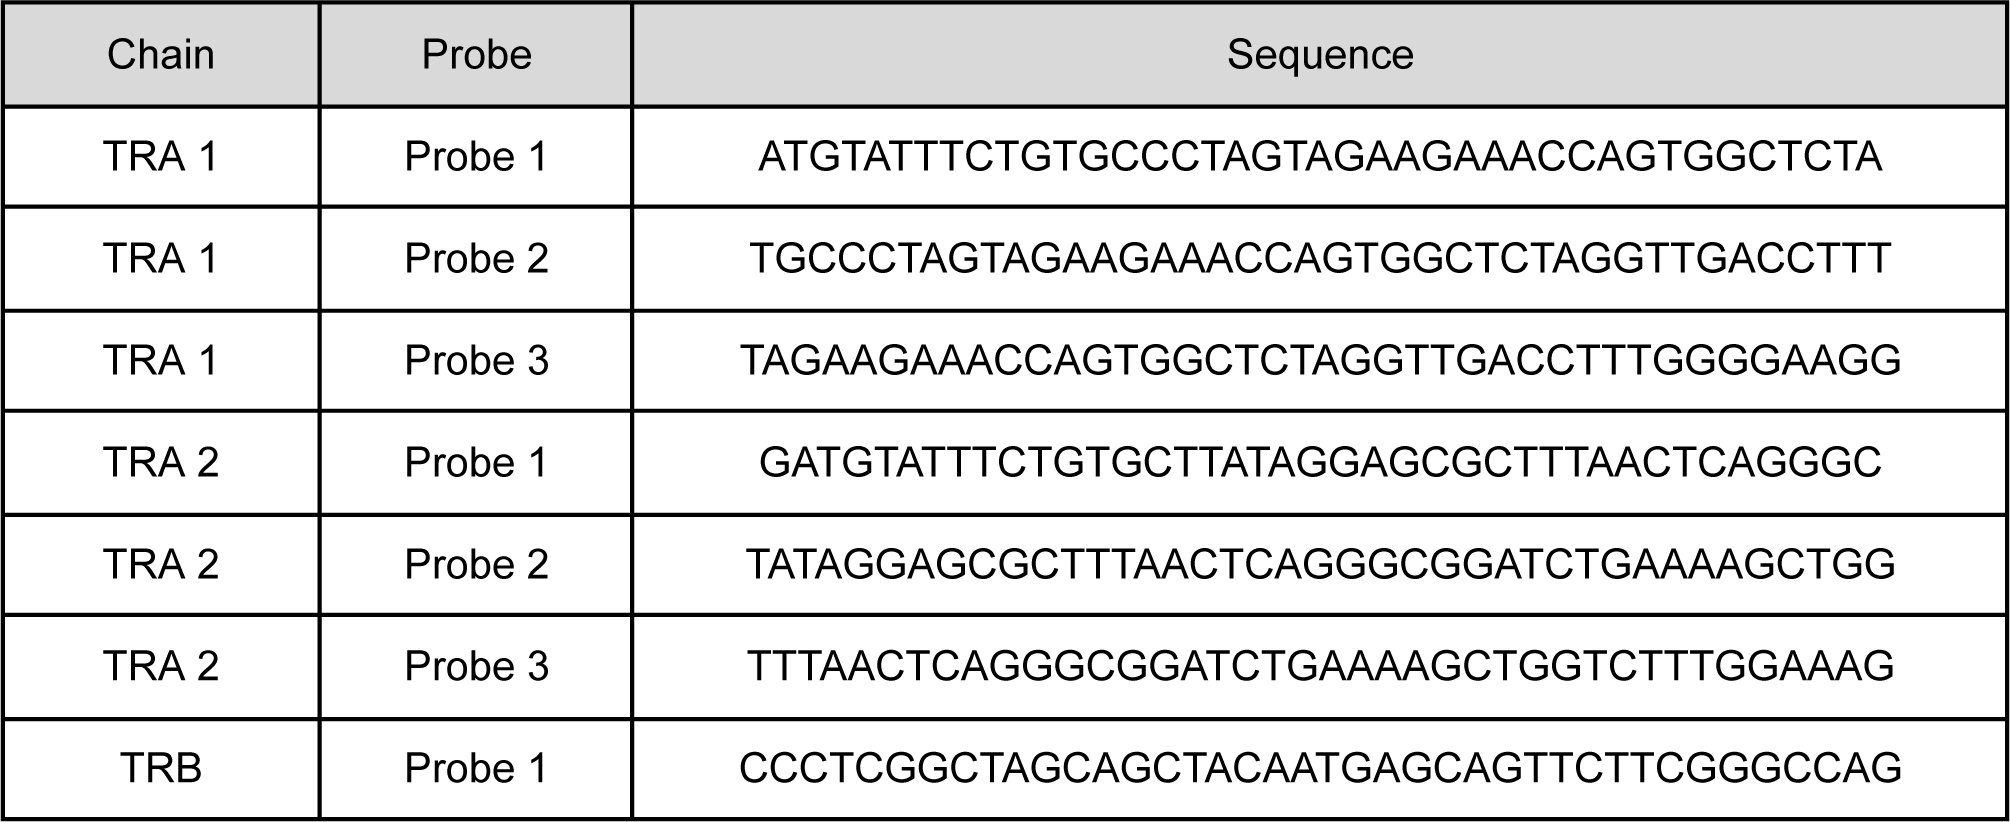
As expanded clonotypes demonstrate an active adaptive immune response, we sought to localize these cells within the tissue to better understand the role they were playing in the TME. We designed probes targeting the CDR3 regions of the two alpha and one beta chains of the overlapping expanded clonotypes and included them in the Xenium custom add-on panel (for probe sequences, see Methods). Xenium analysis showed clusters of clonally expanded T cells residing closely to tumor cells and within gut-associated lymphoid tissues (Figure 7G). Gene expression signatures identified these T cells as CD8^+^ cytotoxic T lymphocytes (expressing CD8A, PRF1, NKG7, GZMA, and GZMK genes) (Figure 7H). Interestingly, these T cells were localized within CXCL9/CXCL10/CXCL11 foci, where STAB1^+^ macrophages, B cells, and endothelial cells are present and contributing to the expression of these chemokines (Figure 7H), known to recruit immune cells to the tumor site^34^. This observation was validated in the corresponding region of the Visium HD data (Figure 7I). TRAC^+^ T cells were identified near CEACAM5^+^ tumor cells, SELENOP^+^/C1QC^+^ macrophages, and JCHAIN^+^ B cells. SELENOP and JCHAIN were not included in the Xenium gene panel but we could include them in our analysis based on the Visium HD data, highlighting the complementary strengths of Xenium and Visium HD technologies.
Discussion
The advent of spatial transcriptomics has enabled a more comprehensive understanding of cellular tissue dynamics in health and disease, and is particularly relevant in the oncology field where the localization of specific cell types in the TME can have prognostic implications. By enabling precise mapping of tumor microenvironments, these technologies reveal the complex spatial relationships and interactions among cells, which are crucial for understanding tumor progression and resistance to therapy. However, existing technologies have limitations related to resolution, tissue compatibility, or ease of use. In this study, we introduced Visium HD, the next generation of the Visium technology, and used it to explore the TME in FFPE colon adenocarcinoma samples.
It has been recognized that the two most important quality parameters of sequencing-based spatial technologies are the sensitivity of mRNA capture per unit area and the spatial accuracy of the mRNA detection^28^. By using a subset of our sample cohort (two NAT and one CRC sample), we demonstrated that Visium HD retained similar gene detection sensitivity when compared to the Visium v2 assay, at a comparable sequencing depth. The improved resolution of the Visium HD array yields a larger number of clusters, identified via unsupervised clustering, that are well aligned with tissue morphology. To assess the spatial robustness of the assay, we quantified the abundance of canonical markers of normal colon epithelial cells in their expected location and adjacent cells, demonstrating that Visium HD has high transcript spatial localization accuracy. Together, these results demonstrate the high sensitivity, resolution, and accuracy of the Visium HD technology.
These features enabled us to perform an in depth analysis of a subset of three FFPE colon adenocarcinoma samples. The unsupervised clustering analysis of these samples allowed us to detect a broad range of cell types within each sample, however, the intra-patient heterogeneity made comparison between samples challenging. To ensure consistency in our cell type annotation and to increase our confidence in cell type calling, we generated a single cell reference dataset containing representative normal and diseased states. We then used this single cell dataset for deconvolution of Visium HD data from all of our samples. We adapted existing deconvolution methods that were designed based on Visium v2 to be performant with the dramatically increased number of ‘spots’ (now bins) that are present in Visium HD. Our analysis shows that per section unsupervised clustering analysis of Visium HD data yields similar cellular annotations for the main cell types found within tissue sections compared to the deconvolution method. While the inclusion of the single cell reference data provides an added benefit for a consistent cellular annotation strategy across multiple samples and identification of rare cell types, it is not a requirement for sample analysis using Visium HD.
The interactions of immune cells in the TME of CRC are poorly understood, hindering the development of new therapies^26^. For example, tumor-associated macrophages (TAMs) have been shown by several studies to exert pro-tumor activity; however, their role in CRC progression and the ability to predict disease outcomes based on macrophage infiltration are controversial. These controversial associations could be due to simultaneous accumulation of M1-like (pro-inflammatory) and M2-like (anti-inflammatory) macrophages and their spatial distribution within the tumor regions, leading to distinct functional activities within the TME^35,36^. It has been hypothesized that undifferentiated tumor cells at the invasion front, where the tumor tissue meets and interacts with the surrounding normal tissue, could polarize macrophages toward the M2-like phenotype (SPP1^+^ macrophages)^26^. Therefore, we wanted to explore the immune cell composition of the area immediately surrounding the tumor, to see what role immune cells were playing. In each sample, we identified distinct tumor cell types that were mapped to the morphological tumor regions in each tissue section, and applied a periphery analysis to interrogate areas within 50 µm of the tumor boundary. We observed a consistent enrichment of CAFs and macrophages in CRC tumor regions across all samples. CAFs are the most abundant non-immune cell types in the vicinity of CRC tumors, and TAMs are known to be the most prevalent immune cell types in the TME, recruited by cytokines released by tumor cells and CAFs. The presence of CAFs and SPP1+ macrophages are known to be highly correlated, and their presence is negatively correlated with lymphocyte infiltration and predict a poor patient survival^37^.
We next sought to understand the functional profiles of the macrophages identified in the tumor regions of our samples. Independent unsupervised clustering analysis of the gene signatures associated with the 8 µm bins labeled as macrophages found in tumor regions revealed two heterogeneous M2-like subpopulations, labeled as SPP1^+^ and SELENOP^+^ macrophages. These populations were specifically enriched within distinct spatial locations of the tumor, across two of the CRC tissue sections evaluated (only SELENOP^+^ macrophages were mapped within tumor regions in sample P5 CRC). SELENOP^+^ macrophages co-localized with tumor cell populations marked by expression of REG family genes, which are known to be highly expressed in CRC and associated with metastasis, advanced tumor stage and poor prognosis^38^. SPP1^+^ macrophages co-localized with tumor cell populations marked by expression of TGFBI, which has been reported to be associated with poorer prognosis^39^. Previous scRNA-seq studies have shown that SPP1^+^ macrophages are enriched in tumor tissue, exerting pro-tumor and pro-metastatic roles^9,26^. They may also regulate CAF through TGFB1, thereby promoting the secretion of MMPs and collagen to remodel the ECM, contributing to the resistance to PD-L1 blocking immunotherapy^37^. Pathway enrichment analysis of the upregulated gene expression profiles from both macrophage subpopulations revealed pathways consistent with pro-tumor activity. However, different pathways were dominant in each subpopulation, indicating that both subpopulations of macrophages identified here may exert pro-tumor effects, but do so by suppressing the immune response and contributing to tumor progression via different mechanisms. The resolution gains afforded by the increased density of the Visium HD arrays provided us with the ability to pinpoint the location of these subpopulations and the tumor cells they are interacting with, providing key insights into their behavior and the cellular dynamics of the TME. This is biologically meaningful because anti-PD-1 therapy is currently only effective for a minority of CRC patients, and disrupting the interactions of SPP1+ macrophages and CAFs has been proposed as a potential therapeutic strategy^26,37^.
The interesting dynamics we observed in the macrophage subpopulations led us to explore the immune cell populations in the tumors further, and we turned our attention to the adaptive immune response, specifically T cells. T cell infiltration into CRC tumors has long been associated with favorable outcomes, suggesting a possible role for immunoediting in controlling tumor growth^40,41^. Our analysis of Visium HD data at 8 µm bin size allowed us to clearly identify T cells in the microenvironment of the tumors we examined. However, we saw fewer T cells than anticipated based on the single cell data. Reanalyzing the data in this region using higher resolution (2 µm bins), enabled us to improve our capacity to identify T cells within the TME, since many were lost due to their small size and colocalization with other cells at 8 µm resolution. The 2 µm analysis also allowed us to improve accuracy, and pinpoint the location of the T cells in the tumor and surrounding areas, but even with this granular view we see that there is only a sparse presence of T cells in the TME. This resolution level flexibility was useful for answering specific biological questions, in this case the smaller bins provide critical insights for the analysis of T cells, but it was not necessary for the analysis of the larger macrophages. We anticipate that in the future more sophisticated analysis methods would be able to take full advantage of the 2 µm resolution data. Development of spatially aware methods that are able to include information from neighboring bins during unsupervised clustering would provide more accurate cell type annotations.
Finally, we wanted to explore the nature of the T cells we identified and better understand their function in the TME. Single cell TCR profiling allowed us to identify an expanded TCR clonotype within the more advanced cancer P5 CRC sample (stage IV-A, Table 1), suggesting an active immune response in this tumor. Using Xenium we mapped, for the first time, the location of clonally expanded T cells within the CRC TME, at single cell resolution. Xenium analysis revealed a co-localization of these clonally expanded T cells with cells expressing CXCL9, CXCL10, and CXCL11 chemokines, which are known to attract cytotoxic T lymphocytes^34^. Consistent with this finding, these expanded T cells expressed cytotoxic genes, including PRF1, GZMA, and GZMK. Notably, macrophages within these regions emerged as the primary source of the CXCL9, CXCL10, and CXCL11 expression, suggesting their contribution to T cell recruitment and potential anti-tumor activity. This finding suggests that despite the overall immunosuppressive environment in the microenvironment of these tumors, there are niches where anti-tumor immune responses may be taking place. This is an important observation as the balance between the pro- and anti-tumor macrophages influences tumor progression and response to therapy. Further research into the plasticity of macrophages and their ability to switch between these states could provide potential targets for therapeutic strategies in cancer treatment^42,43^.
High definition spatial technologies are providing increasingly granular insights into cellular behavior in the TME. Given the poor survival rates of many cancers, identification of better predictive prognostic biomarkers that can be used in clinical strategies are needed. The ability to visualize and analyze tumors using cutting edge spatial technologies not only enhances our comprehension of cancer biology but also guides the development of targeted therapies and has the potential to identify biomarkers that can meet this need. Our results highlight some of the insights that can be gleaned by studying immune cell populations in the TME with high definition, whole transcriptome, spatial technologies and pave the way for future studies that will fill gaps in our understanding of tumor evolution, progression, and provide insights for therapeutic advances.
Supporting information
Supplemental Tables - Oliveira, Romero, Chung et al. 2024. HD spatial profiling of CRC.
Supplemental Material - Oliveira, Romero, Chung et al. 2024. HD spatial profiling of CRC.
The reference list from the paper itself. Each links out to its DOI / PubMed record.
- 1Xi, Y. & Xu, P. Global colorectal cancer burden in 2020 and projections to 2040. Transl. Oncol. 14, 101174 (2021).
- 2Hossain, M. S. et al. Colorectal Cancer: A Review of Carcinogenesis, Global Epidemiology, Current Challenges, Risk Factors, Preventive and Treatment Strategies. Cancers 14, 1732 (2022).
- 3O’Connell, J. B., Maggard, M. A. & Ko, C. Y. Colon Cancer Survival Rates With the New American Joint Committee on Cancer Sixth Edition Staging. JNCI J. Natl. Cancer Inst. 96, 1420–1425 (2004).
- 4Wang, W. et al. Molecular subtyping of colorectal cancer: Recent progress, new challenges and emerging opportunities. Semin. Cancer Biol. 55, 37–52 (2019).
- 5Guinney, J. et al. The consensus molecular subtypes of colorectal cancer. Nat. Med. 21, 1350–1356 (2015).
- 6Singh, M. P., Rai, S., Pandey, A., Singh, N. K. & Srivastava, S. Molecular subtypes of colorectal cancer: An emerging therapeutic opportunity for personalized medicine. Genes Dis. 8, 133–145 (2021).
- 7Sawayama, H., Miyamoto, Y., Ogawa, K., Yoshida, N. & Baba, H. Investigation of colorectal cancer in accordance with consensus molecular subtype classification. Ann. Gastroenterol. Surg. 4, 528–539 (2020).
- 8Wen, R. et al. Single-cell sequencing technology in colorectal cancer: a new technology to disclose the tumor heterogeneity and target precise treatment. Front. Immunol. 14, (2023).