XGBoost-Based Framework for Smoking-Induced Noncommunicable Disease Prediction
Khishigsuren Davagdorj, Van Huy Pham, Nipon Theera-Umpon, Keun Ho Ryu

TL;DR
This paper introduces a new AI framework using XGBoost to predict smoking-related noncommunicable diseases in South Korea and the US, aiming to improve early diagnosis and prevention.
Contribution
The novel contribution is an XGBoost-based framework with a hybrid feature selection method for interpretable SiNCD prediction.
Findings
The proposed model outperforms existing baseline models in predicting smoking-induced noncommunicable diseases.
The framework identifies important features to enhance model interpretability.
The method is applied to data from South Korea and the United States for broader applicability.
Abstract
Smoking-induced noncommunicable diseases (SiNCDs) have become a significant threat to public health and cause of death globally. In the last decade, numerous studies have been proposed using artificial intelligence techniques to predict the risk of developing SiNCDs. However, determining the most significant features and developing interpretable models are rather challenging in such systems. In this study, we propose an efficient extreme gradient boosting (XGBoost) based framework incorporated with the hybrid feature selection (HFS) method for SiNCDs prediction among the general population in South Korea and the United States. Initially, HFS is performed in three stages: (I) significant features are selected by t-test and chi-square test; (II) multicollinearity analysis serves to obtain dissimilar features; (III) final selection of best representative features is done based on least…
Genes, proteins, chemicals, diseases, species, mutations and cell lines named across the full text — each resolved to its canonical identifier and authoritative record.
Click any figure to enlarge with its caption.
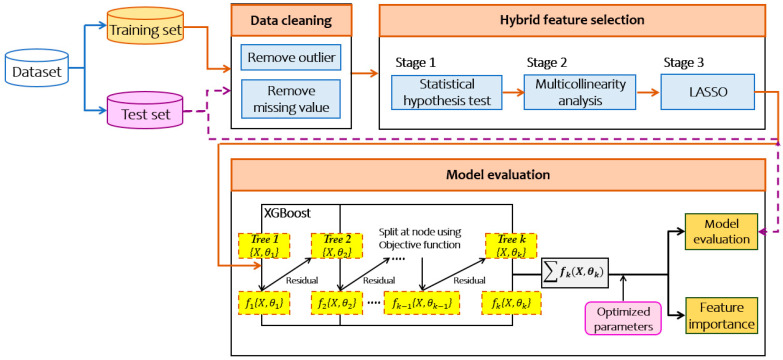 Figure 1
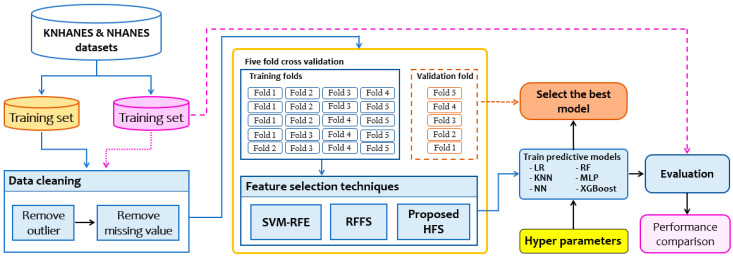 Figure 2
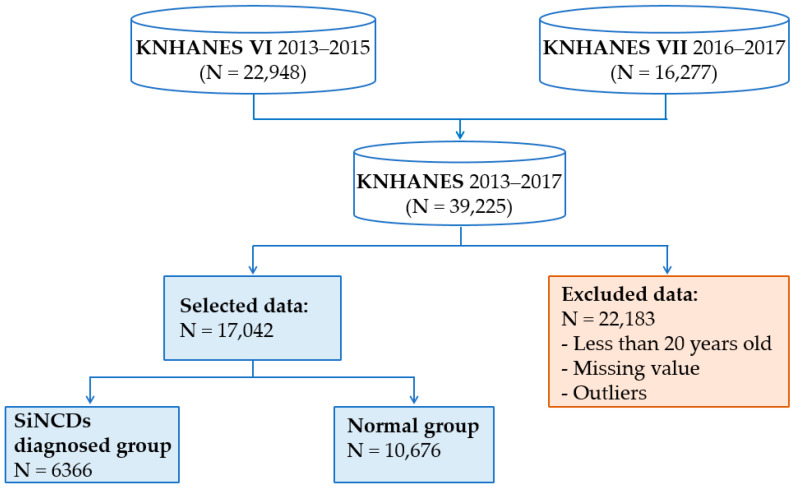 Figure 3
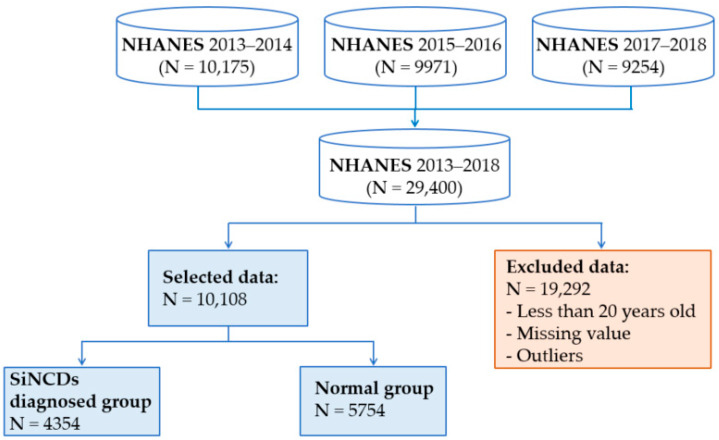 Figure 4
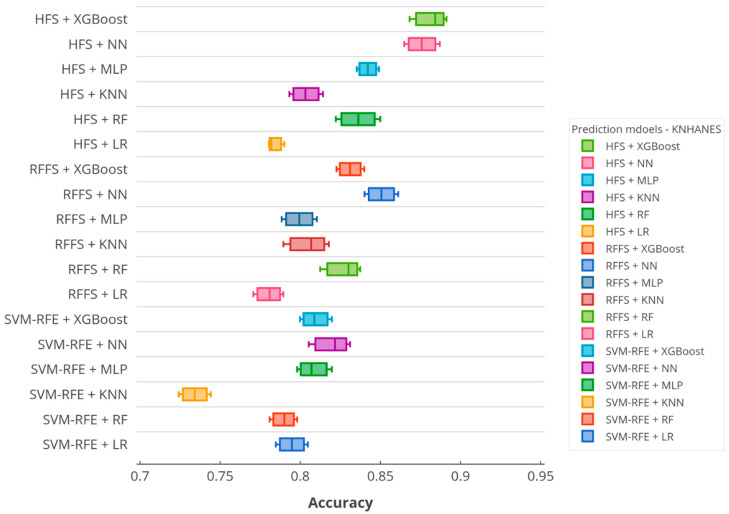 Figure 5
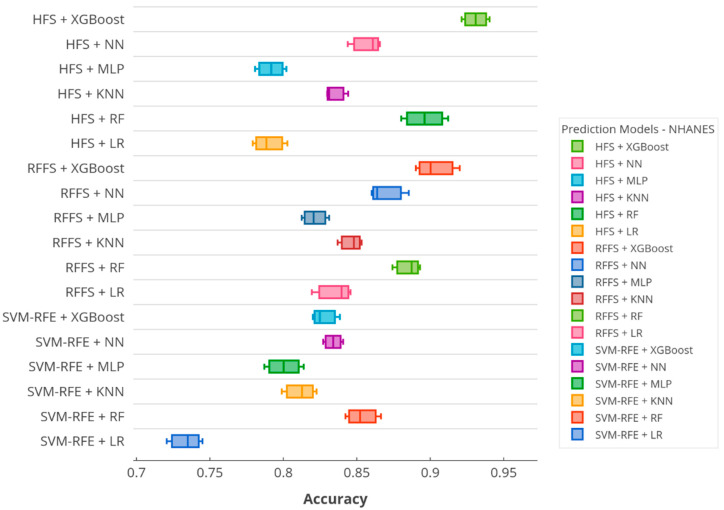 Figure 6
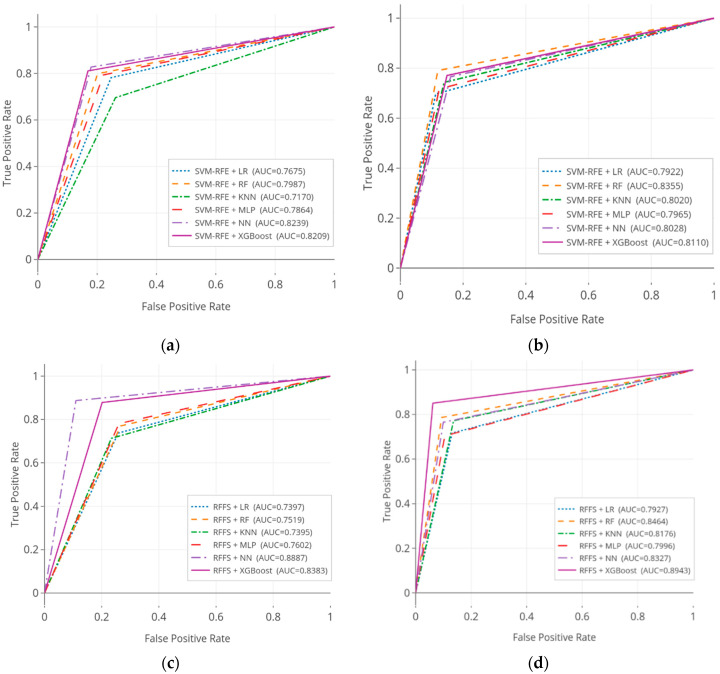 Figure 7
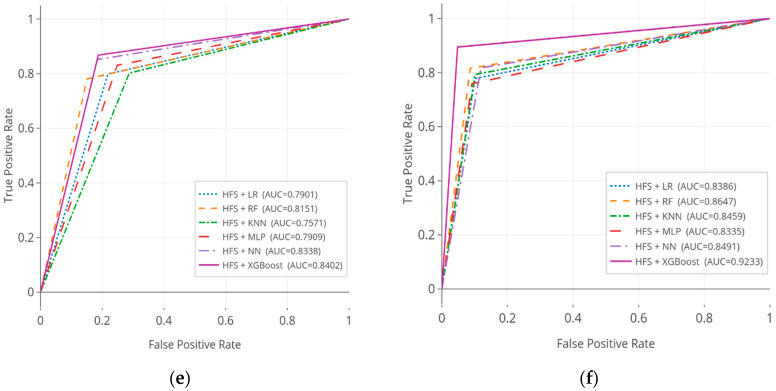 Figure 8
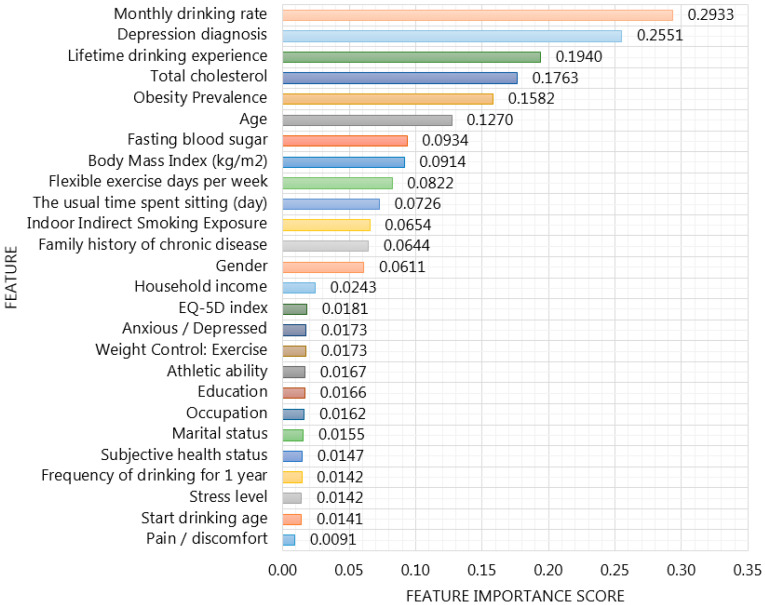 Figure 9
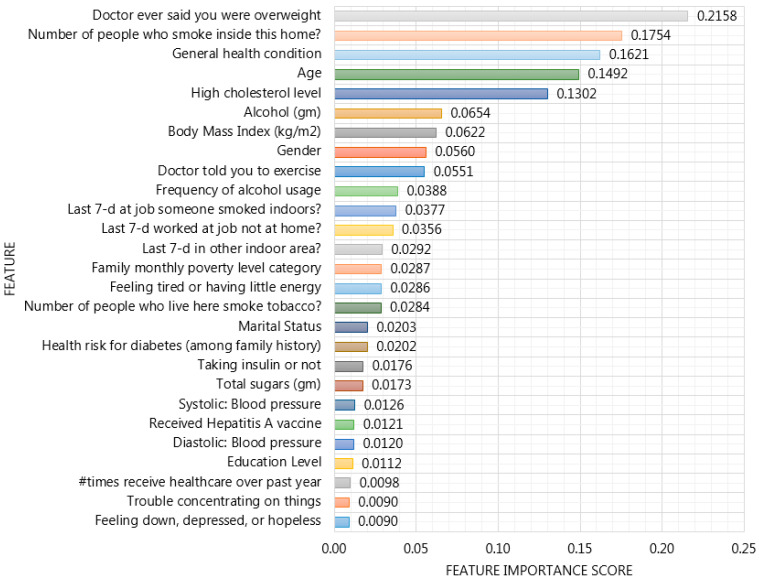 Figure 10
Peer Reviews
No public reviews on file for this paper yet. If you reviewed it on a platform where reviews are public (OpenReview, ICLR, NeurIPS, ICML), you can paste yours below so the community can read it here.
Videos
No videos yet. Explain this paper in a talk, walkthrough, or lecture? Add one.
Taxonomy
TopicsCardiovascular Health and Risk Factors · Cardiovascular Disease and Adiposity · Nutritional Studies and Diet
1. Introduction
Noncommunicable diseases (NCDs) have emerged as a major public health problem in the world. About 40 million people die from NCDs each year, equivalent to 70% of all deaths globally. The major risk factors of developing NCDs consist of tobacco use, physical inactivity, alcohol use, and unhealthy diets [1]. Approximately 80% of all heart disease, stroke, and diabetes would be prevented if these major risk factors were eliminated. Tobacco use is negatively associated with all of the United Nation (UN)’s Sustainable Development Goals (SDGs). In particular, smoking cessation plays an extensive role in a global effort to achieve the SDGs target to reduce deaths from NCDs by one-third by 2030 [2,3]. Studies by public health experts found that smokers were more likely to become infected with outbreaks of Middle East respiratory syndrome coronavirus (MERS-CoV) and corona virus disease (COVID) 19 compared to non-smokers [4,5].
The World Health Organization (WHO) introduced the MPOWER package, corresponding to assist in country-level implementation of interventions to increase smoking cessation, as ratified by the WHO Framework Convention on Tobacco Control (WHO-FCTC). The MPOWER package is part of the WHO action plan for the prevention and control of noncommunicable diseases. South Korea has ratified the WHO-FCTC and, since 2005, has launched anti-smoking clinics at community health centers across the country. However, the prevalence of NCDs continues to remain high, accounting for 81% of all deaths and seven of the top causes of death in South Korea [6]. In recent years, the United States government has aimed to expand its role in addressing the challenges of SiNCDs. NCDs account for 89% of all deaths in the United States, which far exceeds the cases of infectious diseases as considered causes of death [7]. Current smokers who suffer from NCDs need lifelong treatment. One of the main causes of this adverse scenario is the fact that smoking-induced noncommunicable diseases (SiNCDs) is mostly diagnosed in late stages.
Nowadays, predictive models are frequently employed in early diagnosis and forecasting of smoking-associated illnesses and diseases [8,9,10,11,12]. Early detection and efficient treatments are solutions for reducing death rates caused by chronic diseases. In one study [13], the authors studied the association between environmental factors and the development of Crohn’s disease among Japanese. Their results suggest that passive smoking history is associated with the development of Crohn’s disease. Another study [14] evaluated the association between Parkinson’s disease and rural living, farming, pesticide use, and cigarette smoking. The weight of the evidence and meta-analysis showed that there is a causal relationship between the risk of Parkinson’s disease and cigarette smoking, which has been consistently discovered in related literature. In contrast, rural living, well-water consumption, farming and the use of pesticides, herbicides, insecticides, and fungicides were less consistent within Parkinson’s disease. Furthermore, one study [15] focused on the role of feature risk pathways in smoking-induced lung cancer using patient data from the Gene Expression Omnibus database. They optimized the feature sets using the anomaly score and the recursive feature elimination (RFE) method. Then, the support vector machine (SVM) based prediction model was used. Their study concluded that smoking is the main cause of lung cancer; moreover, stress and self-protection mechanisms in a living organism can be identified as complex factors. In another study [16], authors developed an automatic classifier to increase the accuracy of the forced oscillation technique for early diagnosis of smoking-induced respiratory changes. They utilized several machine learning techniques, such as logistic linear classifiers, k nearest neighbor (KNN), neural networks (NN), and SVM. As their result, KNN and SVM classifiers resulted in a further increase in diagnostic accuracy.
Artificial intelligence (AI) utilization of automated diagnosis processes can highlight enhanced rules in the decision support system regarding patient health care. However, there are some difficulties in the selection of representative features and suitable classifier. Numerical studies have proposed selecting features using information gain, gain ratio, and correlation coefficients. However, these techniques do not consider the interactions among the features, and are not suitable for direct application to ensemble generation [17]. Moreover, it is evidently seen that ensemble-based classifiers improve the performance better than that of any single classifier [18]. Otherwise, a sequential ensemble learns to generate a model, and one tries to reduce the bias of the combined estimator and reach close to actual predictions. Thus, new models are learned from the mistakes of previous models by boosting techniques. Tree boosting provides high performance clinical predictive modeling; furthermore, it allows representation of feature importance and ranking [19].
Therefore, we propose efficient extreme gradient boosting (XGBoost) based framework incorporated with the hybrid feature selection (HFS) method for SiNCDs prediction, using real-world National Health and Nutrition Examination Survey (NHANES) datasets of South Korea and the United States. Firstly, HFS is performed in three stages: (I) significant features are selected based on statistical hypothesis tests, such as t-test and chi-square; (II) multicollinearity analysis serves to obtain dissimilar features; followed by (III) final selection of best representative features is done based on least absolute shrinkage and selection operator (LASSO). Then, selected features are fed into the XGBoost predictive model. Finally, our proposed model provides feature importance score based on XGBoost. Therefore, the proposed model is compared and contrasted against several existing baseline models, such as logistic regression (LR), random forest (RF), KNN, multilayer perceptron (MLP), NN, support vector machine recursive feature elimination (SVM-RFE), and RF feature importance (RFFI) feature selection methods. The accuracy, sensitivity, specificity, precision, f-scores, and area under the curve (AUC) analysis are employed to evaluate model performances. The main contributions of this study are as follows:
- Proposing an efficient extreme gradient boosting (XGBoost) based framework incorporated with the hybrid feature selection (HFS) method for smoking–induced noncommunicable diseases (SiNCDs) prediction.
- Applying the XGBoost based framework to real-world NHANES datasets of South Korea and the United States. Our empirical comparison analysis shows that the proposed model outperformed existing baseline models.
- Findings are expected to contribute toward achieving good health and wellbeing (ultimate targets of SDGs of UN).
The remainder of this paper is logically structured as follows: Section 2 introduces the proposed framework—elaborating on its two main components: the three-stage HFS method and a brief introduction of the XGBoost algorithm. Therefore, it includes the experimental setup, regularizing hyperparameters. Section 3 provides discussed datasets, baseline models, and overall experimental results. Finally, the study is concluded in Section 4.
2. Materials Methods
2.1. Proposed Framework
In this paper, we propose an efficient extreme gradient boosting (XGBoost) based framework incorporated with the hybrid feature selection (HFS) method for smoking-induced noncommunicable diseases prediction. From its illustration in Figure 1, the proposed framework comprises of three main components: first, three-stage HFS, and then application of XGBoost to build the model. Finally, it provides the feature importance scores.
2.1.1. Three-Stage HFS
The feature selection to reduce the data dimensionality and keep only the important features is performed in three stages.
Step 1: Statistical Hypothesis Test (t-test and p-value)The first stage excludes redundant and irrelevant features in order to reduce the complexity for training model. For this purpose, it assesses chi-square test for categorical features and t-test for continuous features to accept or reject the alternative hypothesis. After the test, if deemed significant, features are stored for the first stage filtering. Otherwise, such features are excluded.Step 2: Multicollinearity AnalysisThe key assumption behind the multicollinearity analysis [20] is that it indicates the correlation between independent features. The value of variance inflation factor is used to verify multicollinearity in regression analysis. In essence, this step takes the complete set of features and loops through all of them applying the appropriate test.Step 3: Least Absolute Shrinkage and Selection Operator (LASSO)LASSO [21] has been extensively used in both fields of statistics and machine learning. Several studies [22,23] proposed the LASSO method for estimating the causal effect to identify their outcomes. A rational decision is taken to execute the LASSO in order to select a group of features simultaneously for a given task. During the feature selection process, LASSO penalizes the coefficients of the regression features, regularizing some of them to zero. On the contrary, features that still have a non-zero coefficient after the regularizing process remain to be part of the training model. This stage allows us to prevent the predictive of the causal inference problem.
2.1.2. XGBoost Classifier
XGBoost is an efficient and scalable machine learning classifier, which was popularized by Chen and Guestrin in 2016 [24]. Gradient boosting decision tree is the original model of XGBoost, which combines multiple decision trees in boosting way. In general, each new tree is created to reduce the residual of the previous model by the gradient boosting. Residual is designated by the differences between the actual and predicted values. Until the number of decision trees specify threshold, the model has been trained. XGBoost has following the same principle of gradient boosting; it uses the number of boosts, learning rate, subsampling ratio, and maximum tree depth to control overfitting and enhance the better performance. More importantly, XGBoost optimizes the objective of function, size of the tree, and magnitude of the weights, which are controlled by standard regularization parameters. The XGBoost accomplishes superior performance with numerous hyperparameters in specific searching space as summarized in Table 1.
According to the hyperparameters, gamma denotes minimum loss reduction, which requires to make a split for making the partition on a leaf node of the tree. Minimum child weight defines as minimum sum of instance weight, which means if the tree partition step results in a leaf node with the sum of instance weight less than then the tree will discard further partition. Early stop algorithm works for finding the optimal epoch number referring to given other hyperparameters. Finally, XGBoost also offered subsampling techniques and column subsample ratio constructs in each tree. In the final step, grid search is used to regulate the hyperparameters in order to minimize the classification error.
2.2. Experimental Setup
2.2.1. Experimental Environment
In this study, all experiments were performed on computer with 3.20 GHz, Intel Core i5-8250U (Intel Corporation, Santa Clara, CA, USA), and 8 GB Random access memory (RAM) using a Microsoft Windows 10 operating system (Microsoft Corporation, Redmond, WA, USA). Scikit-learn, Statsmodels, Matplotlib, and other libraries [25,26,27,28] of Python were used to develop the proposed and comparative models, respectively.
2.2.2. Baseline Models
We compare the proposed model with the following baseline classifiers and feature selection methods:
Logistic regression (LR) [29] is a widely used statistical method for classification and regression task. LR is used when our target of interest has two possible dichotomy values that is limited to values between 0 and 1.
Random forest (RF) [30] is a parallel structured ensemble tree-based method that utilizes bagging to aggregate multiple decision tree classifiers. Each tree of the RF is trained on bootstrap samples of the training sets, using randomly selected features in the tree generation process; after that, each tree votes for the most popular class. In this study, we have configured the number of estimators in the random forest as 500, 750, 1000, 1250, 1500; moreover, quality of split-measured criteria was selected by “gini” for the Gini impurity and “entropy” for the information gain, respectively.
K-nearest neighbor (KNN) [31] is a supervised machine learning algorithm that can solve the classification task. In the classification phase, instances are classified to the class most frequently occurring amongst the neighbors, measured by the distance function. For the KNN classifier, hyperparameters of weights and number of neighbors were adjusted in this study. The weights set up to “uniform”, where all points in each neighborhood are weighted the same, or “distance” where closer points are more heavily weighted toward the decision. The setting of the neighbor numbers refers to how many neighboring points are to fall inside of one group. Furthermore, we have turned the value of the k number between 3 and 12.
Multilayer perceptron (MLP) and neural network (NN) [32,33]: MLP is the most typical type of neural network application using back propagation for training. Neural networks are inspired by composed of nodes. MLPs consist of at least three layers, such as input, hidden, and output. Nodes in neighboring layers are interconnected, but nodes in the same layer are not. Each connection between neurons is multiplied by the corresponding weight during training. Finally, the output of hidden nodes is estimated by applying an activation function and output layer makes decisions. For the MLP models, we use the one and three hidden layers with five nodes. NN models consist of turning the two to ten hidden layers using two to five nodes, respectively. These models are optimized by Adam. Moreover, we set the learning rate is 0.001 with “sigmoid” activation function.
Support vector machine recursive feature elimination (SVM-RFE) [34] estimate the weights of the features according to the support vectors, then eliminate the necessary features until the specified number of features is reached.
Random forest based feature selection (RFFS) [35] has been found to provide feature importance scores that are successfully utilized in data mining. On the other hand, RF classifier estimates the importance of each features, then naturally ranks them.
3. Experimental Results and Discussion
The comparison of our proposed model with the baseline models is presented in this section. The flowchart of the experimental design is depicted in Figure 2. This study is reported according to the Transparent Reporting of a multivariable prediction model for Individual Prognosis or Diagnosis (TRIPOD) statement [36], shown in Appendix A (Table A1).
Initially, we preprocess the smoking-induced noncommunicable diseases (SiNCDs) datasets to eliminate missing values and outliers. Next, we elect a subset of representative features using feature selection methods. Finally, classifiers are used to build predictive models. Comparison findings would be to reveal a suitable combination of the feature selection methods and classifiers in an efficient predictive model among each dataset.
3.1. Dataset
In this study, the National Health and Nutrition Examination Survey datasets of South Korea (KNHANES) and the United States (NHANES) were used to build the proposed model and other existing baseline models for SiNCDs prediction.
KNHANES data is conducted by the Korea Centers for Disease Control and Prevention (KCDC) (http://knhanes.cdc.go.kr) [37]. It consists of a health examination of various numbers of diseases, health interviews, and nutrition surveys of the Korean population. NHANES is designed to assess the health and nutrition status of the general population in the United States. This nationwide survey is a major program of the National Center for Health Statistics (NCHS) that is part of the Centers for Disease Control and Prevention (CDC) (https://www.cdc.gov/nchs/nhanes) [38]. Generally, this survey examines approximately 5000 people each year across the United States. NHANES consists of demographic, socioeconomic, dietary, and health-related questions. Furthermore, some important features were surveyed from a minor of the population in both of the KNHANES and NHANES, similarly.
We combined KNHANES datasets from 2013 through 2017, and NHANES datasets from 2013 through 2018, as shown in Figure 3 and Figure 4. Datasets contain a large number of missing values and outliers. It is well known that missing values reduce the statistical power and become a cause of the bias in the estimation of parameters. To prevent model complications, we excluded all of the missing values and outliers. The outliers were removed based on the interquartile range. Essentially 22,183 subjects of KNHANES and 19,292 subjects of NHANES were excluded due to missing value, outliers, and class targets, which were stored in given initial features. Additionally, subjects aged 20 years old were considered for our analysis for both KNHANES and NHANES datasets. This study was designed to include target and healthy control groups. Healthy control group was defined by subjects who had never smoked and had not been diagnosed with NCDs. On the other hand, target group was defined by subjects who had a history of one of the NCDs, for diabetes, prediabetes, asthma, heart failure, corona hearth disease, heart attack, stroke, hypertension, kidney failure, or angina, as well as had smoked at least 100 cigarettes in their life.
3.2. The Results of Hybrid Feature Selection (HFS)
At the first stage of HFS, t-test and chi-square statistical hypothesis tests are used to determine the null or alternative hypothesis in order to select significant features. The threshold of 0.01 indicates statistical significance. If the feature is of a numeric type, the significance is tested using t-test, otherwise, for the categorical features, chi-square is used. In the KNHANES dataset, the p-values of “self-management”, “daily activities”, and “economic activity status” features were estimated by 0.16, 0.58, and 0.50, respectively. While p-values of “Pulse regular or irregular?”, “Salt usage level”, and “Description of job/work situation” features were indicated by 0.19, 0.12, and 0.13, respectively. A large p-value (>0.01) indicates weak evidence against the null hypothesis; thus, we exclude these features due to criteria of the first stage of HFS.
Thereafter, we verify to check the collinearity between independent features using multicollinearity in regression analysis after eliminating the non-significant features in the second stage of HFS. Multicollinearity is one of the major concerns in causal inference. This second stage leads to prevent the causality issue that occurs when two or more features are highly correlated. It is challenging for a reliable estimation of the variable coefficients. It is suspected that multicollinearity will present if the variance inflation factor (VIF) lies between 5 and 10 in this study. If the VIF value is greater than those values, it investigates a high correlation among features that remain problematic.
In our analysis of the KNHANES dataset, we did not remove any features in terms of their low VIF values. On the contrary, we removed “annual household income” and “poor appetite or overeating” features that represented VIF values of 5.312 and 5.005 in the NHANES dataset. The detailed results of the bivariate and multicollinearity analysis of the KNHANES dataset in Table A2 and NHANES dataset in Table A3 are shown in Appendix B.
In the third stage of HFS, the least absolute shrinkage and selection operator (LASSO) helps to increase the prediction of the models by removing irrelevant features that are not related to target classes. The LASSO identified irrelevant features, such as “residence area”, “walk duration (hours)”, and “health checkup status” in KNHANES dataset, whereas, “ever told doctor had trouble sleeping?” and “number of healthcare counseling over the past year” in NHANES dataset. Thus, these irrelevant features were eliminated by assigning them a coefficient equal to zero. In terms of the three-stage HFS method, we selected sufficiently representative 26 of 32 features in KNHANES and 28 of 35 features in NHANES. Moreover, these are used as inputs to the predictive model.
3.3. The Results of the Comparative Analysis
To prove the efficient XGBoost based framework equipped with the HFS method for SiNCDs, it is compared with other current techniques, including LR, RF, KNN, MLP, NN, and XGBoost incorporated with HFS, SVM-RFE, and RFFS methods in terms of KNHANES and NHANES datasets.
In this study, the entire process of parameter estimation in most baseline models are utilized based on the research paper [39]. For evaluating the prediction models, we split the data into 80% for the training set and 20% for the evaluation set. In order to prevent overfitting, a 5-fold cross-validation procedure [40] is applied to the training set. In the procedure of 5-fold cross-validation, the dataset is randomly partitioned into five parts: 4 folds of the training set are used to train classification models, and the remaining 1 fold is used to validate the model. To evaluate the performance of the predictive models, the classification accuracy, sensitivity, specificity, precision, f-score, and area under the receiver operating characteristic curve (AUC) [41,42] were used.
Table 2 shows the performances of all predictive models in the KNHANES dataset and highest performance of evaluation metrics are marked in bold. For KNHANES dataset, XGBoost with HFS model achieved the highest accuracy of 0.8812 precision of 0.8737 and F-score of 0.8707. NN with RFFS models outperformed the best sensitivity of 0.8871 and specificity of 0.8902. Following by it, the second-best accuracy of 0.8758 and precision of 0.8691 were achieved by NN with HFS model, a specificity of 0.8496 is reached by RF with HFS, and sensitivity of 0.8782 and F-score of 0.8703 was reached by XGBoost with RFFS in the prediction of SiNCDs. As can be seen, KNN with SVM-RFE based predictive model performed slightly lower results compared with other predictive models in terms of the evaluation metrics.
As shown in Table 3, we have summarized results of the predictive model in the NHANES dataset and highest performance of evaluation metrics are marked in bold. For the NHANES dataset, the best model was distinguished by our proposed XGBoost with HFS in terms of the accuracy, sensitivity, specificity, precision, and F-score, which reached 0.9309, 0.8944, 0.9522, 0.8874, and 0.8909, respectively. Moreover, second-best performances were yielded by the XGBoost with RFFS, which achieved the accuracy of 0.9029, sensitivity of 0.8507, specificity of 0.9379, precision of 0.8264, and f-score of 0.8384. Otherwise, it can be seen that the XGBoost classifier exhibited the best capability of probability prediction results incorporating different feature selection methods, significantly.
On the contrary, SVM-RFE method achieved the lowest prediction performances compared with the other feature selection method; therefore, that SVM-RFE method is not suitable for SiNCDs predictive models. Besides, the RFFS method performed computable results with the proposed HFS method in our prediction task. It is well known that accuracy is the most appropriate metric for evaluating predictive models.
According to the accuracy score, Figure 5 and Figure 6 illustrate the boxplots of the prediction models in the KNHANES and NHANES datasets. In the figures, x-axis denotes the accuracy scores and y-axis presents the utilized predictive models on SiNCDs. As depicted in Figure 5, the proposed XGBoost based framework equipped with HFS presented the highest score in the KNHANES dataset. Thereafter, NN with HFS showed the second-highest score, otherwise, the HFS method was capable of predicting the target in this task. By contrast, KNN with SVM-RFE and RFFS with RF models reached the worst scores of 0.7342 and 0.7804, respectively. Furthermore, the proposed XGBoost with the HFS model also achieved the highest score in the NHANES dataset as represented in Figure 6. Interestingly, the worst scores of 0.7349 and 0.7903 were exhibited by the LR with SVM-RFE and LR with HFS, respectively. In the NHANES dataset, the LR baseline classifier determined the worst predictive model, but results slightly improved when this classifier was combined with RFFS.
Table 4 shows the AUC analysis results of the predictive models in the KNHANES and NHANES datasets; results were verified by statistical significance test. It is evidently seen that, in terms of AUC, predictive models were statistically significant. A careful look at the results of KNHANES dataset, the highest performance of 0.8887 (95% CI, 0.8659–0.9005) was scored by NN with RFFS, following by 0.8402 (95% CI, 0.8384–0.8635) was achieved by our proposed XGBoost with the HFS model. Whilst SVM-RFE with the KNN model performed the lowest performance of 0.7170 (95% CI, 0.7094–0.7390) in this analysis. For the NHANES dataset, the proposed model indicated the better performances of 0.9233 (95% CI, 0.9073–0.9345) than other benchmark baselines. Moreover, XGBoost with the RFFS model achieved the second-best performance of 0.8943 (95% CI, 0.8757–0.9013), followed by HFS with RF of 0.8647 (95% CI, 0.8564–0.8859), significantly. These results provided evidence that our ensemble models evaluated the better performances among other baseline models in the NHANES dataset.
Figure 7 illustrates the ROC curves for the SiNCDs predictive models on the three kinds of feature selection methods across KNHANES and NHANES datasets. In ROC curves analysis, we can demonstrate the separation and discrimination ability of the predictive models. The ROC curve was plotted with the measurements of true positive rate (sensitivity) along with the y-axis, and false positive (1-specificity) along with the x-axis. For the KNHANES dataset, ROC curves of NN and XGBoost classifiers represented high results across SVM-RFE based models. RFFS based NN and XGBoost models indicated notably higher results compared with RFFS based models, significantly. Moreover, the three-stage HFS method based classifiers showed fluently good results among other baselines. ROC curve analysis of the NHANES dataset, the RF, and XGBoost classifiers incorporated with SVM-RFE had higher results across other SVM-RFE based models. Moreover, it can be seen that the proposed HFS based XGBoost model emerged as being a good combination model, as it can reach notable significant results than the other HFS and RFFS based baseline models.
The results of the KNHANES dataset reported in Table 4 and Figure 6 indicate the enhanced performances of not only the XGBoost classifier, but also the RFFS based NN considered as a computable model during the comparison task.
3.4. Interpretability of Predictive Model
Prediction performance concerns the ability of the best predictive model to make correct decisions. Meanwhile, predictive model interpretability concerns the understanding of model decisions by humans. Interpretability methods can be categorized into three types: explain data, build an inherently interpretable model (in modeling), and allow to explain it after building the models [43]. In practice, there have been some needs for using machine learning models to ensure which factors are used to make key decisions with boosted trees [44]. Model inherent interpretability is important to get a reasoning behind the predictive models. However, model interpretability tends to be ignored in previous studies [15,16].
Our proposed XGBoost based framework incorporated with HFS provides important features in order to enhance the interpretability of SiNCDs prediction model across KNHANES and NHANES datasets as depicted in Figure 8 and Figure 9. To ensure model interpretability, features were sorted in descending order of their importance scores in XGBoost based model construction in each dataset. For the KNHANES dataset, “monthly drinking rate”, “depression diagnosis”, “lifetime drinking experience”, and “total cholesterol“ were maintained as the most useful features, with importance scores of 0.2933, 0.2551, 0.1940, and 0.1763 to predict SiNCDs among the Korean population, as shown in Figure 8. While with the NHANES dataset analysis, it is evidently shown that “doctor ever said you were overweight”, “the number of people who smoke inside this home”, “general health condition”, and “age” were determined as the most important scores with 0.2158, 0.1754, 0.1621, and 0.1492, respectively, across the general population in the United States, as presented in Figure 9.
Accordingly, alcohol drinking frequency and consumption mostly occurred as highly scored features in the Korean population. Moreover, studies [45,46] found a similar factor for NCDs across Thailand and Korea, although, SiNCDs of Korea and the United States were eminently caused by overweight, cholesterol levels, and obesity, similarly. This result is similar to that study [47], where high rates of overweight and obesity increased the burden of type 2 diabetes, coronary heart disease, and stroke in most countries in the Middle East. According to Kinra et al. [48], the risks for severe illness from NCDs increased with older adults in 1600 villages from 18 states in India. Moreover, they identified that lower socioeconomic status is associated with smoking, alcohol use, low intake of fruit (vegetables), and underweight, whereas, higher socioeconomic status is associated with greater exposure to obesity, dyslipidemia, diabetes in men, and hypertension in women. In particular, authors highlighted that the prevalence of cigarette smoking among men and obesity among women was significantly higher in rural India. Dan et al. [49] examined the main (and interaction) effects of age, gender, body mass index (BMI), and dietary intake among Korean hypertensive patients. Their analysis has found that BMI, energy intake, and cholesterol intake decreased in the older-aged group compared to the middle-aged group. In addition, their findings interpreted that both genders considered weight and dietary management for reducing the incidence of hypertension. In one study, Maimela et al. [50] determined the prevalence of risk factors of NCDs among rural communities in the Limpopo Province of South Africa. Their results defined that tobacco prevalence, alcohol consumption, and being overweight has consistently higher association with NCDs among adults.
Otherwise, most of the notable risk factors for NCDs in each dataset were represented as modifiable. It is well known that modifiable risk factors are behaviors and exposures that are highly associated with the risk of developing various diseases. In order to prevent and correct these modifiable risk factors, it required actions, such as smoking cessation, alcohol reduction, and exercise in public health. The highly scored features enhance rational decisions in smoking-related health concerns and should be collected in SiNCDs prediction data. In addition, this analysis is expected to compare the similarities and differences between populations of two different countries for SiNCDs prediction.
4. Conclusions
In this study, we proposed extreme gradient boosting (XGBoost) based framework incorporated with a hybrid feature selection (HFS) method for SiNCDs prediction, using real-world National Health and Nutrition Examination Survey (NHANES) datasets of South Korea and the United States. The proposed framework consisted of three main steps: first, a three-stage hybrid feature selection method to select important features, then built the XGBoost predictive model to accomplish the task of predicting SiNCDs, and, finally, the framework provided the XGBoost based feature importance scores to enhance the understanding of the reasoning behind the predictive models. The model under the proposed framework was compared against various existing baselines and it has shown superior performance in terms of accuracy measures across each dataset. We also determined the most representative features for SiNCDs in the general populations of South Korea and the United States. Although the study has successfully demonstrated that smoking induced serious health hazards, it has certain limitations in terms of interpretability of deep learning, known as the black-box. In the future, this study can be extended by addressing the problem of global and local interpretability of black-box models and causal effect in the scenario of predictive models.
The reference list from the paper itself. Each links out to its DOI / PubMed record.
- 1Forouzanfar M.H.Afshin A.Alexander L.T.Anderson H.R.Bhutta Z.A.Biryukov S.Cohen A.J.Global, regional, and national comparative risk assessment of 79 behavioural, environmental and occupational, and metabolic risks or clusters of risks, 1990–2015: A systematic analysis for the Global Burden of Disease Study 2015 Lancet 20163881659172410.1016/S 0140-6736(16)31679-827733284 PMC 5388856 · doi ↗ · pubmed ↗
- 2Kathirvel S.Sustainable development goals and noncommunicable diseases: Roadmap till 2030–A plenary session of world noncommunicable diseases congress 2017 Int. J. Noncommunicable Dis.20183310.4103/jncd.jncd_1_18 · doi ↗
- 3World Health Organization Action plan for the prevention and control of noncommunicable diseases in the WHO European Region Proceedings of the Regional Committee for Europe 66th Session Copenhagen, Denmark 12–15 September 2016
- 4Vardavas C.I.Nikitara K.COVID-19 and smoking: A systematic review of the evidence Tob. Induc. Dis.20201810.18332/tid/11932432206052 PMC 7083240 · doi ↗ · pubmed ↗
- 5Berlin I.Thomas D.Le Faou A.L.Cornuz J.COVID-19 and smoking Nicotine Tob. Res.202010.1093/ntr/ntaa 05932242236 PMC 7184428 · doi ↗ · pubmed ↗
- 6Yoon J.Seo H.Oh I.H.Yoon S.J.The non-communicable disease burden in Korea: Findings from the 2012 Korean Burden of Disease Study J. Korean Med Sci.201631 Suppl. 2S 158S 16710.3346/jkms.2016.31.S 2.S 15827775253 PMC 5081297 · doi ↗ · pubmed ↗
- 7Chen S.Kuhn M.Prettner K.Bloom D.E.The macroeconomic burden of noncommunicable diseases in the United States: Estimates and projections P Lo S ONE 201813 e 020670210.1371/journal.pone.020670230383802 PMC 6211719 · doi ↗ · pubmed ↗
- 8Hu X.Wang Y.Huang J.Zheng R.Cigarette Affordability and Cigarette Consumption among Adult and Elderly Chinese Smokers: Evidence from A Longitudinal Study Int. J. Environ. Res. Public Health 201916483210.3390/ijerph 16234832 PMC 692700531805685 · doi ↗ · pubmed ↗