Modeling Spatiotemporal Pattern of Depressive Symptoms Caused by COVID-19 Using Social Media Data Mining
Diya Li, Harshita Chaudhary, Zhe Zhang

TL;DR
This paper uses social media data to track how stress and depressive symptoms related to COVID-19 changed over time and location in the U.S.
Contribution
The CorExQ9 algorithm combines CorEx learning and PHQ lexicon to detect spatiotemporal patterns of stress symptoms from social media data.
Findings
Stress symptoms strongly correlate with the number of increased COVID-19 cases in major U.S. cities.
People's risk perception is sensitive to public news and media messages about the virus.
Initial fear of infection shifted to financial worries as the pandemic progressed.
Abstract
By 29 May 2020, the coronavirus disease (COVID-19) caused by SARS-CoV-2 had spread to 188 countries, infecting more than 5.9 million people, and causing 361,249 deaths. Governments issued travel restrictions, gatherings of institutions were cancelled, and citizens were ordered to socially distance themselves in an effort to limit the spread of the virus. Fear of being infected by the virus and panic over job losses and missed education opportunities have increased people’s stress levels. Psychological studies using traditional surveys are time-consuming and contain cognitive and sampling biases, and therefore cannot be used to build large datasets for a real-time depression analysis. In this article, we propose a CorExQ9 algorithm that integrates a Correlation Explanation (CorEx) learning algorithm and clinical Patient Health Questionnaire (PHQ) lexicon to detect COVID-19 related stress…
Genes, proteins, chemicals, diseases, species, mutations and cell lines named across the full text — each resolved to its canonical identifier and authoritative record.
Click any figure to enlarge with its caption.
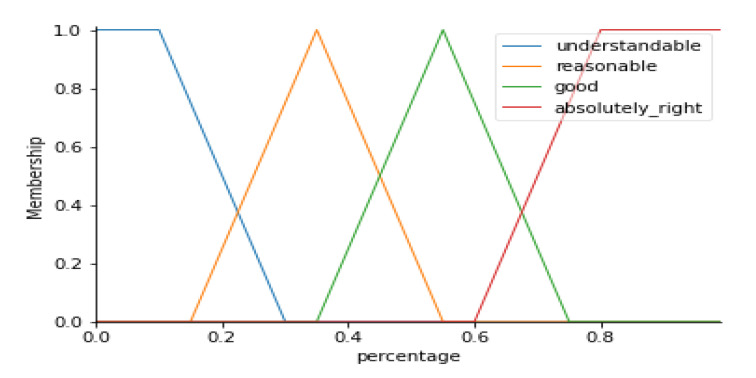 Figure 1
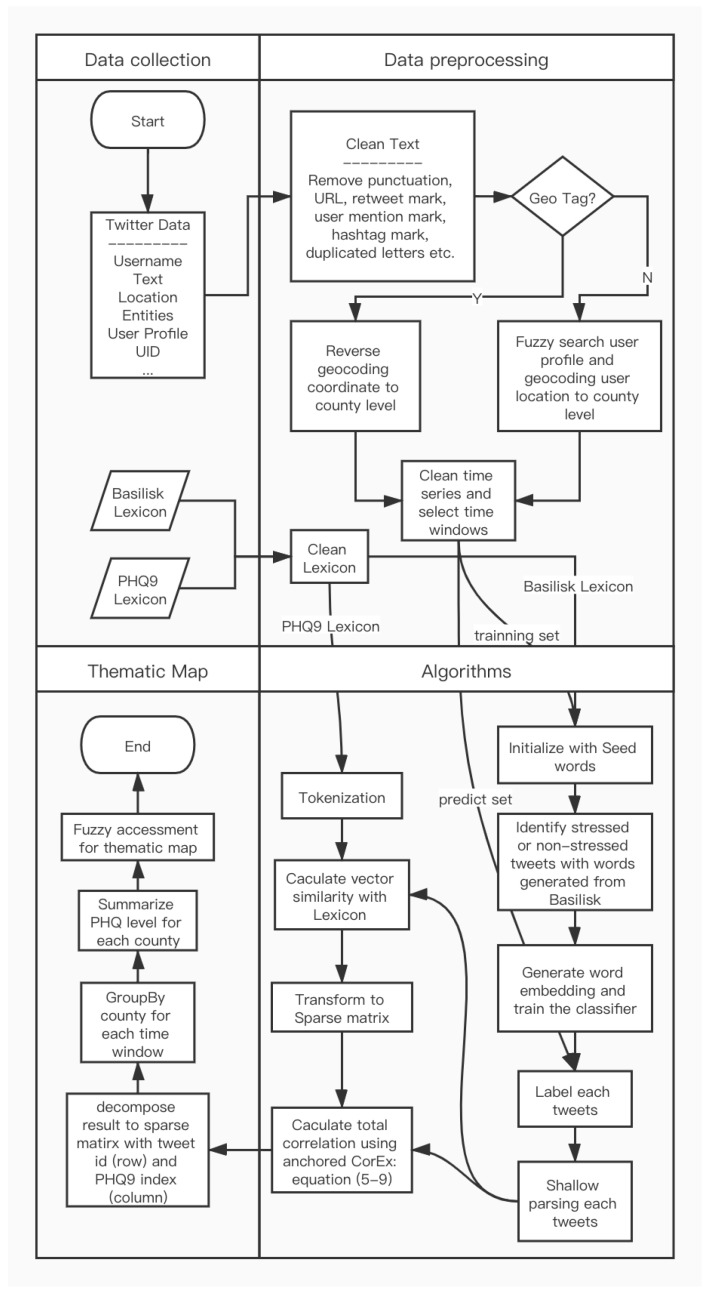 Figure 2
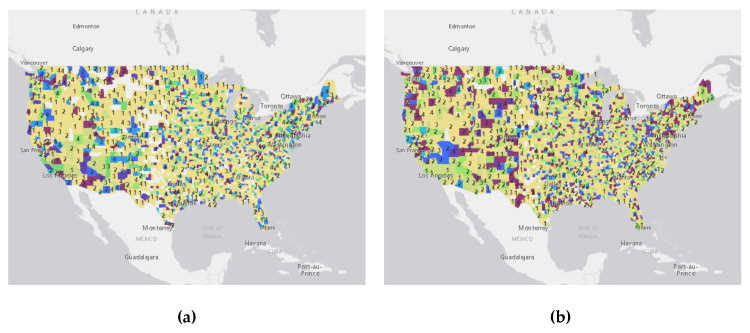 Figure 3
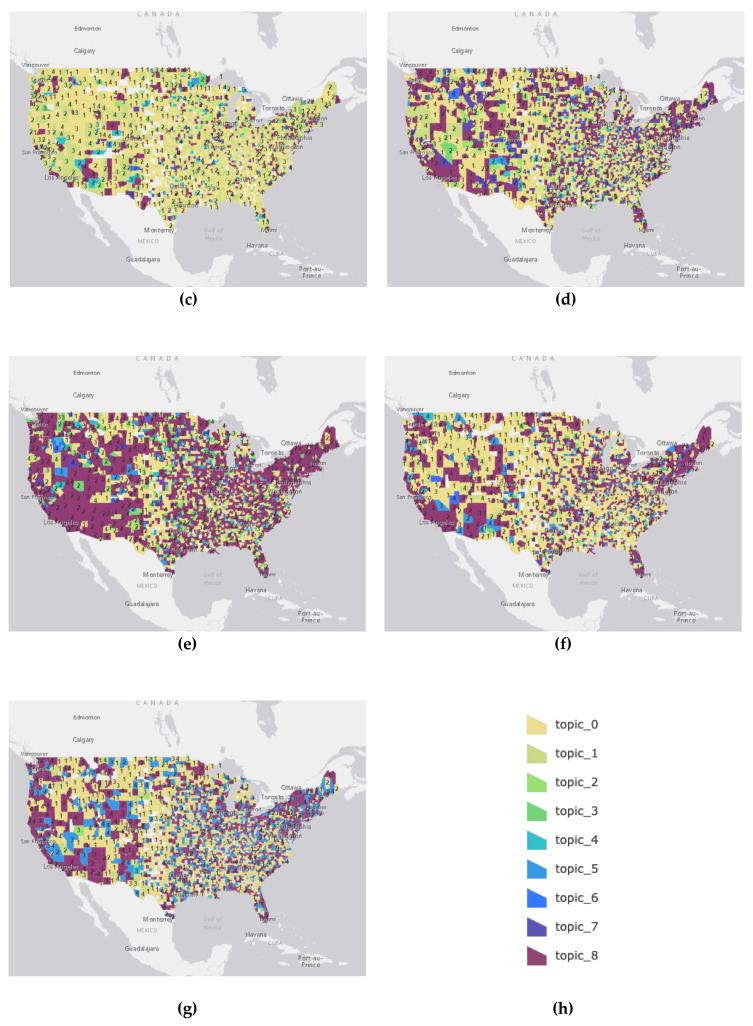 Figure 4
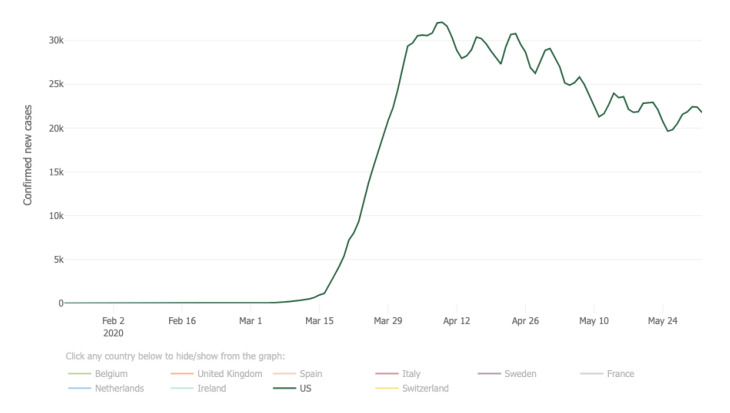 Figure 5
Peer Reviews
No public reviews on file for this paper yet. If you reviewed it on a platform where reviews are public (OpenReview, ICLR, NeurIPS, ICML), you can paste yours below so the community can read it here.
Videos
No videos yet. Explain this paper in a talk, walkthrough, or lecture? Add one.
Taxonomy
TopicsMental Health via Writing · Sentiment Analysis and Opinion Mining · Computational and Text Analysis Methods
1. Introduction
In December 2019, an outbreak of pneumonia caused by a novel coronavirus (COVID-19) occurred in Wuhan and spread rapidly throughout the globe [1]. The COVID-19 outbreak has forced people to change their regular routine lives and practice social distancing. Such a sudden change can drastically increase people’s stress level and lead to other mental health issues. The difficulties caused by the COVID-19 outbreak in different geographic regions can determine the cause and degree of stress in people, which corresponds to their risk of developing serious depression [2]. According to a poll [3], nearly half (45%) of adults in the United States reported that their mental health has been negatively impacted due to worry and stress over the virus. As the pandemic continues, it is likely that the mental health burden will increase as people’s sense of normalcy continues to be disrupted by social distancing, business and school closures, and shelter-in-place orders. The preexisting stress, constant unpredictability, and lack of resources lead to even greater isolation and financial distress.
Traditional mental health studies rely on information primarily collected through personal contact with a healthcare professional or through survey-based methods (e.g., via phone or online questionnaire). For instance, the Patient Health Questionnaire (PHQ) is a self-administered version of the Primary Care Evaluation of Mental Disorders (PRIME-MD) diagnostic instrument for common mental disorders [4]. However, these survey-based methods are time-consuming and suffer from cognitive and sampling biases, and therefore cannot be used to build large datasets for a real-time depression analysis [5]. Furthermore, understanding of spatial epidemic trends and geographic distribution patterns of COVID-19 provides timely information on people’s risk perception of epidemics. However, these important spatial and environmental leading factors are difficult to include in a survey-based method to model COVID-19 related mental stress.
Geographic Information System (GIS) and social media data mining have become essential tools with which to examine the spatial distribution of infectious diseases [6,7,8], and can be used to investigate the spatiotemporal pattern of mental stress caused by the pandemic. For instance, social media data (e.g., Twitter data) provide a unique opportunity to learn about the users’ moods, feelings, and behaviors that reflect their mental health as they experience daily struggles [8,9,10]. Many articles focused on using feature-based approaches to perform sentiment and emotional analysis using Twitter data [11,12,13,14]. For instance, Go and colleagues [11] investigated the usage of unigrams, bigrams, and their combination in training the classifiers for sentiment analysis of tweets. Various supervised classifiers were trained, including maximum entropy, naïve Bayes [15], and support vector machine (SVM) classifiers and their performance on the n-grams was compared. However, some methods previously used [11] have become outdated; for instance, they took emoticons into account for their sentiment index, but nowadays lots of Twitter users use emojis more frequently [16]. Barbosa and Feng [17] showed that n-grams are not useful in classifying tweets, as unused words in tweets can cause problems during classifier training. Pak and Paroubek [18] proposed the usage of microblogging features like hashtags, emoticons, re-tweets, and comments to train an SVM classifier and showed that it resulted in higher accuracy than training using n-grams. Several articles address the effect of using Part-Of-Search (POS) tag features in text classifiers [18,19]. Abadi and colleagues [19] investigated POS, lexicon, and microblogging features. The results showed that the most relevant features are those that combine prior polarity with the POS tags of the words. However, there have been mixed results reported on the usage of POS tags. Go and colleagues [11] showed that the POS tags caused reduced performance, although POS tags can be strong indicators of emotions in text and serve as a helpful feature in opinion or sentiment analysis [18]. Moreover, bootstrapping approaches, which rely on a seed list of opinion or emotion words to find other such words in a large corpus, are becoming more popular and have proven effective [20,21,22,23]. Mihalcea, Banea, and Wiebe [23] described two types of methods for bootstrapping the subjectivity lexicons into dictionary-based and corpus-based. Their research began with a small seed set of hand-picked subjective words, and with the help of an online dictionary produced a larger lexicon of potential candidate words. A similar bootstrapping model was effectively used to build a sentiment analysis system for extracting user-generated health review about drugs and medication [20]. However, all the aforementioned methods only detect the general emotion of tweets and lack the ability to model depression levels in detail.
Latent Dirichlet allocation (LDA) is one of the most commonly used unsupervised topical methods, where a topic is a distribution of co-occurring words [24]. However, the topics learned by LDA are not specific enough to correspond to depressive symptoms and human judgments [25]. The unsupervised method can work with unclassified text, but it often causes topics overlap [26]. Later, the LDA method was extended by using terms strongly related to PHQ-9 depression symptoms as seeds of the topical clusters and guided the model to aggregate semantically-related terms into the same cluster [27]. However, this approach only detects the presence, duration, and frequency of stress symptoms, ignoring the spatial context or environmental factors that are important in modeling the COVID-19 related mental stress. To identify PHQ related text and unrelated text, a sentiment analysis index generated by Python TextBlob was used [27], which only calculates the average polarity and subjectivity over each word in a given text using a constant dictionary [28,29]. Work based on the LDA probabilistic generative model was found to have limitations related to interpreting high dimensional human input factors which makes it difficult to generalize generative models without detailed and realistic assumptions for the data generation process [30,31,32].
In this article, we propose a CorExQ9 algorithm that integrates Correlation Explanation (CorEx) learning algorithm and clinical PHQ lexicon to detect COVID-19 related stress symptoms at a spatiotemporal scale in the United States. We aim to investigate people’s stress symptoms in different geographic regions caused by the development of the COVID-19 spread. Since Twitter data are high-dimensional human input data with diverse terms used to express emotions, we used the CorEx algorithm, a method intended to bypass the limitations of LDA implementation and minimize human intervention [33]. After that, we developed a fuzzy accuracy assessment model to visualize the uncertainty of the analytical results on the map.
The rest of the article is organized as follows: Section 2 introduces the material and methods used in the research work including the introduction of data collection and processing methods, Basilisk and machine learning classifier, and the proposed CorExQ9 algorithm. The results and discussion are presented in Section 3 and Section 4, respectively. Section 5 draws conclusions.
2. Material and Methods
2.1. Data Collection and Preprocessing
Twitter data used in this article were collected through the Twitter API from January to April 2020 for the continental United States. The collected data contained 80 million tweets (~70 GB), which posed significant computationally intensive challenges for the traditional GIS computing environment. To address this challenge, we used a Jupyter computing environment deployed on the Texas A&M High Performance Computer. We filtered the collected Twitter data using coronavirus related entities (e.g., hashtag, trends, and news). Then, we removed irrelevant information (e.g., non-English language Tweets, punctuation, missing data, messy code, URL, username, hashtags, numbers, and query terms) from the filtered tweets. Some adjustments and normalizations (e.g., uniform lower case, nonmaize vectorized tweets, standardize time sliced tweets) were also made in order to fulfill the common requirements of machine learning models. However, the stop words were removed later when applying the proposed algorithm to match the tweet phrase with lexicon. After that, the tweets were tokenized using the Natural Language Toolkit’s (NLTK) TweetTokenizer [33]. We also replaced repeated character sequences by using the length value of three for any sequences of length three or greater (3+), since most users often extend words or add redundant characters to express strong feelings. Tweets with an exact geospatial tag and timestamp were mapped to the corresponding county using reverse geocoding method [34,35]. Other tweets (e.g., without geotags but containing user-defined location information in the user’s profile) were geocoded to their corresponding county using a fuzzy set search method and city alias dataset [36]. We excluded tweets that did not have geotags nor user-defined location information. One of the key innovations in our research was to map the COVID-19 caused stress symptoms at a temporal scale. In this case, we set the temporal scale to biweekly starting from 26 January 2020, so the number of tweets collected in each county could be sufficient for accurate and reliable analysis.
2.2. Analytical Approach
2.2.1. Bootstrapping the Initial Keywords
We used the Basilisk bootstrapping algorithm to find semantic lexicons that could be used to divide the tweets into two categories: stressed and non-stressed. The bootstrapping approach to semantic lexicon induction using semantic knowledge, also known as the Basilisk algorithm, was developed by Thelen and Riloff in 2002 [37]. This approach can extend to divide the tweets into multiple categories across different areas [22]. It employs a bootstrapping method to determine high-quality semantic lexicons of nouns. The algorithm takes a huge unannotated corpus from where it finds new related words and assigns them to the different semantic categories (e.g., stressed and non-stressed in our case). It is a form of categorization that is based on the seed words manually provided to the algorithm. These seed words are bootstrapped to identify new words that fall within the two categories.
Basilisk must be seeded with carefully selected terms for it to be effective. The two categories of seeds used for this task consisted of 20 words each (Table 1) [38]. The first category contained words describing stress and were used to bootstrap other words semantically related to stress or carrying a similar context. The second category contains words that describe non-stressed or a relaxing behavior. These two categories can be thought of as words that fall at the opposite ends of a stress level spectrum.
Before the bootstrapping process, the patterns were extracted on the unannotated corpus. This is used to extract all the noun phrases that were either the subject, direct object or prepositional phrase. The noun phrases were extracted from the corpus using the Stanford Dependency Parser [39]. It is a natural language parsing program used to find grammatical structure in sentences and can be used to find relationships or dependencies between nouns and the actions or words that form a group and go together. The dependency parser was run on all the sentences in the corpus and dependency relations were extracted for each word in the text (in the CoNLL-U format [40]).
For each tweet, the following dependency information was extracted. The CoNLL-U format of the extracted dependency pattern consists of the index, text, lemma, xpos, feats, governor, and dependency relations (Table 2). These extracted dependency relations were used to extract patterns that were used by the Basilisk algorithm to generate seeds. These extraction patterns were created for each dependency relation obtained in the previous step. The extraction patterns consisted of noun phrases and the dependency of them with other related words in the sentence. This acted as the input to the bootstrapping method.
After the input was generated, the next step was to generate the seeds using Basilisk. The seed words from the initial pattern pool enlarge with every bootstrapping step. The extraction patterns were scored using RlogF metric [41], which is commonly used for extraction pattern learning [41]. The score for each pattern was computed as: , where represents the number of category members extracted by and is the total number of nouns extracted by . This formula was used to score the patterns with a high precision or moderate precision but a high recall. The high scoring patterns were then placed in the pattern pool. After this process, all head nouns co-occurring with patterns in pattern pool were added to the candidate word pool. At the end of each bootstrapping cycle, the best candidates were added to the lexicon thus enlarging the lexicon set.
2.2.2. Identify Stressed or Non-Stressed Tweets Using Words Obtained from Basilisk Algorithm
The process used related to Basilisk, as proposed by Thelen and Riloff, can be described using the algorithm shown on Table 3 (for notation description see Appendix A). This performs the categorization task of assigning nouns in an unannotated corpus to their corresponding semantic categories. Using the words generated by the Basilisk algorithm, we counted the total number of occurrences of any of the keywords in both categories. After the total count of stress and non-stress words in each tweet was obtained, we determined whether the tweet was in the category of stressed or non-stressed or neutral. This was done by finding the maximum of the stress and non-stress word counts in three conditions: (1) If there were more stress words than non-stress words, we annotated the tweet as expressing stress. (2) If the number of non-stress words is greater than the number of stress words, we annotated the tweet to express relaxed behavior. (3) If the count was zero for both stress and non-stress words, we did not annotate the data. Thus, tweets and their corresponding labels generated using this process were the initial training set, which was used to train a classifier to classify the other unannotated tweets.
2.2.3. Generate Word Embeddings and Train the Classifier
The universal sentence encoder [42] was used to generate word embeddings. These text embeddings convert tweets into a numerical vector, encoding tweet texts into high dimensional vectors that are required to find semantic similarity and perform the classification task. It takes a variable length English text as input and outputs a 512-dimensional vector embedding. The encoder model was trained with a deep averaging network (DAN) encoder [15]. After the word embeddings were obtained for each stressed and non-stressed category tweet, a technique was used to make the two classes equalized. To do this, we selected the category with fewer samples and made the other category a similar size by removing samples. This ensured that the training process was not biased towards a particular class.
Before training the classifier, the data were split into training and validation sets. The data were randomly shuffled and put into the two datasets, with 80% used as the training dataset. To obtain the best performance, multiple classifiers were used, and performance was compared using accuracy metrics. The classifiers used in the training process were SVM [42], logistic regression [43], naïve Bayes classifier [44], and a simple neural network.
SVM handles nonlinear input spaces and separates data points using a hyperplane using the largest amount of margin. As a discriminative classifier, SVM found an optimal hyperplane for our data, which helped with classifying new unannotated data points. We used different kernels to train the SVM. The hyperparameters were tuned and the optimal value of regularization and gamma were also recorded. The logistic regression classification algorithm can be used to predict the probability of a categorical dependent variable. The dependent variable is a binary variable that contains data coded as 1 (stressed) or 0 (non-stressed). The logistic regression model predicts as a function of . Prior to training, it shuffles the data. It uses a logistic function to estimate probabilities to calculate the relationship between independent variable(s) and the categorical dependent variable [45]. Naïve Bayes is another probabilistic classifier which makes classifications using the Bayes rule. This classifier is simple and effective for text classification. A simple neural network consisting of three dense layers were used to train our datasets. The loss function and optimizer used in the training is binary cross entropy and RMSProp, respectively. Training was done for 40 epochs with a batch size of 512. Table 4 illustrates the performance evaluation of these classifiers.
2.2.4. Generate Labels Using the Trained Classifier
After the model was trained, the model was run on the unannotated tweets to label them. To label the sentence embeddings for the tweets, the same procedure was used as for the training set. The universal sentence encoder extracts 512 features and created vectors that were used to classify the tweets based on the model. The SVM classifier with linear kernel was used to predict the probabilities of the tweets because it had the best trained models (see Table 4). Here, a threshold of 0.75 was set to determine if the tweet belonged to a particular category or not. If the probability of the tweet was above 0.7 for that category, the tweet was classified with the corresponding label.
The tweets and labels generated using the above process were then used to train another classifier to generate the final model for classification of the entire unannotated corpus. Here, a logistic regression model was used to train tweets and their corresponding labels generated using the above process to ensure that the model was robust and was not overfitted on the initial set of tweets that were filtered out using the Basilisk generated keywords. The trained model had an accuracy of 90.2% on the validation data.
2.2.5. CorExQ9 Algorithm
In this article, we propose a novel CorExQ9 algorithm to detect spatiotemporal patterns of COVID-19 related stress. Table 5 illustrates the general structure of the CorExQ9 algorithm. The input of the algorithm was the stressed-related tweets derived by using the trained models (see Section 2.2.3 and Section 2.2.4) to all the processed COVID-19 related tweets. We assessed the level of stress expressed in COVID-19 related tweets by integrating a lexicon-based method derived from established clinical assessment questionnaire PHQ-9 [46]. Table 6 illustrates the PHQ-9 lexicon examples and their corresponding mental stress symptoms.
The PHQ-9 lexicon contains about 1700 clinical words, which is difficult to understand and match with the spoken language that is often used on Twitter. Therefore, we used the following methods to transform PHQ-9 lexicon to human understandable language by appending matched tweets to their best match PHQ-9 categories. In the first step, each tweet was placed into a set of phrase sets using Natural Language Processing toolkit spaCy [44] (see Table 4, procedure 1). After that, the tweets and PHQ-9 lexicon were vectorized using Global Vectors for Word Representation (GloVe), Wikipedia, and Gigaword 5 model (with 300 dimensional word vectors and four million unique tokens) [45]. GloVe provides a quantitative way to distinguish the nuance difference of two words (e.g., happy or unhappy), which is useful to match phrases set with the PHQ-9 lexicon. Those pre-trained vectors were loaded to Gensim [47] to perform average vector and cosine distance calculation (see Equations (1) and (2)). We appended all phrases that have the similarity rate higher than 0.8 to their corresponding PHQ-9 lexicon (see Table 4, procedures 3–5).
Given any words in a phrase, the average vector was calculated using the sum of the vectors divided by the number of words in a phrase:
Given any two average vectors and of two phrases, the cosine similarity, , is represented by
Next, a sparse matrix (e.g., a vocabulary dense matrix) for stressed corpus was calculated by transforming those tokenized and vectorized tweets using frequency inverse document frequency (TFIDF). The mathematical formula of TFIDF is illustrated below:
where denotes the terms; denotes each document; and denotes the collection of documents. The first part of the formula calculates the number of times each word in COVID-19 corpus appeared in each document. The second part of is made up with a numerator and a denominator . The numerator infers the document space, which is all documents in our COVID-19 stress corpus. The denominator implies the total number of times in which term appeas in all of our documents . The can be represented by
We utilized Scikit-Learn TfidfVectorizer to transform preprocessed tweets to a sparse matrix [48] (see Table 4, procedure 6). After that, the sparse matrix and lexicon are used by the anchored CorEx model to perform anchored topic modeling [32]. The total correlation [49] (for notation description see Appendix A) of each topic is calculated by anchoring the CorEx model with the document sparse matrix. The total correlation in our PHQ-9 lexicon detection can be expressed using Kullback–Leibler divergence as below [50].
where represents the probability distribution and is non-negative or zero factorizes of (see Appendix A for more detail). In the context of PHQ-9 detection, represents the group of word types among the COVID-19 corpus. Note that each vector in the TFIDF matrix is based on the distance between two probability distributions, which is expressed as cross-entropy [51,52]. When introducing a random variable , the can explain the correlation reduction in , which is a measure of the redundant information that the word types carry about topic [30]. The total correlation can be represented by:
where (for notation description see Appendix A).
Thus, the algorithm starts with randomly initialized variables and , where are indicator variables of that are assigned to 1 if the topic is detected and represents the approximate empirical distribution (see Table 4, procedure 7). Then, the correlation explanation updates both variables iteratively until the result achieves convergence. In each iteration, the estimate marginals and mutual information are calculated (notation description see Appendix A). Next, the update for in each step is calculated by
where conduct a smooth optimization of the soft-max function [53,54]. Finally, the soft labeling of any (for notation description see Appendix A) can be computed by
After the soft-max function converges to the true solution at a particular step in the limit , the mutual information terms can be ranked by the informative order in each factor. To perform semi-supervised anchoring strategies, Gallagher and Reing proposed the combination with bottleneck function and total correlation [32]. The bottleneck function can be represented by:
The connection with CorEx and anchor words can be described by comparing Equation (6) with Equation (9). The same term in two equations represents the latent factor and the variable corresponds to . It is worth noting that Z is typically labeled in a supervised learning task [54] and is a constant parameter to constrain supervising strength so that can imply a word type correlated with topic . In this case, was represented by each variable generated by the enriched PHQ-9 lexicon. To seed lexicon to detect topics, we can simply anchor the word type to topic , by constraining the (see Table 5, procedures 8–11).
2.2.6. Define the PHQ Category and Uncertainty Analysis
The symptoms of COVID-19 related stress were visualized at the county level biweekly from 26 January. Here, we used the fuzzy accuracy assessment method to evaluate the uncertainty of final PHQ stress level for each county [55,56].
We summarized the implementation of fuzzy accuracy assessment for a thematic map as presented by Gopal and Woodcock to explain our model evaluation for the PHQ map [55]. Let be a finite universe of discourse, which is the set of county polygons in the study area. Let denote the finite set of attribute membership function (MF) topics categories to the in ; and let be the number of categories , (e.g., nine PHQ categories). For each , we define as the MF classes assigned to . The set:
defines the data. The subset of data is used. A fuzzy set is associated with each class where is the characteristic of MF of . The fuzzy set can be represented as:
To implement a decision-making system for fuzzy accuracy, the model uses a Boolean function that returns results of 0 or 1 based on whether belongs to the class with respect to the matrix . That is, = 1 if “belongs” , and if does not “belong” to . Then is 1 if the numeric scale of the MF for in category is maximum among all map categories , and we set the Boolean function as follows:
According to the fuzzy set accuracy assessment, the final PHQ value for each county was selected based on the MAX function, meaning each county was colored based on the majority tweet PHQ value derived from the proposed CorExQ9 algorithm. Since the accuracy assessment was based on a comparison of the PHQ label assigned to each county with the evaluation given by the expert (e.g., in each county, the majority tweet PHQ label). The rating system can thus be expressed as linguistic variables that describe the uncertainty associated with the evaluation of the class label. Here, the linguistic variables are described below:
- Score 1: Understandable: the answer is understandable but may contain high levels of uncertainty;
- Score 2: Reasonable: maybe not the best possible answer but acceptable;
- Score 3: Good: would be happy to find this answer given on the map;
- Score 4: Absolutely right: no doubt about the match. It is a perfect prediction.
Figure 1 illustrates the fuzzy MF created for the fuzzy accuracy assessment analysis. The x-axis represents the percentage of the tweets that belong to the assigned final PHQ category. The y-axis represents the value of the degree of the membership function corresponding to the linguistic score. For instance, if a county was assigned to a PHQ category 3, and 80% (e.g., x = 0.8 in Figure 1) of the tweets within this county polygon were labeled as PHQ-3 using the CorExQ9 algorithm, the corresponding MF should be absolutely right with membership value equal to 1. The accuracy assessment score was further visualized on the PHQ stress map to show the spatial uncertainty of the analysis results.
2.3. Baseline Evaluation
Since CorExQ9 represents topic and potential symptoms as a lexicon-based topic modeling, traditional measures such as regression correlation and log-likelihood are unnecessary for the semantic topics. Therefore, to evaluate the baseline performance of the CorExQ9 model, we first involved the semantic topic quality coherence measure methods with other common topic models. We compared CorExQ9 with LDA and non-negative matrix factorization (NMF) [57,58]. In addition, we used Frobenius normalized NMF (NMF-F) and generalized Kullback–Leibler divergence NMF (NMF-LK) for a closer comparison with traditional topic modeling. All models were trained with a randomly selected COVID-19 Twitter dataset. The topics generated by those models were scored by topic coherence measures to identify the degree of semantic similarity between high-scoring words in the topic. A common coherence measure is UMass which calculates and scores the word co-occurrence in all documents [59]:
where D represents the number of documents containing both and words and counts the ones containing , and represents a smoothing factor. The intrinsic UMass [59] coherence measure calculates these probabilities over the same training corpus.
Additionally, the extrinsic UCI measure [58] introduced by David Newman uses a pairwise score function, which is based on pointwise mutual information (PMI). It can be represented by:
where represents the probability of seeing in a random document, and is the probability of seeing both and co-occurring in a random document. Those probabilities are empirically estimated from an external dataset such as Wikipedia. The higher the topic coherence measure score, the higher the quality of the topics. In our baseline evaluation, we calculated the coherence scores by setting the range of topic numbers from 10 to 30. The abnormal and low-quality topics were cleared and the average coherence scores (Table 7) were calculated by the sum of all coherence scores divided by the number of topics. On average, the CorExQ9 algorithm has a better UMass score than LDA and NMF. Even though the UCI score was slightly lower than two types of NMF algorithms, we can take the external estimation dataset as an uncertainty factor of this coherence model because the result of the comparison was still meaningfully coherent and it has the competitive functionality of the semi-supervised feature, which exceeded the usable range of NMF.
3. Results
3.1. Overall Experimental Procedures
In our research, the methods described above were combined to generate the final thematic map. To summarize processes for each detailed procedure, the workflow for the research is shown in Figure 2. First, starting from data collection, we prepared a Twitter dataset, Basilisk lexicon, and PHQ-9 lexicon. Then, we cleaned each tweet and extracted its location information using the method mentioned in Section 2.1. To engage time series analysis, the whole Twitter dataset was formatted and sorted by Unix Timestamp before being sliced into two-week intervals. Third, two lexicons were separately assigned to CorExQ9 and Basilisk algorithm (mentioned in Section 2.2) with the prepared Twitter dataset. In the end, we decomposed the result generated by anchored CorEx model into spare matrix in order to group by all tweets in county level for visualization. Note that each row of the results from the CorEx algorithm represents the correlations index within an individual tweet explained by nine PHQ levels so that we can reverse convert the result to its original tweets. The selected top symptoms and topics are present in Table 8.
3.2. Fuzzy Accuracy Assessment Results
The fuzzy accuracy assessment results of the study are illustrated in Figure 3. On each map, the individual county is colored according to the assigned PHQ index using the proposed algorithm and fuzzy assessment accuracy assessment method. The numbers on the map represent the spatial uncertainty indices derived from the fuzzy accuracy assessment. Each number represents the assessment score calculated from Section 2.2.6. For most of the hot spots areas in Figure 3, the values are greater than two, which indicates middle to high accuracy results have been reached for those regions. Higher scores for an area indicate a larger percentage of the topics being present in this area at specific time region.
3.3. Spatiotemporal Patterns and Detected Topics
The results also present the spatiotemporal patterns from January to April (shown in Figure 3a–g. Table 8 shows the detected stress symptoms and topics generated from CorExQ9. Each map represents the spatial distribution of stress symptoms over a biweekly period. It indicates that most of the regions have low to medium PHQ values (topic 0–3) during January and February, since information about the U.S. COVID-19 outbreak was not publicly available in the U.S. during that time. Most counties that have a low PHQ level contain general COVID-19 related topics that are tied to the cases in Asia and general symptoms of COVID-19 (e.g., “Wenliang Li” (a Chinese doctor) [60], “South Korea confirms”, “coughing”, “sneezing”). From the end of January, a few hotspots appear in some major U.S. cities such as San Francisco, Denver, Los Angeles, and Seattle with topics related to “mistakenly released”, “vaccine”, “pandemic bus”, and “China death” (see Table 8, Figure 3b,c). For instance, the keyword “mistakenly released” reflects news story in February about the first U.S. evacuee from China known to be infected with the coronavirus being mistakenly released from a San Diego hospital and returned to quarantine [61]. People who living in California reacted strongly to this news (Figure 3d).
Later, on 8 March (Figure 3c,d), the PHQ level started to increase rapidly due to the COVID-19 test stations available, increased number of COVID-19 death cases, and a shelter-in-place order in many states (see Table 8, March). An interesting pattern was found that the number of counties with a high PHQ value kept growing until 5 April and started to decrease after the second week of April [62]. Figure 4 illustrates the number of increased cases in the U.S. from January to May 2020. Results show that the PHQ stress level in our results matches well with the number of increased cases illustrated in the Johns Hopkins Coronavirus Resource Centers’ statistical analysis results [61]. This means the number of new cases reduced due to the social distancing practice, and at the same time, the level of people’s major concerns in many geographic regions reduced as well.
Our results also show a meaningful explanation of the spatial pattern caused by people’s risk perception to various media messages and news during the pandemic. In March 2020, people in the United States had mild concerns about the UK prime minister Boris Johnson’s talk of “Herd Immunity” [65] and social distancing (see Table 8, PHQ0, March). On the other hand, the major stress came from topics such as cases of deaths (e.g., in Washington State), lack of food and COVID-19 protection equipment (e.g., panic buy), and the increasing number of confirmed and death cases in the United States. Figure 3d,e shows that most of the hotspots were located in Washington, California, and New York, and Florida matched with to the March COVID-19 increased cases map (see [61]. In April, keywords such as “death camps”, “living expenses”, “white house”, and “economy shrinks” (see Table 8) appeared most often in the high PHQ value categories, which indicated that people’s major concerns shifted to financial worries due to businesses shutting down and the economic depression [66].
4. Discussion
Our study was conducted to perform a spatiotemporal stress analysis of Twitter users during COVID-19 pandemic by the CorExQ9 algorithm. According to the model evaluation results, the proposed CorExQ9 had the best baseline performance among other similar algorithms such as LDA, NMF-LK, and NMF-F models. In addition to the CorExQ9 algorithm, we applied a fuzzy accuracy assessment method to the CorExQ9 analysis results to visualize the spatial uncertainty of the analysis results. This enables expert knowledge (e.g., PHQ rating of tweets) to be integrated in the social media data mining process. The result of our observed pattern reasonably matched the relevant events and epidemic trends.
Ideally, the analytic result of our collected Twitter dataset is expected to support the research of mental health for the entire U.S. population as a sample case. In our cleaned Twitter dataset, those tweets were posted by 1,410,651 users, which represent over 0.4% of the U.S. population. However, a previous investigation found that the 22% of American adults who use Twitter are not uniformly distributed across age [66,67]. Another study found that Twitter users are getting younger [68], but the actual age, gender, and race of Twitter users from those investigations have been controversial [55]. To generalize the psychology health analysis to the whole U.S. population, further work related to the user demographic is required to reduce the influence of the sample bias.
The thematic maps we created for PHQ topics distribution were assessed based on fuzzy sets. The purpose of this commonly used method for categorical maps is to allow explicit accounts for the possible ambiguity regarding the appropriate map label [55,69,70,71,72]. A wide variety of statistical techniques have been proposed for the accuracy assessment of thematic maps [73]. In the future, we can use the standard deviation approach to estimate the quantity derived from the distribution of the tweets as a count on specific category if the assessment is focused on how the number of labeled PHQ tweets were distributed in each category. Even though our datasets were preprocessed and selected with entities on COVID-19 related topic, some of the tweets might be outside of the topic or are influenced by other objective factors. Our future focus of uncertainty assessment of the thematic maps could be to extend to spatial uncertainty [74], temporal uncertainty [75] semantic uncertainty [76], etc. Our assessment task can be considered a criterion referenced task that can focus on a selected PHQ level and can represent the majority level in any location. The fuzzy area estimation methods were extended based on previous research [72]. Category assessment based on fuzzy sets can estimate the accuracy of classes as a function of levels of class membership [77].
Here, we used biweekly data as a temporal scale for the analysis. Our research group continues collecting Twitter data for this project, so analysis could be applied to more fine-grained temporal scales in the future. Since COIVD-19 is a global pandemic, this project could be extended to a global scale to compare the results across different countries. In the future, the model could be applied to other cases to detect the related stress symptoms and provide real-time spatial decision support for addressing the problem. An end-to-end spatiotemporal analysis system could be built if all of the modules were integrated; this would increase the efficiency of determining the potential symptoms and causes of public mental health problems.
5. Conclusions
In this article, we proposed the CorExQ9 algorithm to analyze the COVID-19 related stress symptoms at a spatiotemporal scale. The CorEx algorithm combined with clinical stress measure index (PHQ-9) helped to minimize human interventions and human language ambiguity in social media data mining for stress detection and provided accurate stress symptom measures of Twitter users related to the COVID-19 pandemic. There was a strong correlation between stress symptoms and the number of increased new COVID-19 cases for some major U.S. cities such as Chicago, San Francisco, Seattle, New York, and Miami. People’s risk perceptions were sensitive to the release of COVID-19 related public news and media messages. Many frequently appearing keywords in the high PHQ value categories represent the popular media and news publications at that time. Before March, most regions had mild stress symptoms due to the low number of reported cases caused by the unavailability of test stations, creating a false sense of security among the public in the United States. The number of cases increased suddenly in March due to governmental confirmation of the seriousness of the pandemic in the United States and shelter-in-place orders in many states. From January to March, a major concern for people was being infected by the disease and there was panic-buying behavior, but this shifted to financial distress later in April along coastal eastern and western United States.
Our main contributions are as follows: First, we introduced a specialized stress tweets classifier, which narrows down the theoretical algorithms to practical usage on the public health area and demonstrates more effectiveness than traditional sentiment index classifiers. Second, we framed CorExPQ9 as a topic detection model in our research. We explored the latent connection between the social media activity and PHQ-9 depression symptoms and topics in United States. Finally, as a supplement methodology for the existing questionnaire-driven mental health research, our integrated system was used to glean depression topics in an unobtrusive way.
The proposed algorithm provides an innovative way to analyze social media data to measure stress symptoms under COVID-19 pandemic at a spatiotemporal scale. By doing this, we were able to observe spatiotemporal patterns of stress symptoms and answer the questions of what the major concerns related to the pandemic in different geographic regions at different time scales were. In the future, this model could be applied to other cases to detect related stress symptoms and provide real-time spatial decision support for addressing arising issues.
The reference list from the paper itself. Each links out to its DOI / PubMed record.
- 1World Health Organization Coronavirus Disease (COVID-19): Situation Report 110Available online: https://www.who.int/emergencies/diseases/novel-coronavirus-2019/situation-reports/(accessed on 29 May 2020)
- 2Centers for Disease Control and Prevention Mental Health and Coping During COVID-19|CDC Available online: https://www.cdc.gov/coronavirus/2019-ncov/daily-life-coping/managing-stress-anxiety.html(accessed on 29 May 2020)
- 3Kirzinger A.Kearney A.Hamel L.Brodie M.KFF Health Tracking Poll-Early April 2020: The Impact of Coronavirus on Life in America KFF Oakland, CA, USA 2020130
- 4Kroenke K.Spitzer R.L.The PHQ-9: A new depression diagnostic and severity measure Psychiatr. Ann.20023250951510.3928/0048-5713-20020901-06 · doi ↗
- 5Haselton M.G.Nettle D.Murray D.R.The Evolution of Cognitive Bias The Handbook of Evolutionary Psychology John Wiley & Sons Inc.Hoboken, NJ, USA 2015120
- 6Zhou C.Su F.Pei T.Zhang A.Du Y.Lu B.Cao Z.Wang J.Yuan W.Zhu Y.COVID-19: Challenges to GIS with Big Data Geogr. Sustain.202017787 Available online: https://www.sciencedirect.com/science/article/pii/S 2666683920300092(accessed on 29 May 2020)10.1016/j.geosus.2020.03.005 · doi ↗
- 7Mollalo A.Vahedi B.Rivera K.M.GIS-based spatial modeling of COVID-19 incidence rate in the continental United States Sci. Total Environ.202072813888410.1016/j.scitotenv.2020.13888432335404 PMC 7175907 · doi ↗ · pubmed ↗
- 8Jahanbin K.Rahmanian V.Using twitter and web news mining to predict COVID-19 outbreak Asian Pac. J. Trop. Med.2020262810.4103/1995-7645.279651 · doi ↗