Microscopy and supporting data for osteoblast integration within an electrospun fibrous network
Urszula Stachewicz, Tuya Qiao, Simon C.F. Rawlinson, Filipe Veiga Almeida, Wei-Qi Li, Michael Cattell, Asa H. Barber

TL;DR
This paper provides supporting data on how osteoblast cells integrate into electrospun fiber networks used for bone regeneration.
Contribution
The novelty lies in detailed microscopy and degradation analysis of electrospun PLGA fibers and 3D reconstruction of cell integration.
Findings
Degradation analysis of PLGA fibers was conducted in medium and air.
Steps in 'slice and view' tomography using FIB and SEM were described.
3D reconstructions showed osteoblast integration into electrospun fiber networks.
Abstract
This data article contains data related to the research article entitled “3D imaging of cell interactions with electrospun PLGA nanofiber membranes for bone regeneration” by Stachewicz et al. [1]. In this paper we include additional data showing degradation analysis of poly(d,l-lactide-co-glycolide acid) (PLGA) electrospun fibers in medium and air using fiber diameter distribution histograms. We also describe the steps used in “slice and view” tomography techniques with focused ion beam (FIB) microscopy and scanning electron microscopy (SEM) and detail the image analysis to obtain 3D reconstruction of osteoblast cell integration with electrospun network of fibers. Further supporting data and detailed information on the quantification of cell growth within the electrospun nanofiber membranes is provided.
Genes, proteins, chemicals, diseases, species, mutations and cell lines named across the full text — each resolved to its canonical identifier and authoritative record.
Click any figure to enlarge with its caption.
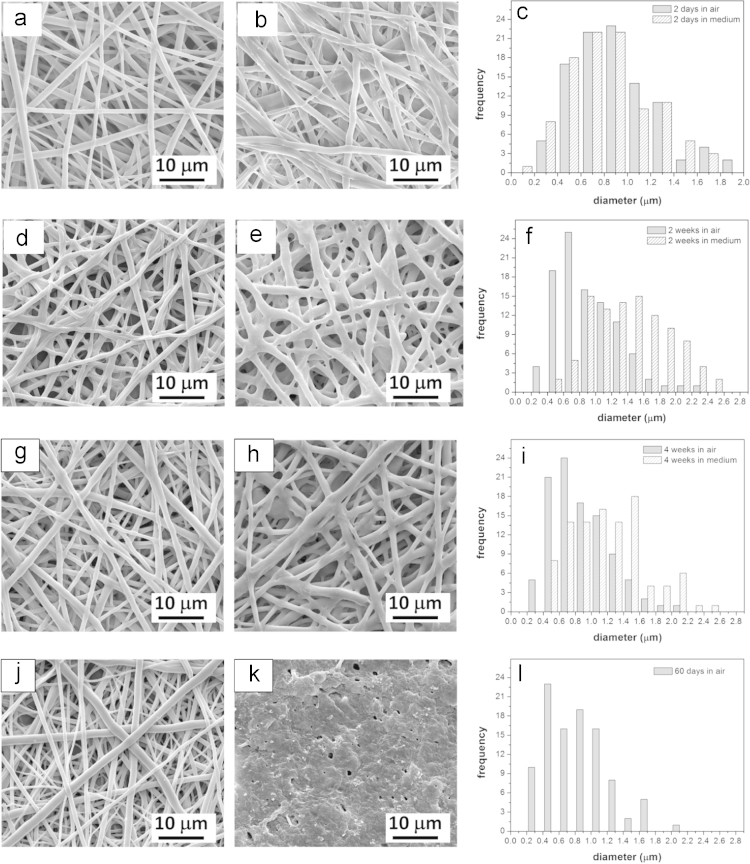 Figure 1
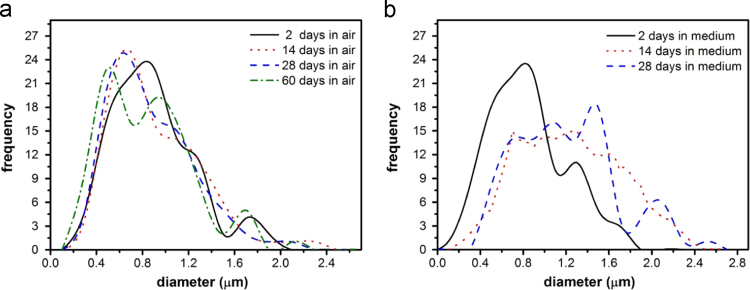 Figure 2
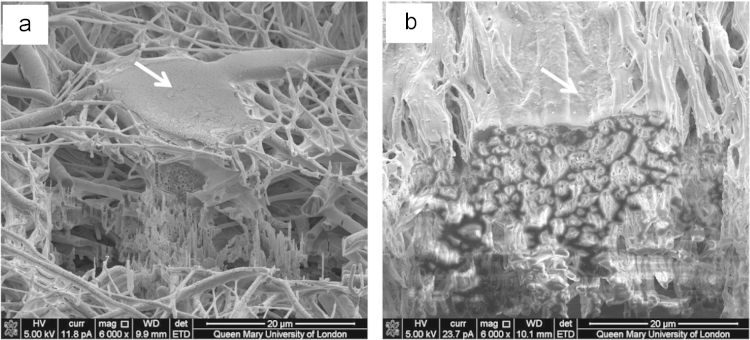 Figure 3
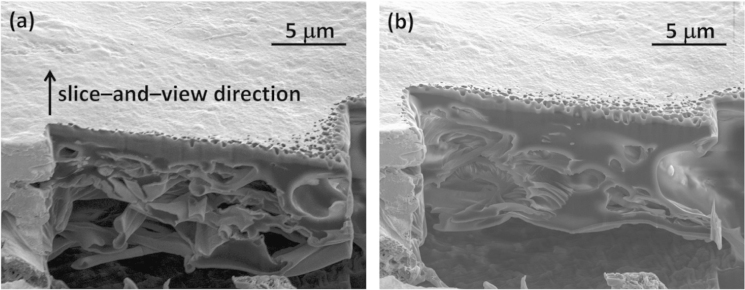 Figure 4
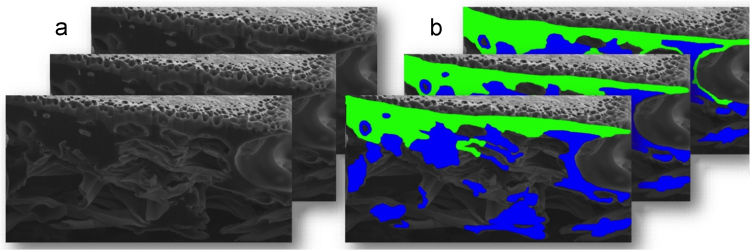 Figure 5
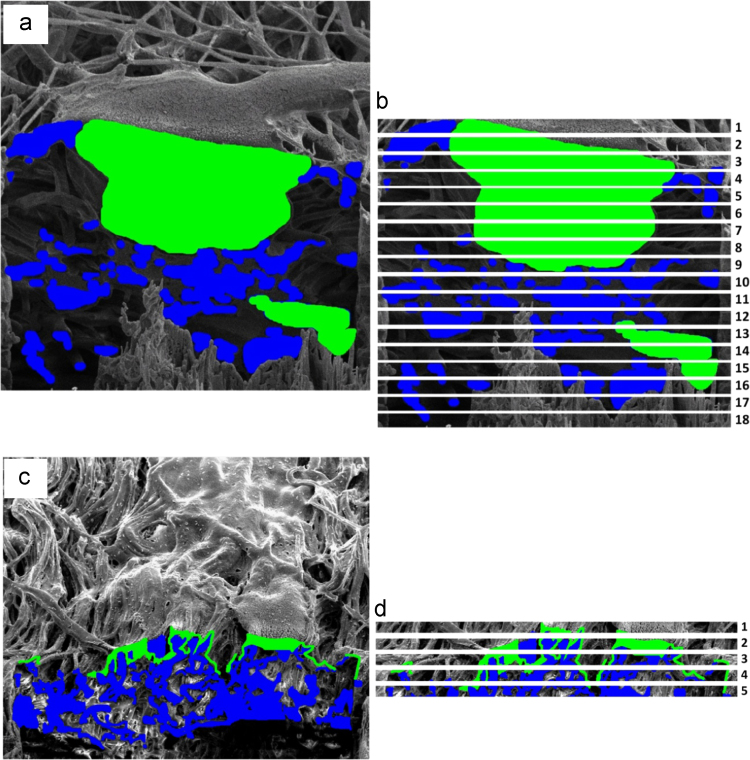 Figure 6
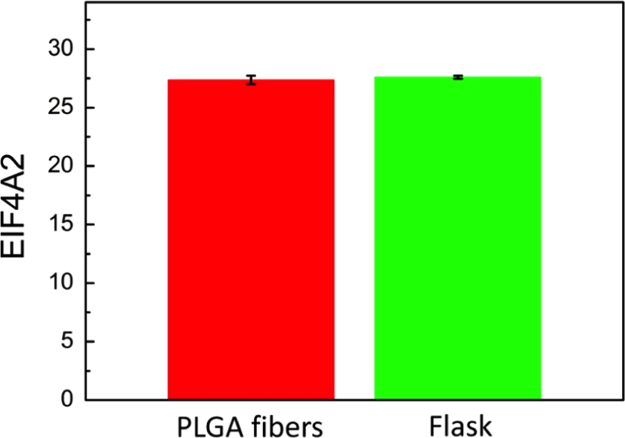 Figure 7
Peer Reviews
No public reviews on file for this paper yet. If you reviewed it on a platform where reviews are public (OpenReview, ICLR, NeurIPS, ICML), you can paste yours below so the community can read it here.
Videos
No videos yet. Explain this paper in a talk, walkthrough, or lecture? Add one.
Taxonomy
TopicsIoT-based Smart Home Systems · Smart Grid Energy Management · Advanced Manufacturing and Logistics Optimization
Specifications tableTableSubject areaTissue engineering, Material Science, Biology,More specific subject areaElectrospun nanofibers, FIB-SEM tomography, 3D imagingType of datatext file, graph, figure, movies, animationsHow data was acquiredSEM, FIB-SEM ( Quanta 3D, FEI, E.U./U.S.A.)Data formatRaw and analyzed dataExperimental factorsElectrospun samples after cell culture were FIB sectioned for 3D reconstruction. The reconstructed samples were analyzed for cell growth into the nanofiber networkExperimental features*- Degradation test of PLGA nanofibers in medium and air over 8 weeks time.- FIB-SEM tomography used for 3D visualization and quantification of cell integration with electrospun nanofibersData source locationUK, London,* Queen Mary University of LondonData accessibilityData is with this article
Value of the data
- •The data shows the successful application of FIB-SEM tomography of cells to 3D image cell-nanofiber interactions and quantification of cells growth within the network of nanofibers.
- •The data provide examples of detailed analysis to verify cell growth at the filopodia level.
- •The data provide proofs for cells integration within electrospun nanofiber networks despite network pore size being considerably smaller than typical cell diameter.
- •Degradation studies of the electrospun nanofiber membranes over an 8 week time period shows reduction of membrane porosity and loss of fiber structure.
Data and materials and methods
1
Morphological analysis of PLGA fibers
1.1
Polymer solutions for electrospinning were prepared using poly(d,l-lactide-co-glycolide acid) (PLGA-lactide:glycolide (75:25), molecular weight: 66,000–107,000, Sigma Aldrich, U.K.) dissolved in a mixture of chloroform (analytical reagent grade, Fischer Scientific, U.K.) and N,N –dimethylformamide (DMF, 99.8%, Sigma Aldrich, U.K.) (85/15 mass ratio). Electrospinning of PLGA solution (15 wt%) was achieved using a single nozzle setup and a voltage of 14–15 kV and a distance 20 cm applied between the nozzle and a ground electrode. Degradation tests of PLGA in the form of electrospun nanofibers was carried out over 8 weeks in medium (Lonza Bio DMEM medium at 37 °C in a humid atmosphere under 5% CO_2_) and in air (dry conditions at room temperature (~22 °C) in darkness).
The change in fiber diameter was recorded and the results are presented in the scanning electron microscopy (SEM) images and corresponding histograms in Fig. 1. Fiber diameter size distribution analysis was performed using image analysis (ImageJ, NIH, U.S.A.) with a total of 100 fiber diameter measurements taken from SEM images of each sample. For every image we set the scale bar so the fibers can be measured using the Measure function in the Analyze tab.
A decrease in the PLGA fiber diameter kept in dry conditions was observed over 60 days of the test as shown in Fig. 2. Samples kept in medium increased their diameter and gave a wider fiber size distribution, resulting in pore size decreases over 28 days. After 60 days, the sample porosity was significantly reduced and fiber structures were difficult to identify for the size distribution measurements as shown in Fig. 1(k).
Scanning electron microscopy and focus ion beam
1.2
Cell seeding was performed prior to microscopy observation with 2 ml ( 450,000 cells per ml) of medium containing either rat osteoblast cell line (UMR 106, ATCC® CRL-1661™) or mouse cell line (MC3T3-E1, subclone 14, ATCC® CRL-2594™) that was added to each sample and cultured at 37 °C in a humid atmosphere under 5% CO_2_ for 4 days. Cells were cultured using Lonza Bio DMEM medium containing 4.5 g l-glutamine, 2% Fetal Calf Serum (FCS, Sigma–Aldrich, U.K.) for UMR 106 and 10% Fetal Bovine Serum (FBS, Sigma–Aldrich, U.K.) for MC3T3-E1, and penicillin/streptomycin (Invitrogen, U.K.) 100 units ml^−1^. Two microscope slides with electrospun PLGA nanofibers were placed per Petri dish.
Imaging cell-nanofiber integration in random and aligned fibrous scaffolds, with SEM providing imaging of samples after subsequent focus ion beam (FIB) sectioning through samples, are presented in Fig. 3, Fig. 4. FIB sectioning was carried out following procedures defined in [2], [3] to minimize ion beam damage to samples. The video files of slice and view process are included in raw data files.
2D SEM images collected during FIB sectioning through a sample is shown in Fig. 5. Each 2D image was artificial colored using Image J (version 1.46r, NIH, USA) manually to differentiate osteoblasts from the electron nanofiber network. The collected 2D image data stack was used to create a 3D reconstruction as presented in [1].
Analysis of volume occupied by osteoblasts within the electrospun nanofiber network was achieved by first digitally slicing membrane cross sections containing cells into 1 μm thick layers as indicated in Fig. 6. Image analysis was used to calculate the occupied volume of cells and nanofibers in each layer. Images were filtered using Image J by applying color thresholding and then exploiting the percentage area covered function on individual images to calculate volume composition. The volume occupancy of cells and fibers at a specific depth within the membrane, defined by the position of the layer considered, was therefore found and presented in Figure 10 of our studies [1].
Gene expression
1.3
Western blot was used to determine protein production and qPCR applied for gene expression. Eukaryotic initiation factor 4A-II (EIF4A2) was used as a reference (house keeping) gene with Fig. 7 showing parity between gene expression results of PLGA fibers and flask samples.
The reference list from the paper itself. Each links out to its DOI / PubMed record.
- 1Stachewicz U.Qiao T.Rawlinson S.C.F.Viga De Macedo Almeida F.Li W.Q.Catell M.Barber A.H.3D imaging of cell interactions with electrospun PLGA nanofiber membranes for bone regeneration Acta Biomater.272015881002634814310.1016/j.actbio.2015.09.003 · doi ↗ · pubmed ↗
- 2Stachewicz U.Bailey R.J.Zhang H.Stone C.A.Willis C.R.Barber A.H.Wetting hierarchy in oleophobic 3D electrospun nanofiber networks ACS Appl. Mater. Interfaces 7201516645166522617630410.1021/acsami.5b 04272 · doi ↗ · pubmed ↗
- 3Bailey R.J.Geurts R.Stokes D.J.de Jong F.Barber A.H.Evaluating focused ion beam induced damage in soft materials Micron 5051201351562372647110.1016/j.micron.2013.04.005 · doi ↗ · pubmed ↗