Safety and efficacy of an olive oil-based triple-chamber bag for parenteral nutrition: a prospective, randomized, multi-center clinical trial in China
Zhen-Yi Jia, Jun Yang, Yang Xia, Da-Nian Tong, Gary P. Zaloga, Huan-Long Qin

TL;DR
A study in China found that an olive oil-based parenteral nutrition regimen was as effective as a soybean oil-based one and caused fewer infections.
Contribution
This is the first large multi-center trial comparing olive oil-based and soybean oil-based parenteral nutrition in Chinese adults.
Findings
Olive oil-based nutrition was not inferior to soybean oil-based in improving anabolic status.
Olive oil-based nutrition was associated with significantly fewer infections.
Olive oil-based nutrition was easier to use and better tolerated.
Abstract
Small studies suggest differences in efficacy and safety exist between olive oil-based (OLIVE) and soybean oil-based (SOYBEAN) parenteral nutrition regimens in hospitalized adult patients. This large, prospective, randomized (1:1), open-label, multi-center, noninferiority study compared the delivery, efficacy, and safety of OLIVE (N = 226) with SOYBEAN (N = 232) in Chinese adults (≥18 years) admitted to a surgical service for whom parenteral nutrition was required. Treatments were administered for a minimum of 5 days up to 14 days (to achieve approximately 25 kcal/kg/day, 0.9 g/kg/day amino acids, 0.8 g/kg/day lipid). Impact of treatment on anabolic/catabolic and serum inflammatory, chemistry, and hematological markers, safety, and ease of use were assessed. The primary efficacy variable was serum prealbumin level at Day 5. OLIVE (n = 219) was not inferior to SOYBEAN (n = 224) based…
Genes, proteins, chemicals, diseases, species, mutations and cell lines named across the full text — each resolved to its canonical identifier and authoritative record.
Click any figure to enlarge with its caption.
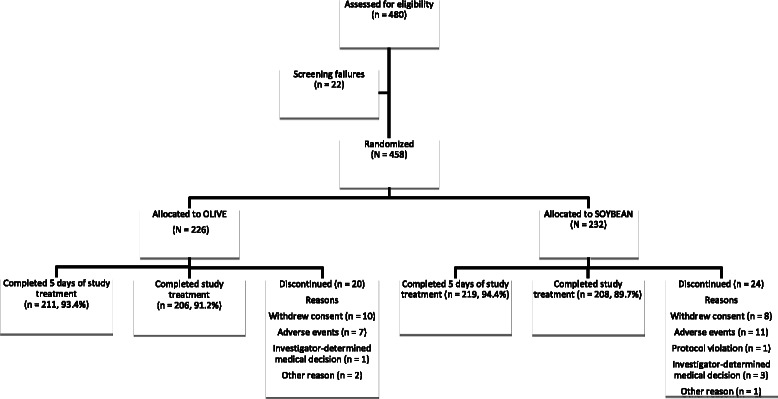 Figure 1
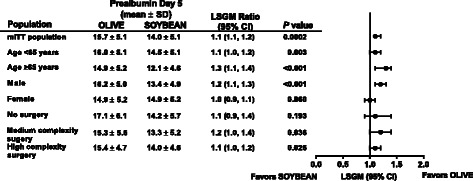 Figure 2
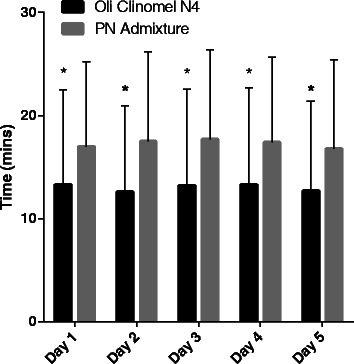 Figure 3
Peer Reviews
No public reviews on file for this paper yet. If you reviewed it on a platform where reviews are public (OpenReview, ICLR, NeurIPS, ICML), you can paste yours below so the community can read it here.
Videos
No videos yet. Explain this paper in a talk, walkthrough, or lecture? Add one.
Taxonomy
TopicsFinance, Taxation, and Governance
Background
The beneficial effects of parenteral nutrition (PN) in ill patients unable to tolerate adequate enteral feeding are well established [1–3]. PN not only improves nutritional status in malnourished patients, it also reduces complications [4, 5] such as infections, need for mechanical ventilation, and muscle weakness. As a result, PN is an important therapeutic modality for treating patients with compromised intestinal function.
Animal and human studies suggest that the lipid source in PN, and more specifically the fatty-acid composition of the lipid source, may contribute to the risk of complications [6–9]. Such complications include inflammation, oxidation, immune compromise, infections, hyperglycemia, and liver dysfunction/failure. Soybean oil-based lipid emulsions are composed of long-chain triglycerides, primarily linoleic acid (ω-6 polyunsaturated fatty acids [PUFAs]). In contrast, olive oil-based lipid emulsions are composed of long-chain triglycerides, primarily oleic acid (ω-9 monounsaturated fatty-acids [MUFAs]) [10]. According to the 2012 American Society for Parenteral and Enteral Nutrition (ASPEN) Novel Nutrient Task Force, lipid sources such as safflower oil and soybean oil are considered pro-inflammatory, while olive oil is considered immune neutral [10]. Experimental reports suggest that ω-6 PUFA-rich lipid emulsions that are derived from soybean oil may exaggerate the inflammatory response associated with stress and trauma via activation of the arachidonic acid eicosanoid pathway and have direct effects on lymphocyte, macrophage, and neutrophil functions [11–14]. These ω-6 PUFA effects upon inflammation and immune cell functions may increase the rate of infections. As a result, lipid emulsions with lower linoleic acid levels (ie, olive oil predominant emulsions) have been developed. However, there are limited data to suggest that the replacement of soybean oil-based ω-6 PUFAs with olive oil-based ω-9 MUFAs improves the safety of PN [15, 16]. Therefore, one of the objectives of this study was to evaluate the incidence of infections using two different lipid emulsions that varied in the content of linoleic acid.
In this study, we utilized two different PN regimens differing in lipid emulsion type (olive oil based versus soybean oil based) and delivery system (compounded versus a ready-to-use, three-chamber bag). The primary endpoint chosen was prealbumin level (an index of anabolic and inflammatory status). Due to the lower ω-6 PUFA content (a pro-inflammatory fatty acid) and higher oleic acid content (MUFA with lower oxidation risk) of the olive-oil based lipid emulsion, we hypothesized that this emulsion would be associated with improved anabolic/catabolic status. Anabolism was assessed using prealbumin, albumin, and insulin growth factor-1 (IGF-1) levels. Catabolism was assessed using the protein breakdown end-products of urea and 3-methylhistidine. We also assessed inflammation (interleukin-6 [IL-6], C-reactive protein [CRP], intercellular adhesion molecule-1 [ICAM-1]) and oxidation (malonyldialdehyde, F2-isoprostanes) biomarkers. By measuring anabolic, catabolic, and inflammatory parameters, we were able to compare changes in anabolic parameters in patients with similar inflammatory and catabolic status. In addition to these nutritional parameters, we assessed clinical outcomes using infections (a marker of immune status), hospital length of stay, mortality, and adverse events. Safety was assessed by measuring biomarkers of organ functions (liver, renal, hematologic, and endocrine). Because a ready-to-use formulation is immediately available to clinicians (no need to compound), we also assessed preparation time.
Although several small studies have investigated the differences between soybean oil-based and olive oil-based lipid emulsions, it remains unclear whether the replacement of ω-6 PUFAs with ω-9 MUFAs results in improved efficacy and safety. To address this shortcoming, the objectives of this study were to assess the delivery, efficacy, and safety of an olive oil-based lipid PN regimen compared with a compounded soybean oil-based lipid PN regimen in Chinese adults for whom oral or enteral nutrition was not possible, insufficient, or contraindicated.
Methods
Study design
The study was an open-label, prospective, randomized (1:1), comparative, multi-center, active-controlled, parallel-group investigational trial (NTC 01579097) conducted in 18 centers across China. Ethics approval was obtained from the Institutional Ethics Committees and written informed consent was obtained before enrolment of any patients into the clinical trial. The study was conducted between December 29, 2011 and November 21, 2012 and was centrally administrated by Global Clinical Development & Operations (CD&O) based in Baxter Alliance Park, Belgium.
Study population
Patients admitted to a surgical service were eligible for enrolment into the trial if all of the following criteria (and none of the exclusion criteria) were met: aged ≥18 to ≤80 years old; an inpatient that was hospitalized ≤14 days before enrolment; required PN because oral or enteral nutrition was not possible, insufficient, or contraindicated; had the capability to complete at least five days of study treatment (ie, PN); had a useable peripheral vein for intravenous (IV) delivery of PN; and was able to complete written informed consent per national regulations. Exclusion criteria were: a life expectancy of <6 days from initiation of study treatment; a known hypersensitivity to the components of the study treatments; use of prohibited medications within 30 days before enrolment; a known serious clinically significant condition such as congestive heart failure or severe renal insufficiency (renal failure that was not compensated for by hemofiltration or dialysis; patients unable to tolerate fluid load from PN); impaired hepatic function (total bilirubin >2 times the upper limit of normal; or alanine transaminase >4 times the upper limit of normal; or aspartate transaminase >4 times the upper limit of normal); a known history of human immunodeficiency virus infection; known congenital abnormalities of amino acid metabolism; known severe dyslipidemia (triglyceride level >2 times the upper limit of normal or >400 mg/dL or >4.52 mmol/L) or hyperglycemia (blood glucose >360 mg/dL); clinically significant abnormalities of plasma electrolytes; currently pregnant or lactating; prior enrolment in this clinical trial; participation in a clinical trial of any investigational drug or device concomitantly or within 30 days before enrolment in this clinical trial; or was considered unsuitable in the opinion of the Investigator. Due to clinical and resource constraints, consecutive patients were not enrolled at each center.
Treatment protocol
Patients were randomized to either an olive oil-based lipid PN regimen using OliClinomel N4 (OLIVE; Baxter Healthcare, Deerfield, IL, USA) or a compounded soybean oil-based lipid PN regimen using Intralipid (SOYBEAN; Sino-Swed Pharmaceutical Corporation, Ltd., Wuxi City, China).
OLIVE was supplied as a ready-to-use PN product presented as a three-chamber bag (1.5 l) comprising a larger outer chamber that contains a dextrose (D-glucose) solution (final mixed concentration 80 g/l) with calcium (final mixed concentration 2 mmol/l); a middle chamber that contains a solution of 15 amino acids (final mixed concentration 22 g/L), with electrolytes including sodium (final mixed concentration 21 mmol/L), potassium (final mixed concentration 16 mmol/L), magnesium (final mixed concentration 2.2 mmol/L), and phosphate (final mixed concentration 8.5 mmol/L); and a smaller outer chamber that contains a lipid emulsion comprising 80 % olive oil and 20 % soybean oil (final mixed concentration 20 g/L).
SOYBEAN was prepared as a compounded admixture by the institutional pharmacy (1.5 l), specifically the Pharmacy Intravenous Admixture Services if available, per the investigators’ prescription. Components were manufactured by: dextrose – 20 % Glucose 500 mL (Baxter (China) Investment Co., Ltd., Shanghai, China); amino acids – amino acid 15-AA 250 mL:20 g (8 %; Hunan Kelun Pharma Co., Ltd, Yueyang City, China); and lipid – Intralipid® 10 g/dL (Sino-Swed Pharmaceutical Corporation, Ltd., Wuxi City, China). The final concentrations of dextrose, protein, and lipid were the same as for OLIVE.
Electrolytes, vitamins, and trace elements could be added to the study treatment or compounded PN based upon patient requirements. The study treatment was infused through a peripheral IV catheter via a control pump. If continued infusion via a peripheral IV was not possible, the study treatment could be infused via a peripherally-inserted central catheter or central IV line.
Study treatment was administered for a minimum of five days and up to a maximum of 14 days (either 14 days after surgery or 14 days total for patients who did not undergo surgery). Study treatment could be initiated up to three days before surgery and was administered after surgery on Day 1 at Hour 0. Preoperative PN was not mandatory and if a patient did not receive study treatment before surgery, or if the patient was not scheduled for surgery, study treatment was initiated on Day 1 at Hour 0.
From Day 0 to Day 5, patients were not to receive any food or liquid oral or enteral nutrition. The goal of treatment was to deliver 25 kcal/kg/day, 0.9 g/kg/day amino acids, and 0.8 g/kg/day lipid. The patients were allowed water and ice chips based on the clinical judgment of the Investigator.
From Day 6 through the remainder of the study treatment period, liquid oral or enteral nutrition could be added to the study treatment. The intent was to supply the total calculated daily nutritional requirement with study treatment (intravenous nutrition) plus liquid oral or enteral nutrition. Liquid oral or enteral nutrition was increased daily, as tolerated by the patient, with a concurrent reduction in study treatment, while still supplying the calculated daily nutritional requirement.
Study treatment was ceased once the patient was able to achieve ≥80 % of the calculated daily nutritional requirements by administered liquid oral or enteral nutrition, or the completion of Day 14 study treatment, whichever occurred earlier.
Randomization
Assignment of study treatment was delegated by Baxter Healthcare Corporation to the study site pharmacist. Patient numbers were allocated using an Interactive Voice Recognition System/Interactive Web-based Recognition System according to the randomization code contained within the randomization list.
This was an open-label study. Treatment assignment was not known (ie, blinded) by the data management, biostatistical, and personnel at the central laboratory. In order to prepare the study treatment, the designated pharmacist was aware of the study treatment (unblinded). The study treatment was unblinded to the Investigator as it was standard practice that the physician and/or nurse carefully inspect the PN admixture to ensure that the integrity of the admixture was maintained throughout the length of the infusion.
Outcome measures
The primary efficacy variable was the serum prealbumin level at Day 5. Secondary efficacy outcome(s) included preparation time of study treatment, time to achieve tolerability of oral nutrition, length of hospitalization, lipids and lipid upper derivatives (arachidonic acid, eicosapentaenoic acid [EPA], linoleic acid, oleic acid), markers of infection and inflammation (cortisol, CRP, procalcitonin, serum ICAM-1, IL-6), markers of oxidative stress (malondialdehyde, F2-isoprostane), surrogate markers of nutrition (albumin, IGF-1), urine markers of metabolism (6-h urinary urea, 3-methylhistidine), and injection site rating by the Investigator. Safety outcomes included total adverse events (AEs), liver function, and infections. Infections were based upon the clinical judgment of the investigators and utilized cultures when possible. Antibiotics were administered for all infections. Lung infections were defined as: the new onset of fever and/or leukocytosis with or without alterations in mentation, purulent sputum or organisms on smear or culture, and a new progressive or persistent infiltrate on chest X-ray consistent with pneumonia (with no other obvious cause). Scrotal infection was diagnosed by the presence of fever and/or leukocytosis, new evidence of infection in the scrotum (pain, tenderness, swelling, heat, redness), and no other recognized cause for the abnormality. Non-specific infection was diagnosed in a patient with new fever, leukocytosis, tachycardia, tachypnea and no other obvious cause for the abnormalities, and a response to antibiotic treatment. These outcomes were approved by the China State Food and Drug Administration as being sufficient to register the OLIVE product in China.
Statistical analysis
A sample size of approximately 200 patients (98 per study treatment) would provide 90 % power to claim noninferiority between groups for prealbumin at Day 5. The primary comparison was that OLIVE was not inferior to the SOYBEAN in maintaining or increasing serum prealbumin levels. In the sample size calculation, it was assumed that the true ratio was 1, the coefficient of variance (CV) was 0.5, and the non-inferiority margin was −20 %. These assumptions resulted in a sample size of 98 patients per study treatment. It was decided to enroll at least 200 patients per treatment group with an evaluable primary endpoint to generate additional clinical data for this study. The sample size was calculated by PASS version 2011. Approximately 500 subjects were randomized to achieve 400 subjects who had efficacy assessments on Day 5, assuming up to 20 % of randomized subjects would drop out of the study before the Day 5 assessments.
The primary comparison was that OLIVE is not inferior to SOYBEAN in maintaining or increasing serum prealbumin levels. Noninferiority was claimed if the anti-log of the lower bound of the 95 % confidence interval (CI) of the treatment difference was at least 0.80.
Analyses were performed on the intention-to-treat population (ITT), defined as all patients randomized. The primary efficacy analyses were based on the modified intention-to-treat (mITT) population, defined as all ITT patients who received study treatment and provided some efficacy data. The per protocol (PP) population was defined as the subset of ITT patients who had no major protocol violations and had Day 5 efficacy data. All safety analyses were conducted on the safety population, defined as all patients who received any amount of study treatment.
Unless otherwise stated, all statistical analyses were performed using a two-sided hypothesis test at the 5 % level of significance. No adjustment for Type I error rate was required for the analysis of the primary endpoint because the study had only one primary endpoint with one comparison. Due to the large sample size there was no need to test the model assumptions (ie, normality test).
The primary efficacy variable was the serum prealbumin level at Day 5. The log transformed primary efficacy variable was analyzed via an analysis of covariance (ANCOVA) model with treatment and study site as the main effects and baseline serum prealbumin as the covariate. The least square (LS) mean ± standard deviation (SD) estimates of the treatment effects for OLIVE and the control, as well as the two-sided 95 % CI of the geometric mean ratio of test/control was derived.
Preparation time of study treatment (Days 1 to 5) and length of hospitalization were summarized by treatment group. Differences between treatment groups were analyzed using Kruskal-Wallis test. Time to achieve tolerability of oral nutrition was summarized using the Kaplan-Meier method and compared using a log-rank test. Other secondary efficacy variables were analyzed the same way as the primary variable with change from baseline and ANCOVA model on log-scale with baseline as covariate and treatment and study site as main effects. Injection site rating by the Investigator was analyzed using the Cochran-Mantel-Haenszel test with modified ridit scores.
For the safety analyses, statistical comparisons were performed between the two treatment groups. Continuous data were compared using an ANOVA and categorical data were compared using a Chi-square test/Fisher's exact test. AE relationship and severity were compared using Cochran-Mantel-Haenszel test with modified ridit scores. AEs were coded according to the Medical Dictionary for Regulatory Activities (MedDRA).
All statistical analyses were completed using SAS version 9.2 (SAS Institute Inc, Cary, North Carolina USA).
Results
Patient disposition
A total of 480 patients consented (Fig. 1) and 458 patients were enrolled and randomized into the study. All randomized patients were included in the ITT population, 226 (100.0 %) patients in the OLIVE group and 232 (100.0 %) patients in the SOYBEAN group. The safety population comprised 222 (98.2 %) patients in the OLIVE group and 231 (99.6 %) patients in the SOYBEAN group. The mITT population comprised 219 (96.9 %) patients in the OLIVE group and 224 (96.6 %) patients in the SOYBEAN group. The PP population comprised 183 (81.4 %) patients in the OLIVE group and 190 (81.9 %) in the SOYBEAN group. Similar percentages of patients discontinued from the study in the OLIVE group (8.8 %) and the SOYBEAN group (10.3 %). The main reasons for discontinuation in both groups were patient withdrew consent and AEs (Fig. 1).Figure 1. Patient disposition flowchart
Demographic and baseline clinical characteristics
The demographic and baseline clinical characteristics of patients in the OLIVE and the SOYBEAN groups (ITT population) were not different (Table 1). Most patients were male (61 %, 279/458), identified as Chinese Han (95 %, 436/458), and had a mean age of 56 years. Most patients underwent surgery and experienced high complexity surgery (62 %, 283/458) with a mean duration of 3 h.Table 1. Patient Demographics and Baseline Characteristics of the Intention to Treat PopulationVariableOLIVE(n = 226)SOYBEAN(n = 232)P ValueSex, n (%)0.482 Male134 (59.3)145 (62.5) Female92 (40.7)87 (37.5)Race, n (%)0.673 Chinese Han216 (95.6)220 (94.8) Chinese other minority8 (3.5)11 (4.7) Other2 (0.9)1 (0.4)Age, years, mean ± SD55.8 ± 13.156.3 ± 11.70.656BMI, kg/m^2^, mean ± SD21.7 ± 3.9^a^21.8 ± 3.9^b^0.667Underwent surgery, n (%)195 (86.3)202 (87.1)0.805Complexity of surgery^c^, n (%)0.859 Medium complexity49 (21.7)48 (20.7) High complexity140 (61.9)143 (61.6) Missing37 (16.4)41 (17.7)Duration of surgery, hours, mean ± SD2.9 ± 1.33.0 ± 1.40.645Abbreviations: BMI body mass index, SD standard deviation^a^n = 217^b^n = 226^c^Complexity of surgery was determined by the investigator based on patient and surgical characteristics
Nutritional intakes
Treatment exposure and doses administered were similar between the treatment groups. The mean ± SD durations of study treatment exposure were 8.4 ± 3.7 days in the OLIVE group and 8.2 ± 3.7 days in the SOYBEAN group. The mean ± SD doses administered were 16761.0 ± 7086.8 mL in the OLIVE group and 16877.5 ± 7453.0 mL in the SOYBEAN group. There were no statistically significant differences in the mean ± SD flow rate, total volume prescribed, total volume administered, volume ratio (prescribed/administered volume), total duration prescribed, total duration administered, or duration ratio (prescribed/administered duration) between the treatment groups (data not shown). There was no statistically significant difference between the time to achieve adequate enteral intake (following 5 days of PN) for the OLIVE group and the SOYBEAN group (median time: OLIVE 2.0 days versus SOYBEAN 2.0 days; log rank P = 0.786).
Anabolic/catabolic endpoints
OLIVE was noninferior to SOYBEAN in maintaining or increasing serum prealbumin levels at Day 5 in the mITT population (LSGM ratio and [95 % CI] 1.12 [1.06, 1.19]; P = 0.0002) and the PP population (LSGM and [95 % CI] 1.12 [1.05, 1.19], P = 0.0006) (Fig. 2). This observation was consistent in the subgroup analyses of age, gender, no surgery, surgery of medium complexity, and surgery of high complexity (Fig. 2).Figure 2OLIVE efficacy in the modified intention-to-treat population and prespecified subgroups. Mean ± SD prealbumin levels on Day 5. LSGM ratio and 95 % CI for the comparison of OLIVE versus SOYBEAN. The LSGM ratio is the antilog of (log (GM) ± 1.96SE). The P value for group difference was adjusted for baseline values and study sites. Abbreviations: CI confidence interval, LSGM least square geometric means, mITT modified intention-to-treat, PN parenteral nutrition, SD standard deviation, SE standard error
Serum prealbumin levels and serum albumin levels were significantly higher in the OLIVE group compared with the SOYBEAN group at Day 5 (Table 2). Prealbumin and albumin increased in the OLIVE group and decreased in the SOYBEAN group. No significant difference in serum IGF-I levels were observed between the treatment groups at Day 5; however, at end of therapy (EOT)/Day 14, serum IGF-I levels were significantly higher in the OLIVE group compared with the SOYBEAN group. No significant between-group differences were observed in the 6-h urinary urea nitrogen and 6-h urinary excretion of 3-methylhistidine (Table 2).Table 2. Effects of OLIVE and SOYBEAN on Markers of Nutrition in Patients Receiving Parenteral NutritionNutrition MarkerOLIVESOYBEANOLIVE vs SOYBEANVisit N Mean ± SD N Mean ± SDLSGM Ratio (95 % CI)P-valueAlbumin (g/L)Baseline21433.11 ± 5.7522033.23 ± 5.84.Day 521134.02 ± 5.3221632.93 ± 5.151.04 (1.01, 1.07)0.0139EOT/Day 148235.37 ± 5.867835.55 ± 5.31 (0.96, 1.05)0.9393Prealbumin (mg/dL)Baseline21315.08 ± 4.6421915.15 ± 5.01.Day 521715.66 ± 5.1221813.95 ± 5.051.12 (1.06, 1.19)0.0002EOT/Day 1421017.24 ± 6.8221915.15 ± 6.371.16 (1.08, 1.24)0.0001Prealbumin (PP) (mg/dL)Baseline18214.82 ± 4.5818814.97 ± 5.02.Day 518415.7 ± 5.0119014.19 ± 5.061.12 (1.05, 1.19)0.0006EOT/Day 1418417.38 ± 6.9619315.37 ± 6.431.16 (1.07, 1.25)0.0002IGF-I (ug/L)Baseline214107.31 ± 49.61220110.9 ± 55.34.Day 5211125.81 ± 64.35218121.15 ± 61.111.04 (0.96, 1.13)0.3437EOT/Day 1482142.9 ± 70.1678125.27 ± 65.221.16 (1, 1.35)0.0456-h urea nitrogen, urine (mmol/L)Baseline211124.02 ± 92.1218129.39 ± 78.47.Day 5211141.95 ± 100.85216151.82 ± 98.150.91 (0.8, 1.03)0.1271EOT/Day 1481150.4 ± 100.1976144 ± 101.811 (0.82, 1.23)0.97976-h 3-Methylthistidine, urine (ug/mL)Baseline2111.32 ± 2.612171.37 ± 1.56.Day 52121.44 ± 4.292161.11 ± 0.981.02 (0.9, 1.14)0.7791EOT/Day 14811.98 ± 2.18771.74 ± 4.41.1 (0.87, 1.38)0.4224Abbreviations: CI confidence interval, EOT end of therapy, IGF-I insulin-like growth factor-I, LSGM least square geometric mean, PP per protocol, SD standard deviation
Lipid endpoints
Significant increases in serum oleic acid levels were observed for both treatment groups; however, the increases in the OLIVE group were greater than those observed in the SOYBEAN group (Table 3). No statistically significant differences in serum levels of linoleic acid, arachidonic acid, and EPA were observed between treatment groups at any timepoint (Table 3).Table 3. Effects of OLIVE and SOYBEAN on Serum Free Fatty Acid Levels in Patients Receiving Parenteral NutritionFree Fatty AcidOLIVESOYBEANOLIVE vs SOYBEANVisit N Mean ± SD N Mean ± SDLSGM Ratio (95 % CI)P-valueArachidonic Acid (ng/mL)Baseline2142582.36 ± 1628.432192435.61 ± 1691.17.Day 52111647.86 ± 1169.392171657.64 ± 1109.070.96 (0.83, 1.1)0.5511EOT/Day 14821907.33 ± 1503.86782061.49 ± 1368.590.82 (0.64, 1.06)0.127Eicosapentaenoic Acid (ng/mL)Baseline2146238.86 ± 10452.352195162.16 ± 3904.17.Day 52115492.24 ± 4259.412175490.93 ± 3916.91.05 (0.91, 1.21)0.5148EOT/Day 14825604.48 ± 5433.61784451.74 ± 3218.581.04 (0.75, 1.43)0.8314Linoleic Acid (ng/mL)Baseline214114371.89 ± 81968.03219106834.77 ± 74014.98.Day 5211122618.72 ± 74778.06217138023.51 ± 84529.990.89 (0.77, 1.04)0.1543EOT/Day 1482120846.77 ± 101009.5478122106.26 ± 73206.470.76 (0.53, 1.09)0.1369Oleic Acid (ng/mL)Baseline21470758.12 ± 85210.5721963562.45 ± 44727.06.Day 521185697.52 ± 52610.1921771773.72 ± 45452.381.22 (1.09, 1.37)0.0006EOT/Day 148281704.84 ± 58732.767863696.58 ± 450501.11 (0.81, 1.51)0.517Abbreviations: CI confidence interval, EOT end of therapy, LSGM least square geometric mean, SD standard deviation
Inflammation, oxidation, and infections
There was a very small but significant difference at Day 5 in the serum levels of IL-6 observed between the OLIVE and the SOYBEAN groups (Table 4). In both groups, IL-6 levels decreased. No significant differences in the serum levels of cortisol, procalcitonin, CRP, or ICAM-1 were observed between treatment groups. No significant differences in the serum levels of malondialdehyde or F2-isoprostane were observed at Day 5 or EOT/Day 14 (Table 4).Table 4. Effects of OLIVE and SOYBEAN on Markers of Inflammation and Infections in Patients Receiving Parenteral NutritionMarkerOLIVESOYBEANOLIVE vs SOYBEANVisit N Mean ± SD N Mean ± SDLSGM Ratio (95 % CI)P-valueCortisol (nmol/L)Baseline214492.98 ± 284.67219499.61 ± 256.24.Day 5212371.97 ± 145.68218362.98 ± 130.291.02 (0.95, 1.1)0.5677EOT/Day 1482382.37 ± 193.8878395.31 ± 155.080.9 (0.77, 1.04)0.1617C-Reactive protein (mg/L)Baseline21454.56 ± 54.4622056 ± 51.13.Day 521142.33 ± 42.921647.17 ± 42.980.95 (0.81, 1.12)0.5503EOT/Day 148220.95 ± 34.447821.92 ± 31.230.9 (0.62, 1.31)0.5785Procalcitonin (ng/mL)Baseline2140.91 ± 1.842191.19 ± 2.67.Day 52120.36 ± 0.972180.44 ± 1.290.98 (0.86, 1.11)0.717EOT/Day 14820.15 ± 0.2780.28 ± 1.10.88 (0.71, 1.11)0.283sICAM-1 (ug/L)Baseline214264.37 ± 127220260.97 ± 128.62.Day 5209321.56 ± 158.86217304.41 ± 154.531.02 (0.94, 1.1)0.6462EOT/Day 1481337.84 ± 152.5878352.73 ± 197.270.96 (0.85, 1.08)0.4683Interleukin-6 (ng/L)Baseline214143.03 ± 271.46220191.72 ± 705.37.Day 521119.63 ± 57.5821820.11 ± 44.190.82 (0.69, 0.96)0.0173EOT/Day 14NDNDNDNDNDNDMalondialdehyde (nmol/L)Baseline21412.46 ± 25.221911.4 ± 21.93.Day 521113.57 ± 27.6521712.49 ± 23.130.97 (0.87, 1.08)0.5865EOT or Day 148212.65 ± 27.817810.77 ± 21.680.86 (0.71, 1.04)0.115F2-Isoprostane (ng/mL)Baseline2140.13 ± 0.172190.11 ± 0.14.Day 52110.19 ± 0.332170.14 ± 0.21.13 (0.85, 1.5)0.4006EOT/Day 14820.16 ± 0.21780.18 ± 0.290.9 (0.58, 1.4)0.6502Abbreviations: CI confidence interval, EOT end of therapy, LSGM least square geometric mean, ND not detected, SD standard deviation, sICAM serum intercellular adhesion molecule-1
Significantly more patients in the SOYBEAN group (10.4 % [24/231]) than the OLIVE group (3.6 % [8/222]) experienced an infection or infestation (Table 5). Overall, the frequency of infections in the study was low (7.1 % [32/453]). The most common infections were lung infections, which were higher in the SOYBEAN group. The second most common infection was incision/wound infections. Bloodstream infections were not reported to occur in the study.Table 5. Treatment Emergent InfectionsInfection, n (%)OLIVE(n = 222)SOYBEAN(n = 231)Total infections826Total patients infected8 (3.6 %)24 (10.4 %)Lung infections213Incision/wound site infections53Urinary tract infections12Abdominal/gastrointestinal infections02Scrotal infections01Nonspecified infections (systemic infection, site not identified)05**P <0.01
Preparation time
The preparation time for study treatment was significantly less for OLIVE compared with the SOYBEAN on all days assessed (P <0.001 for all values [Fig. 3]).Figure 3. Preparation time of study treatment (Day 1 through Day 5).*P <0.05 by Kruskal-Wallis. Error bars indicate standard deviations
Hospital time and mortality
There were no significant differences between the OLIVE group and the SOYBEAN group for the length of hospitalization from admission to discharge or for the length of hospitalization from randomization to discharge (Table 6). Five patients died during the study; one patient in the OLIVE group (cardiopulmonary failure) and four patients in the SOYBEAN group (severe pharyngeal hemorrhage, severe abdominal infection, severe hypovolemic shock and severe acute renal failure).Table 6. Effects of OLIVE and SOYBEAN on Hospital Time in Patients Receiving Parenteral NutritionLength of HospitalizationOLIVESOYBEANOLIVE vs SOYBEAN N Mean ± SDMedian N Mean ± SDMedianP-valueFrom admission to discharge, days21916.92 ± 4.991622418.1 ± 8.65160.7823From randomization to discharge, days21910.84 ± 4.271022412.04 ± 7.82100.4854Abbreviations: SD standard deviation
Safety endpoints
Safety and tolerability
Overall, the safety and tolerability profile of OLIVE was similar to SOYBEAN. The most common treatment-emergent AEs (TEAEs) occurring in greater than 5 % of patients in both groups were pyrexia and infusion site swelling (Table 7). Discontinuations from the study were low, with seven patients in the OLIVE group and nine patients in the SOYBEAN group discontinuing from the study due to AEs.Table 7. Study Drug-Related Adverse Events in the Safety PopulationSystem Organ Class Preferred TermOLIVESOYBEANFrequency^a^n (%)^b^Frequency^a^n (%)^b^General disorders and administration site conditions16485 (38.3)15789 (38.5) Swelling6019 (8.6)5017 (7.4) Pyrexia3833 (14.9)4035 (15.2) Infusion site swelling2016 (7.2)2624 (10.4)Gastrointestinal disorders6543 (19.4)7250 (21.6) Nausea2217 (7.7)1917 (7.4)Vascular disorders4733 (14.9)6541 (17.7) Phlebitis2412 (5.4)3112 (5.2) Peripheral vascular disorder1413 (5.9)2322 (9.5)Metabolism and nutrition disorders3528 (12.6)6042 (18.2) Hypokalemia33 (1.4)1818 (7.8)Investigations4127 (12.2)3826 (11.3) Gamma-glutamyltransferase increased1111 (5.0)77 (3.0)Injury, poisoning and procedural complications4427 (12.2)3025 (10.8) Procedural pain2112 (5.4)97 (3.0) Incision site pain1612 (5.4)1210 (4.3)Respiratory, thoracic and mediastinal disorders3123 (10.4)2620 (8.7) Productive cough1414 (6.3)1111 (4.8) Cough1111 (5.0)1111 (4.8)Infections and infestations88 (3.6)2624 (10.4)Hepatobiliary disorder1313 (5.9)77 (3.0)^a^Number of events^b^Number and percentage of patients with at least one event
There were no differences between groups in the severity of TEAEs (P = 0.073) or in the relationship of TEAEs to study treatment (P = 0.393) as considered by the Investigators. Most TEAEs were considered to be mild in severity in both the OLIVE group (77.6 % [125/222] patients) and the SOYBEAN group (69.8 % [118/231] patients). Severe TEAEs were reported in 2/222 (1.2 %) patients in the OLIVE group and 10/231 (5.9 %) patients in the SOYBEAN group. The severe TEAEs reported by the two patients in the OLIVE group were cardiopulmonary failure and acute myocardial infarction. The severe TEAEs reported by the ten patients in the SOYBEAN group were epistaxis, pharyngeal hemorrhage, urinary tract infection, abdominal infection, hypovolemic shock, lung infection, pyrexia, hypokalemia, hypernatremia, ureteric fistula, renal failure acute, vomiting, and intestinal fistula.
Eight patients in the OLIVE group and 14 patients in the SOYBEAN group experienced serious AEs (SAEs). Overall, each SAE was reported by ≤1.1 % of patients. All reported SAEs were considered by the Investigator to be not associated or unlikely to be related to the study treatment. Most SAEs were considered by the Investigator to be moderate or severe and recovered/resolved with no sequelae by the end of the study.
Systemic safety
Alanine aminotransferase and aspartate aminotransferase were higher in the SOYBEAN group at baseline (Table 8). There were no statistically significant differences between groups at Day 5 or EOT/Day 14 and mean values were within normal limits or only slightly above the normal range. However, when analyzed for change from baseline, alanine aminotransferase was significantly different between groups at Day 5 and EOT/Day 14, whereas aspartate aminotransferase was not significantly different between groups. Alkaline phosphatase was similar between groups at baseline. Levels were significantly different between groups at Day 5 but not at EOT/Day 14. Most values were within normal ranges. Gamma-glutamyltransferase was within normal limits for most patients and similar between groups at baseline. When analyzed by change from baseline, gamma-glutamyltransferease values were higher in the OLIVE group than in the SOYBEAN group at Day 5, but not at EOT/Day 14. Total bilirubin was similar between groups at all time points. Blood urea nitrogen was similar between groups at baseline. When analyzed by change from baseline, blood urea nitrogen values were higher in the OLIVE group at Day 5 but not at EOT/Day 14. Most values remained within normal limits throughout the study. Creatinine remained normal in both groups throughout the study; there were no differences between groups.Table 8. Absolute Serum Chemistry Measures in the Modified Intention to Treat PopulationSerum Chemistry MeasureOLIVESOYBEANOLIVE vs SOYBEANVisit N Mean ± SD N Mean ± SDLS Mean ± SE (95 % CI)P-valueAlanine aminotransferase, U/LBaseline21241.4 ± 87.1521673.3 ± 197.14Day 57931.0 ± 27.868529.2 ± 55.4121.3 ± 6.89 (7.7, 34.9)0.002EOT/Day 1420148.8 ± 61.2319638.5 ± 38.7042.5 ± 15.24 (12.5, 72.5)0.006Alkaline phosphatase, U/LBaseline21072.5 ± 46.8721271.7 ± 35.65Day 57987.7 ± 58.278574.7 ± 40.4118.8 ± 5.65 (7.7, 30.0)0.001EOT/Day 14201123 ± 96.24196106.9 ± 70.8911.6 ± 7.72 (−3.6, 26.8)0.133Aspartate aminotransferase, U/LBaseline21052.8 ± 117.3821272.3 ± 191.38Day 57931.9 ± 19.278522.6 ± 15.8222.4 ± 8.87 (4.9, 40.0)0.12EOT/Day 1420135.8 ± 39.4219630.6 ± 35.1325.5 ± 17.25 (−8.5, 59.4)0.141γ-Glutamyltransferase, U/LBaseline21039.2 ± 74.6321242.7 ± 70.32Day 579100.5 ± 136.628568.9 ± 71.6934.9 ± 11.96 (11.3, 58.5)0.004EOT/Day 14201139.2 ± 165.89196118.1 ± 140.6512.4 ± 13.45 (−14.1, 38.8)0.358Total bilirubin, μmol/LBaseline21218.00 ± 15.9821616.12 ± 10.69Day 57913.21 ± 9.768511.86 ± 9.56−0.39 ± 1.50 (−3.35, 2.56)0.793EOT/Day 1420112.86 ± 9.3419613.87 ± 18.94−2.97 ± 1.42 (−5.76, −0.19)0.36Blood urea nitrogen, mmol/LBaseline2123.63 ± 2.072163.88 ± 1.91Day 5854.21 ± 2.51924.35 ± 2.710.51 ± 0.24 (0.03, 0.99)0.039EOT/Day 142005.23 ± 2.471954.93 ± 2.270.38 ± 0.21 (−0.03, 0.79)0.072Creatinine, μmol/LBaseline21267.8 ± 23.621867.4 ± 21.1Day 711062.0 ± 15.811260.2 ± 17.4−2.3 ± 2.7 (–7.5, 3.0)0.40EOT/Day 1420062.6 ± 16.519562.2 ± 16.7−0.7 ± 1.7 (-4.1, 2.7)0.69Chloride, mmol/LBaseline212104.4 ± 4.33216103.7 ± 4.39Day 585101.4 ± 3.5593102.4 ± 4.53−1.6 ± 0.73 (−3.1, −0.2)0.027EOT/Day 14200101.0 ± 3.55194101.8 ± 5.03−1.3 ± 0.59 (−2.5, −0.1)0.030Phosphorus, mmol/LBaseline1551.07 ± 0.261621.15 ± 0.79Day 5831.21 ± 0.47890.98 ± 0.450.25 ± 0.09 (0.09, 0.42)0.003EOT/Day 141831.26 ± 0.211761.20 ± 0.320.17 ± 0.08 (0.00, 0.34)0.044Potassium, mmol/LBaseline2124.58 ± 9.072163.98 ± 0.47Day 5854.35 ± 0.57933.95 ± 0.530.43 ± 0.10 (0.23, 0.63)<0.001EOT/Day 142014.97 ± 9.161944.06 ± 0.530.28 ± 0.06 (0.15, 0.40)<0.001Total cholesterol, mmol/LBaseline2063.52 ± 0.952103.60 ± 0.89Day 5773.48 ± 0.96847.60 ± 38.15−4.35 (−13.47, 4.77)0.348EOT/Day 141963.76 ± 0.901883.6 ± 0.940.20 (0.02, 0.39)0.029Triglycerides, mmol/LBaseline2060.89 ± 0.532110.91 ± 0.58Day 5771.89 ± 0.95851.51 ± 0.680.41 (0.19, 0.63)<0.001EOT/Day 142001.72 ± 0.881931.50 ± 0.670.25 (0.09, 0.40)0.002Abbreviations: CI confidence interval, EOT end of treatment, LS least squares, SD standard deviation, SE standard error
For the change from baseline in serum electrolytes, statistically significant differences in chloride (Day 5 and EOT/Day 14), phosphorus (Day 5 and EOT/Day 14), and potassium (Day 5 and EOT/Day 14) were observed (Table 8). Bicarbonate, chloride, phosphorus, potassium, and sodium levels were within normal limits in both treatment groups at Day 5 and EOT/Day 14.
Cholesterol increased more in the OLIVE group compared to the SOYBEAN group, but values remained within normal limits in most patients (Table 8). Triglyceride levels increased in both groups, reflecting the triglyceride content of the lipid emulsions. Values were slightly, but significantly higher in the OLIVE group compared to the SOYBEAN group. No patient withdrew from the study due to lipid abnormalities (ie, elevated cholesterol or triglycerides) and none of the PN infusions required adjustment for lipid levels.
No statistically significant differences (all P >0.05) between the OLIVE group and SOYBEAN group were observed for serum glucose or insulin use (Table 9). In addition, there were no significant differences between groups for insulin levels in the blood or hematological measures (basophils, neutrophils, eosinophils, lymphocytes, monocytes, platelets, hemoglobin, and hematocrit). Absolute counts for basophils, eosinophils, lymphocytes, monocytes, and neutrophils remained within normal ranges in both treatment groups (data not shown).Table 9. Serum Glucose Concentrations (mmol/L) and Insulin Use^a^ n OLIVEMean ± SD n SOYBEANMean ± SDP-value (change from baseline between groups)Baseline2127.1 ± 2.32167.2 ± 2.3Day 32078.6 ± 3.12188.4 ± 3.50.74Day 71106.7 ± 2.61127.0 ± 2.70.13EOT or Day 142016.3 ± 2.21936.9 ± 3.00.09Patients requiring insulin41 (18.5 %)–48 (20.8 %)–^a^Values are not significantly different at any time point; Abbreviations: EOT end of treatment, SD standard deviation
Discussion
This is the largest prospective, randomized, open-label, controlled, multi-center study to date that compares two lipid emulsions used as part of complete PN; an olive oil-based lipid emulsion PN regimen and a soybean oil-based lipid emulsion PN regimen. Overall, OLIVE was not inferior to SOYBEAN for prealbumin levels, improved the anabolic/catabolic status of patients enrolled in the study, and was well tolerated compared with SOYBEAN. The improvement in anabolic status for the OLIVE group was indicated by higher levels of the protein endpoints of prealbumin, albumin, and IGF-1. The lack of difference in urinary excretion of urea and 3-methylhistidine between the groups suggests that catabolism was similar in each group. CRP, ICAM-1, procalcitonin, and oxidation were similar in each group, but infections were significantly lower with OLIVE. Oleic acid levels increased with OLIVE; but linoleic acid, arachidonic acid, and EPA were similar between groups. OLIVE was associated with shorter preparation times compared with the compounded SOYBEAN admixture.
Prealbumin was chosen as the primary endpoint for the study following discussion with a number of experts. Serum prealbumin levels are determined by a variety of factors, including synthesis, degradation, and tissue distribution. Synthesis is dependent upon supply of amino acids to the liver and activation of prealbumin synthetic pathways. During metabolic stress, as occurs with illness and surgery, activation of inflammatory pathways (especially IL-6) increase prealbumin degradation, limit it’s synthesis, and may increase tissue distribution by leakage into tissues (increased vascular permeability) [17]. Lipid emulsions and other components of PN have been shown to modulate endothelial permeability, inflammation, anabolism, catabolism, and immune cell functions [18]. As a result, prealbumin was thought to be a composite indicator of amino acid supply, protein synthetic capacity, catabolism, and inflammation. All of these endpoints are important targets for nutrition support and were assessed in this study. Anabolism was assessed with prealbumin, albumin, and IGF-1 levels; catabolism was assessed with nitrogen excretion and 3-methylhistidine excretion. In addition, we also assessed other endpoints that included infections, hospital stay, morbidities (AEs), mortality, organ function (renal, hepatic, hematologic), and metabolic status (oxidation, fatty acids, cholesterol, triglycerides, glucose, insulin, electrolytes).
OLIVE was associated with significant increases in prealbumin, albumin, and IGF-I compared with SOYBEAN. As no difference between groups for catabolic markers were noted, these results would suggest that the effects of OLIVE are likely to be mediated by anabolism. IGF-I is particularly sensitive to protein intake and responds rapidly to protein energy status [19]. This is the first study to compare the effects of an olive oil-based PN regimen with a soybean oil-based PN regimen on serum IGF-I levels. While numerous studies have reported the positive nutritional effects of OLIVE on one or perhaps two nutritional markers [8, 20–22], this is the first study to examine both anabolic and catabolic marker profiles and one of the first studies to demonstrate that OLIVE is effective in increasing anabolism in critically ill patients. The exact mechanism for the differences in anabolism are unclear, but may relate to the high ω-6 PUFA levels in the SOYBEAN versus OLIVE emulsion that may exacerbate the inflammatory response to surgery and illness.
The physiologic response to injury is an acute phase reaction (APR) mediated by a sudden increase in cortisol and the production of proteins such as CRP and cytokines (IL-1, IL-6, tumor necrosis factor-α [TNFα]). APR proteins have direct effects on catabolism and inflammatory pathways and, therefore, play a role in nutritional status, particularly in critically ill patients where malnutrition and systemic inflammation coexist [19]. Both OLIVE and SOYBEAN were associated with decreases in cortisol, CRP, and IL-6 levels. The effects of OLIVE and SOYBEAN on APR proteins were consistent with a prior smaller study that showed both lipid formulations were associated with decreases in CRP and TNFα [21]. Prior studies have also shown that OLIVE significantly lowers IL-6 levels compared with a medium chain triglyceride/long chain triglyceride (MCT/LCT) lipid emulsion, but no between-group differences in IL-6 were noted in two studies that compared OLIVE with SOYBEAN [14, 21, 23]. A limited number of acute phase proteins (ie, CRP, IL-6, procalcitonin, ICAM-1, cortisol) were assessed in this study and no differences between levels were observed. Oxidative markers (ie, MDA, F2-isoprostane) were also measured and no differences were found. It is possible that more frequent sampling, measurement of tissue levels rather than blood levels, or measurement of other markers (ie, leukocyte functions) may have shown differences between lipid groups.
SOYBEAN lipid emulsion contains high levels (approximately 54 %) of the ω-6 PUFA, linoleic acid, while OLIVE contains much lower levels (approximately 18 %). It has been hypothesized that the high levels of linoleic acid in SOYBEAN exacerbate inflammation [15, 16, 18, 24, 25] in patients undergoing acute illness and tissue injury (such as major surgery). However, we were unable to detect such exacerbation in this study using conventional inflammatory markers such as cortisol, IL-6, ICAM-1, CRP, and procalcitonin. It is possible that other inflammatory markers (such as leukotrienes) may have been higher in the SOYBEAN group than in the OLIVE group.
Small studies directly comparing olive oil-based lipid emulsions with soybean oil-based lipid emulsions have provided conflicting results, with some studies showing significant reductions in inflammatory and oxidative stress markers [23], while other studies have reported no differences in inflammatory or oxidative stress markers between olive oil-based PN and soybean oil-based PN admixtures [14, 21]. Furukawa and colleagues [12] investigated the impact that the degree of stress associated with surgery had on IL-6 production in patients receiving lipid-free or soybean oil-based PN admixtures. The results of their study showed that soybean oil-based PN significantly increased IL-6 levels in patients experiencing severe stress, but not in patients experiencing moderate stress. Several reasons may account for the differences between prior studies and this study including sample size, differences in the patient populations between the studies, or differences in the level of stress the patients were experiencing.
Measurement of lipids and lipid upper derivatives revealed changes in the levels of fatty acid moieties that were consistent with the lipid source contained in the two PN regimens. Not surprisingly, linoleic acid levels increased in both treatment groups, albeit it to a lesser extent in the OLIVE group. Despite the trend for increased linoleic acid in the SOYBEAN group, arachidonic acid levels decreased similarly in both groups. Thus, supply of larger amounts of linoleic acid with SOYBEAN had no effect upon circulating arachidonic acid levels. The decrease in arachidonic acid levels in both groups suggests that it was being consumed as substrate for the APR. It is important to note that tissue levels of these fatty acids, not measured in this study, may better reflect cellular effects of the fatty acids. Similarly, the significantly greater increase in oleic acid observed in the OLIVE group compared with the SOYBEAN group is consistent with the olive oil contained in OLIVE. Cholesterol and triglycerides are components of the lipid emulsions used in both groups. Cholesterol increased to a greater extent in the OLIVE group; however, differences in levels were small and unlikely to have clinical significance. Cholesterol levels remained within normal limits (ie, <5.2 mmol/L) in most patients. Triglyceride levels increased in both study groups, reflecting the infusion of triglycerides in the lipid emulsions. Levels increased slightly but significantly more in the OLIVE group. Most levels remained below the upper recommended triglyceride level for parenteral nutrition (ie, 3.5–4.5 mmol/L). The greater increase in triglycerides in the OLIVE group likely reflects the slightly slower clearance of olive oil-based triglycerides compared to soybean triglycerides.
One of the most clinically relevant findings of this study was the decreased incidence of infections in the OLIVE group compared to the SOYBEAN group. There were many similarities between the two groups including rate and complexity of surgery, duration of stay in hospital, duration of PN, and glucose levels. Therefore, these factors do not explain the difference in infection rate.
Studies comparing compounded PN with multi-chamber PN have shown that compounded PN is associated with a higher rate of bloodstream infections [26]. However, in this study we did not see a difference in blood stream infections between groups, as most infections were of pulmonary origin followed by incision site infections and urinary tract infections. Small studies have also reported that the use of soybean oil-based lipid emulsions is associated with an increased risk of infections [15]. This effect is believed to be a result of the proinflammatory and immunosuppressive effects of the high linoleic acid content of soybean oil-based emulsions [15, 16, 27]. However, it should be noted that the overall rate of infections in this study was low, as is typically seen in elective surgery populations. Historically, infection rates in patients receiving total PN have been much higher. Prior studies have suggested that lipid emulsions that are high in oleic acid may have less impact on the immune system compared with soybean oil-based lipid emulsions [15, 17, 28, 29]. In contrast, a recent study comparing SOYBEAN with OLIVE reported that there were no differences in immune cell functions in 100 intensive care unit (ICU) patients [21]. Thus, the causes or mechanisms responsible for the different incidences of infection between groups remains unclear.
Manzanares et al. [30] performed a systematic review of randomized clinical studies comparing lipid emulsions with low versus high linoleic acid (n-6 polyunsaturated fatty acid) levels in critically ill patients. However, patients with elective surgery were excluded from the analyses. Thus, the results of this systematic review may not be applicable to elective surgery patients (studied in the present trial). Overall, the lower linoleic acid formulations in the studies demonstrated trends toward lower mortality (relative risk [RR] 0.83, 95 % CI 0.62, 1.11, P = 0.2), duration of mechanical ventilation (−2.57 days, 95 % CI −5.51, 0.37, P = 0.09), and ICU length of stay (−2.31 days, 95 % CI −5.28, 0.66, P = 0.13). There was no difference between formulations for total infections (RR 1.13, 95%CI 0.87, 1.46, P = 0.35). Four of the 12 studies in the review used an olive oil based lipid emulsion and compared it to MCT/LCT (2 trials) or soybean emulsion (2 trials). In this subset of studies, there was no difference between groups for mortality or ICU length of stay. Total infections tended to be higher in the olive group (RR 1.23, 95 % CI 0.92, 1.63, P = 0.16) whereas ventilation time was significantly lower in the olive group (−6.47, 95 % CI −11.4, −1.5, P = 0.01).
The preparation time of PN solutions was significantly less for OLIVE than for the SOYBEAN PN admixture. One of the goals of this study was to assess current methods of PN delivery in Chinese ICUs. Historically, lipid emulsions have been administered separately from the PN solution because of the storage requirements for the emulsion. With the advent of multi-chamber PN systems it is now possible to provide a simultaneous and continuous infusion of all nutrients using a single pump and IV line [31]. Evidence suggests that the use of these systems reduces the risk of microbial contamination due to reduced handling, reduces the risk of bloodstream infections, decreases the risk of error, decreases nursing time, and decreases risk of physical instability of the PN mixture [31–33]. Health economic investigations also suggest that multi-chamber PN systems can reduce costs associated with the manpower required to prepare compounded PN admixtures [34, 35]. When compounding PN admixtures, special attention needs to be paid to aseptic technique, the order of mixing, the presence of residual air in the bag, the type of bag material, and the storage conditions in order to prevent failure or contamination of the admixture. These factors all affect the amount of preparation time needed to prepare these solutions [36, 37]. Further, preparation of compounded admixtures requires specially trained staff and/or specialized automated equipment, whereas use of pre-prepared multi-chamber bag systems only requires proper inspection of the solutions before initiation of the infusion [38].
No differences in the clinical outcomes of length of hospitalization, mortality, or time to achieve tolerability of oral nutrition were observed between the treatment groups. However, other clinically relevant outcomes such as quality of life, functional status, or rehospitalization rates were not assessed in this study. Several small studies have reported that olive oil-based parenteral nutrition is associated with reductions in the duration of mechanical ventilation [22, 39] and length of stay in the ICU [22]. In contrast, other larger studies have reported no difference in the length of hospital stay or ICU length of stay between olive oil-based and soybean oil-based admixtures [21, 26]. However, it is likely that the differences observed between the current study and prior studies relate to the small sample sizes or to the specific patient populations enrolled in the studies.
OLIVE was well tolerated and no significant differences in the frequency or severity of TEAEs were observed between the treatment groups. In addition, the frequency of TEAEs leading to discontinuation of study drug was low. The incidence of hepatobiliary AEs was low and not different between groups. The liver enzymes, alanine aminotransferase and aspartate aminotransferase, were different between groups at baseline but were not significantly different at Day 5 or EOT/Day14. However, when analyzed by change from baseline, values decreased more in the SOYBEAN group, reflecting the higher baseline levels. The cause for the higher baseline levels most likely reflects differences in the underlying disease of the patients. The normalization of these liver enzymes following surgery suggests that they were related to the underlying disease. Alkaline phosphatase and gamma-glutamyltransferase values were similar at baseline. Levels were significantly higher in the OLIVE group at Day 5 but not at EOT/Day 14. Day 5 values reflected only a portion of the patients. Mean values for alkaline phosphatase were within normal limits or minimally elevated. Values for gamma-glutamyltransferase were elevated in both groups at EOT/Day 14. The increase in both enzymes suggests that both PN regimens were associated with mild cholestasis. Cholestasis has been associated with long-term use of PN; however, it is unclear whether the changes reflect the use of PN or reflect changes following abdominal surgery. Importantly, total bilirubin was similar between groups and most patients had values within normal limits. The clinical relevance of these findings is unclear. Perhaps a longer duration of PN would have revealed additional information. Whether these early changes are important in the context of long-term PN cannot be determined from this study; however, short-term PN with OLIVE or SOYBEAN did not appear to negatively impact liver function.
Clinical chemistry measures remained within normal limits in both treatment groups for the duration of the study. Small statistically significant differences were noted between groups and once again, the clinical relevance remains unclear. Of note, potassium and phosphorus levels were better maintained within normal ranges in the OLIVE group compared to the SOYBEAN group. The better maintenance of phosphorus levels may have resulted from the use of organic phosphorus in OLIVE compared with inorganic phosphorus in SOYBEAN. Organic phosphorus has a longer circulation time than inorganic phosphorus since it is not directly filtered in the urine, allowing more time for entry of phosphorus into cells. Overall, the results of the study suggest that OLIVE has a safety profile that makes it suitable for use in ill patients requiring PN.
The internal and external validity of this study are strengthened by the prospective, randomized, controlled, and multi-center study design. Although the study was open label, which may have contributed to bias in the reporting of treatment effects, it was not feasible to conduct a blinded study because it is standard practice that the physician and/or nurse carefully inspect the PN formulations to ensure that the integrity of the admixture (technically an emulsion) is maintained throughout the length of the infusion. In addition, the study is one of the largest (N = 458) to compare the efficacy and safety of two PN regimens in well-matched study populations and there was consistency in the findings across a variety of endpoints. The maximum duration of PN administration was 14 days, which is typical for elective surgery patients who usually receive PN for 7 to 10 days following surgery, as enteral feeding is gradually increased. However, the relatively short duration of follow-up (a maximum of 14 days) may be considered a limitation. Despite this, it is possible that a longer duration of PN administration may have resulted in additional differences between the treatment groups.
In conclusion, OLIVE improved the anabolic/catabolic status of hospitalized adults compared to SOYBEAN and was well tolerated. OLIVE was non-inferior to SOYBEAN for prealbumin and significantly increased prealbumin, albumin, and IGF-I serum levels to a greater extent than SOYBEAN. Inflammation and oxidation were similar in each group, but infections were significantly lower with OLIVE. The results of this study suggest that an olive oil-based PN regimen improves nutritional outcomes, lowers infections, is well tolerated, and confers greater ease-of-use compared with a compounded soybean oil-based PN regimen.
The reference list from the paper itself. Each links out to its DOI / PubMed record.
- 1Berger MM The 2013 Arvid Wretlind lecture: evolving concepts in parenteral nutrition Clin Nutr 201433456357010.1016/j.clnu.2014.03.00524768286 · doi ↗ · pubmed ↗
- 2Jie B Jiang ZM Nolan MT Efron DT Zhu SN Yu K Impact of nutritional support on clinical outcome in patients at nutritional risk: a multicenter, prospective cohort study in Baltimore and Beijing teaching hospitals Nutrition 20102611–121088109310.1016/j.nut.2009.08.02719963351 · doi ↗ · pubmed ↗
- 3Jie B Jiang ZM Nolan MT Zhu SN Yu K Kondrup J Impact of preoperative nutritional support on clinical outcome in abdominal surgical patients at nutritional risk Nutrition 201228101022102710.1016/j.nut.2012.01.01722673593 · doi ↗ · pubmed ↗
- 4Mullen JL Buzby GP Matthews DC Smale BF Rosato EF Reduction of operative morbidity and mortality by combined preoperative and postoperative nutritional support Ann Surg 1980192560461310.1097/00000658-198019250-000046776917 PMC 1344940 · doi ↗ · pubmed ↗
- 5Wu MH Lin MT Chen WJ Effect of perioperative parenteral nutritional support for gastric cancer patients undergoing gastrectomy Hepatogastroenterology 20085582–8379980218613458 · pubmed ↗
- 6Mateu-de Antonio J Grau S Luque S Marin-Casino M Albert I Ribes E Comparative effects of olive oil-based and soyabean oil-based emulsions on infection rate and leucocyte count in critically ill patients receiving parenteral nutrition Br J Nutr 200899484685410.1017/S 000711450783743317916276 · doi ↗ · pubmed ↗
- 7Onar P Yildiz BD Yildiz EA Besler T Abbasoglu O Olive oil-based fat emulsion versus soy oil-based fat emulsion in abdominal oncologic surgery Nutr Clin Pract 2011261616510.1177/088453361039292021266699 · doi ↗ · pubmed ↗
- 8Palova S Charvat J Kvapil M Comparison of soybean oil- and olive oil-based lipid emulsions on hepatobiliary function and serum triacylglycerols level during realimentation J Int Med Res 200836358759310.1177/14732300080360032618534143 · doi ↗ · pubmed ↗