Frontal facial proportions of 12-year-old southern Chinese: a photogrammetric study
Charles Yat Cheong Yeung, Colman Patrick McGrath, Ricky Wing Kit Wong, Erik Urban Oskar Hägg, John Lo, Yanqi Yang

TL;DR
This study measures facial proportions in 12-year-old southern Chinese children to establish norms and identify gender differences.
Contribution
The paper provides population-specific facial proportion indices and highlights gender-based differences in facial structure.
Findings
Girls showed larger values in upper face and nose-related indices compared to boys.
Males exhibited larger lower facial and mandibular indices than females.
Sexual dimorphism in facial proportions was statistically significant in 11 indices.
Abstract
This study aimed to establish norm values for facial proportion indices among 12-year-old southern Chinese children, to determine lower facial proportion, and to identify gender differences in facial proportions. A random population sample of 514 children was recruited. Fifteen facial landmarks were plotted with ImageJ (V1.45) on standardized photos and 22 Facial proportion index values were obtained. Gender differences were analyzed by 2-sample t-test with 95 % confidence interval. Repeated measurements were conducted on approximately 10 % of the cases. The rate of adopted subjects was 52.5 % (270/514). Intraclass correlation coefficient values (ICC) for intra- examiner reliability were >0.87. Population facial proportion index values were derived. Gender differences in 11 of the facial proportion indices were evident (P < 0.05). Upper face-face height (N- Sto/ N- Gn), vermilion…
Genes, proteins, chemicals, diseases, species, mutations and cell lines named across the full text — each resolved to its canonical identifier and authoritative record.
Click any figure to enlarge with its caption.
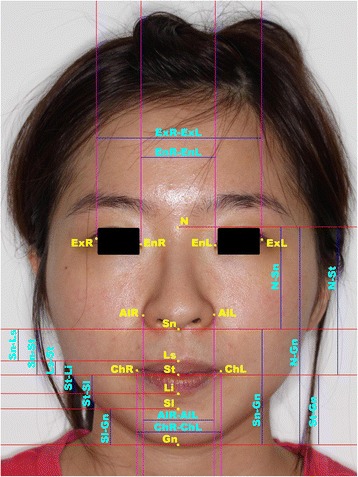 Figure 1
Peer Reviews
No public reviews on file for this paper yet. If you reviewed it on a platform where reviews are public (OpenReview, ICLR, NeurIPS, ICML), you can paste yours below so the community can read it here.
Videos
No videos yet. Explain this paper in a talk, walkthrough, or lecture? Add one.
Taxonomy
TopicsOrthodontics and Dentofacial Orthopedics · Orthodontics and Dentofacial Orthopedics · Forensic Anthropology and Bioarchaeology Studies
Introduction
Facial attractiveness has been a subject of interest since the beginning of recorded history. Bashour reviewed the historical and current literatures and concluded with four important cues that emerge as being the most important determinants of facial attractiveness [1]. They are: (i) averageness, (ii) sexual dimorphism, (iii) youthfulness, and (iv) symmetry. Averageness is regarded as one of the most important factors and supported by various studies [2–6].
Facial attractiveness has long been of central concern to orthodontic and surgical care given that treatments are capable of changing facial appearance and thereby improve facial attractiveness [7]. It is therefore important to establish population norms to address the averageness cue, and provide insight on sexual dimorphism and youthfulness. Symmetry can be assessed clinically without the need of a norm.
Farkas suggested the use of facial proportion indices to assess aesthetics relating to facial proportions in different facial types [8]. Edler quantified facial attractiveness after orthognathic surgery and found, the greater the improvement in facial proportion indices, the better the aesthetic result as judged by orthodontists and maxillofacial surgeons [6]. These post surgical indices correlated closely to Farkas’ findings. Facial proportion is, therefore, important in both clinical diagnosis and treatment outcome evaluation.
Photogrammetry is increasingly being employed to assess facial characteristics [6, 9–14]. It is reported to be valid for many measurements [15, 16], reliable [6, 10–13, 16, 17] and is a practical approach to clinical analyses and comparison [6, 14, 17].
While facial proportion norms are well-established for Caucasian populations [9], it remains paucity for southern Chinese.
The aims of this study were:
- I.To provide a database of norm of facial proportion indices for 12-year-old southern Chinese for surgical and orthodontic diagnosis.
- II.To determine sexual dimorphism in facial proportions.
- III.To determine the lower facial proportion
Materials and method
Sample
This epidemiological study was conducted in Hong Kong SAR, China among 12-year-old children. Ethical approval was obtained by the local IRB committee (UW 09–453). Ten percent of all secondary schools in Hong Kong SAR were randomly selected and children within each selected school were invited to participate. Written informed consent was obtained from parents and children provided their ascent. A sample of 514 (259 males, 255 females) 12-year-old children was recruited. That was approximately 10 % of the Chinese birth cohort since all 12-year-old children in Hong Kong, spread over all secondary schools, are included in the cohort.
Photographic set up
A scale backdrop of 1 cm increments with a plumbline was set up for a camera-subject distance of around 170 cm. The camera used was Canon EOS 400D (Canon, Shimomaruko, Ohta-ku, Tokyo, Japan) with Canon EF-S 60 mm f/2.8 Macro USM Lens and Canon MR-14EX TTL Macro Ring Lite Flash. Subjects were first instructed to a stand with their eyes looking forward to a vertically standing mirror on the side for a natural head posture and then turn their whole body 90° to face the camera with the lip relax. Glasses or other accessories which may obstruct the face were taken away beforehand. The photo was then taken in natural head posture [18].
Selection of landmarks and proportion indices: (Fig. 1)
Fig. 1. Landmarks and proportional indices identified and measured. N : Nasion; Ex (R,L) : Exocanthion (Right, Left); En (R,L) : Endocanthion (Right, Left); Al (R,L) : Alare (Right, Left); Sn : Subnasale; Ls : Labiale superius; Sto : Stomion; Li : Labiale inferius; Ch (R,L) : Cheilion (Right, Left); Sl : Sublabiale; Gn : Gnathion. N.B. The subject of this photograph is not a subject in the study, the photograph is for illustration purpose and consent was obtained
Fifteen landmarks (Fig. 1) as employed by Farkas and Munro [8] were considered; based on key variables considered by Bishara [10–12] (1) visibility in most frontal photographs (2) reliable identification (3) minimally affected by the subject’s grooming, and (4) involved in the measurement of proportional indices of interest. Twenty-two proportion indices (Table 1) employed by Farkas and Munro [8] were selected to be investigated basing on key variables considered by Bishara [10–12], and Edler [6] (1) Measurable on a frontal photographs; (2) reliability; and (3) be potentially changed by the effects of orthodontics and/or orthognathic surgery.Table 1. Descriptions of Facial Proportion Indices abd their respective intraclass correlation coefficients of intra examiner reliabilityIndexDescriptionIntra-examiner reliability (ICC)Upper face-face height indexN- Sto/ N- Gn ×1001Lower face-face height indexSn -Gn/ N-Gn ×1000.99Mandibulo-face height indexSto-Gn/N-Gn ×1001Mandibulo-upper face height indexSto-Gn/N-Sto ×1001Mandibulo-lower face height indexSto-Gn/Sn-Gn ×1000.99Nasal indexAlR-AlL/N-Sn ×1000.88Upper lip height-mouth width indexSn-Sto/ChR-ChL ×1000.98Cutaneous-total upper lip height indexSn-Ls/Sn-Sto ×1000.95Vermilion-total upper lip height indexLs-Sto/Sn-Sto ×1000.95Vermilion-cutaneous upper lip height indexLs-Sto/Sn-Ls ×1000.95Vermilion height indexLs-Sto/Sto-Li ×1000.96Chin-mandible height indexSl-Gn/Sto-Gn ×1000.9Upper face height-biocular width indexN-Sto/ExR-ExL ×1000.99Intercanthal-nasal width indexEnR-EnL/AlR-AlL ×1000.99Nose-face height indexN-Sn/N-Gn ×1000.99Nose-mouth width indexAlR-AlL/ChR-ChL ×1000.98Upper lip-upper face height indexSn-Sto/N-Sto ×1000.98Upper lip-mandible height indexSn-Sto/Sto-Gn ×1000.99Upper lip-nose height indexSn-Sto/N-Sn ×1000.97Lower lip-face height indexSto-Sl/Sn-Gn ×1000.89Lower lip-mandible height indexSto-Sl/Sto-Gn ×1000.9Lower lip-chin height indexSto-Sl/Sl-Gn ×1000.91
Selection of photos
Photos were inspected for their quality and usability in identification of landmarks and validity in measurement of the proportion indices. Photos were excluded if: (1) landmarks were obscured; (2) head tilted up or down significantly; (3) head turned left or right by assessing symmetrical structures; (4) out focused photo; (5) subject wearing glasses; (6) subject showing lip strain or obviously opened mouth; (7) subject smiled; (8) patient partly or completely closed their eyes; and (9) subject previously or currently having orthodontic treatment.
Digitalization of photos
The selected photos were cropped to show the head only. A tangent at superior palpebral sulci was used to determine the vertical level of Nasion [8, 19]. Landmarks were located with ImageJ (V.1.45) (USA National Institutes of Health) and position of each landmark was recorded as a set of X-Y pixel coordinates by the same trained operator. The proportion indices were generated by Microsoft Excel® with the formulas in Table 1.
Statistical analysis
For each facial proportion index, descriptive statistics of mean, standard deviation and range (maximum, minimum) were generated by Statistical Product and Service Solutions (V20) (IBM Corporation, New York, USA). Two sample T- test (with 95 % confidence interval provided) were used to identify any gender difference. The intraclass correlation coefficients [20] were calculated by SPSS (V.19) to assess for intra-examiner reliability, among approximately 10 % of randomly selected subjects that were re-analyzed and compared to original assessments.
Results
Out of 514 subjects, 53 % (270) were included in the analysis, among that, 51 % (137) were female. 47 % (244) were excluded according to the exclusion criteria (as described above). Intra-examiner reliability is presented in Table 1. The intraclass correlation coefficients were all above 0.87 for intra examiner reliability, indicating very good/excellent reliability [20].
Facial proportion index norm values are presented in Table 2. Greatest variance were observed in vermilion cutaneous-upper lip height (Males: 29.58–145.59, Females: 28.81–124.32), vermilion height (Males: 55.26–120.75, Females: 44.59–175.00) and lower lip-chin height (Males: 36.25–135.63, Females: 25.44–131.40) indices. Lowest variances were observed in upper face-face height (Males: 56.73–70.79, Females: 58.35–70.19), lower face-face height (Males: 50.34–62.69, Females: 48.06–60.95) and mandibulo-lower face height (Males: 57.98–72.07, Females: 58.64–70.64) indices. From lower face-face height index, the proportion of lower face was 56 % of total face height. The proportion of upper lip height (Sn-Sto), lower lip height (Sto-Sl) and chin height (Sl-Gn) were found to be 35.12, 27.33 and 37.55 % respectively.Table 2. Mean, standard deviation, maximum, minimum and p-values of statistical tests (2 sample t-test) of facial proportion indicesMale (n = 133)Female (n = 137)MeanSDMin.Max.MeanSDMin.Max. P-valueUpper face-face height index63.272.5856.7370.7963.922.3658.3570.190.031Lower face-face height index56.752.4450.3462.6955.252.5948.0660.950.000Mandibulo-face height index36.732.5829.2143.2736.082.3629.8141.650.031Mandibulo-upper face height index58.336.5441.2576.2656.665.8042.4771.370.028Mandibulo-lower face height index64.692.8357.9872.0765.292.6358.6470.640.075Nasal index77.125.6964.3293.8373.996.5460.7093.940.000Upper lip height-mouth width index52.026.4737.0971.2149.366.2136.4667.050.001Cutaneous-total upper lip height index62.166.8440.7277.1761.996.8244.5877.630.838Vermilion-total upper lip height index37.846.8422.8359.2838.016.8222.3755.420.837Vermilion-cutaneous upper lip height index63.0019.8329.58145.5963.3018.3728.81124.320.898Vermilion height index76.6112.0855.26120.7582.2119.8044.59175.000.005Chin-mandible height index58.125.5742.4473.3958.786.0343.2279.720.352Upper face height-biocular width index85.335.0173.4198.3786.924.5474.6998.240.007Intercanthal-nasal width index95.226.7079.48112.8295.377.7577.32113.960.871Nose -face height index43.252.4437.3149.6644.752.5939.0551.940.000Nose-mouth width index86.227.0368.69109.8784.707.0270.98109.490.075Upper lip-upper face height index31.652.3125.6037.1930.022.5524.2835.990.000Upper lip-mandible height index54.876.7638.7572.4853.426.2241.5770.550.067Upper lip-nose height index46.464.9634.4159.2143.085.2632.0756.230.000Lower lip-face height index27.053.4317.0735.8126.873.8012.9136.220.693Lower lip-mandible height index41.885.5726.6157.5641.226.0320.2856.790.352Lower lip-chin height index73.6617.0536.25135.6371.9418.0325.44131.400.421*P-value<0.05, **P-value<0.01, ***P-value<0.001
Gender differences in 11 of the 22 facial proportion indices assessments were apparent. For females, upper face-face height (P < 0.05), vermilion height (P < 0.001), upper face height-biocular width (P < 0.01) and nose -face height (P < 0.001) indices were larger. In contrast, lower face-face height (P < 0.001) mandibulo-face height (P < 0.05), mandibulo-upper face height (P < 0.05), nasal (P < 0.001), upper lip height-mouth width (P = 0.001), upper lip-upper face height (P < 0.001) and upper lip-nose height (P < 0.001) indices were larger in males. The index with the largest mean percentage difference (7.56 %) between genders was upper lip-nose height index.
Discussion
This study was conducted on a random population sample of 12-year-old children, as opposed to small, non-random, convenient samples as described in the majority of photogrammetric studies published to date [21–23]. With the rate of adopted subjects of 53 %, there are a number of factors to account for the loss of samples including less than ideal cooperation from 12 years old children, time constraint and past or current orthodontic treatment. This reflects the difficulties in performing population-wide photogrammetric studies under non-clinical/outreach settings in the community. Nevertheless, the sample size was sufficient to provide populations norms and to discover gender differences and it is one of the largest samples for photogrammetric study with random population sample and largest range of assessment of proportion indices.
A smaller local study analyzed facial profiles with photogrammetry on only 82 12-year-old southern Chinese with just five proportion indices [21]. Findings were consistent with the present study, with mean differences less than 1 standard deviation for four indices: lower-face-face height index, mandibulo-lower face height, intercanthal-nasal width and lower lip-face height indices. The only inconsistency was reported for the lower lip-face height index, which they reported a statistically significant gender difference. In comparison with northern America Caucasian population [8], the only index that differed by more than 2 standard deviation is the nose-mouth width index for both males and females. This indicates that southern Chinese have a relatively wider nose (AlR-AlL) or narrower mouth (ChR-ChL) compared to Caucasians. The nasal index for males, upper face height-biocular width index and upper-lip-mandible height index for females were larger in southern Chinese by almost 2 standard deviations. The reverse was found for the female mandibulo-upper face height index.
Of a particular importance to orthodontics and orthognathic surgery is the lower face proportion. The lower face height in our study was found to be 56.7 %(male) and 55.3 %(female) of the total face height corresponding well to lateral cephalometric study [24] (M:56.5 %, F:55.7 %), photogrammetric study [25] in Nigerian adults (M:58.15 %, F:56.97 %) and anthropotmetric study [8] on 12-year-old Caucasian children (M:59.7 %, F:59.5 %). Regarding the proportions of the lower third of the face, Renaissance artist Francesca [8] suggested that the lower lip and chin should make up two thirds of the lower one third of face and lower lip and chin should have the same proportion, this is widely adopted in orthodontics and surgery text. Farkas had found proportionality from anthropometric study [8], which is 31.2, 26.2 and 42.6 % for Sn-Sto, Sto-Sl and Sl-Gn. In our study, the proportion was 35.1, 27.3 and 37.6 % respectively.
Farkas [8], Song [26] and Bao [27] reported that there gender difference in facial dimension and proportions but the average differences were small. The results from this study generally supports Farkas’ conclusion. In this study, 11 (50 %) out of 22 facial proportion indices showed significant gender differences. All except 4 of the indices had a percentage difference of less than 5 %. They are upper lip-nose height (7.6 %), vermilion height (7.0 %), upper lip-upper face height (5.3 %) and upper lip height-mouth width (5.3 %) indices.
The norm facial proportion indices obtained can be used for clinical assessment and comparison with same analysis and photogrammetric technique. Frontal photogrammetry was widely used to assess treatment change [6, 9–12], attractiveness [13, 28, 29], comparisons between different ethnic groups [13, 14, 30] and growth [10–12, 31] in additional to daily use for clinical diagnosis and treatment planning.
To conclude, the following were the key findings of this study.
- I.Population norm of facial proportion indices are obtained from the mean values of this study and can serve as a reference to evaluate facial proportions in treatment planning and treatment outcome assessment using the same frontal photogrammetric analysis.
- II.Gender differences in facial proportion were found in 11 indices. Lower face-face height index, mandibulo-face height index, mandibulo-upper face height index, nasal index, upper lip height-mouth width index, upper lip-upper face height index and upper lip-nose height index were significantly larger in males. The findings were opposite for upper face-face height index, vermilion-height index, upper face height-biocular width index and nose -face height index.
- III.The lower face height is found to be 56.7 %(male) and 55.3 %(female) of the total face height and proportions of lower facial height were 35.1, 27.3 and 37.6 % for Sn-Sto, Sto-Sl and Sl-Gn respectively.
- IV.Ethnic differences were evaluated by comparing with a North American Caucasian population, southern Chinese was found to have a relatively wider nose (AlR-AlL) or narrower mouth (ChR-ChL) compared to the Whites.
The reference list from the paper itself. Each links out to its DOI / PubMed record.
- 1Bashour M History and current concepts in the analysis of facial attractiveness Plast Reconstr Surg 200611837415610.1097/01.prs.0000233051.61512.6516932186 · doi ↗ · pubmed ↗
- 2Symons D The evolution of human sexuality 19791 New York Oxford University Press
- 3Langlois JH Roggman LA Attractive faces are only average Psychol Sci 199011152110.1111/j.1467-9280.1990.tb 00079.x · doi ↗
- 4Strzalko J Kaszycka KA Physical attractiveness: interpersonal and intrapersonal variability of assessments Soc Biol 1991391706151412110.1080/19485565.1992.9988813 · doi ↗ · pubmed ↗
- 5Grammer K Thornhill R Human facial attractiveness and sexual selection: the role of symmetry and averageness J Comp Psychol 19941082334210.1037/0735-7036.108.3.2337924253 · doi ↗ · pubmed ↗
- 6Edler R Agarwai P Wertheim D Greenhill D The use of anthropometric proportion indices in the measurement of facial attractiveness Eur J Orthod 20062832748110.1093/ejo/cji 09816415084 · doi ↗ · pubmed ↗
- 7Mackley RJ An evaluation of smiles before and after orthodontic treatment Angle Orthod 1993631839821478610.1043/0003-3219(1993)063<0183:AEOSBA>2.0.CO;2 · doi ↗ · pubmed ↗
- 8Farkas LG Munro IR Anthropometric facial proportions in medicine 19871 Springfield Thomas