Region-specific variation in the properties of skeletal adipocytes reveals regulated and constitutive marrow adipose tissues
Erica L. Scheller, Casey R. Doucette, Brian S. Learman, William P. Cawthorn, Shaima Khandaker, Benjamin Schell, Brent Wu, Shi-Ying Ding, Miriam A. Bredella, Pouneh K. Fazeli, Basma Khoury, Karl J. Jepsen, Paul F. Pilch, Anne Klibanski, Clifford J. Rosen, Ormond A. MacDougald

TL;DR
This study reveals that marrow adipose tissue varies by region, with distinct properties and behaviors that could impact bone health and metabolism.
Contribution
The paper identifies two distinct types of marrow adipose tissue with unique regulatory and developmental characteristics.
Findings
Proximal marrow adipose tissue is regulated and lost under cold exposure, while distal tissue is constitutive and preserved.
Distal marrow adipocytes show higher monounsaturated fatty acids and specific gene expression patterns.
Human distal marrow fat also shows increased unsaturation, suggesting conserved biological mechanisms.
Abstract
Marrow adipose tissue (MAT) accumulates in diverse clinical conditions but remains poorly understood. Here we show region-specific variation in MAT adipocyte development, regulation, size, lipid composition, gene expression, and genetic determinants. Early MAT formation in mice is conserved, while later development is strain dependent. Proximal, but not distal, MAT is lost with 21-day cold exposure. Rat MAT adipocytes from distal sites have an increased proportion of monounsaturated fatty acids and expression of Scd1/Scd2, Cebpa and Cebpb. Humans also have increased distal marrow fat unsaturation. We define proximal ‘regulated’ MAT (rMAT) as single adipocytes interspersed with active hematopoiesis, whereas distal ‘constitutive’ MAT (cMAT) has low hematopoiesis, contains larger adipocytes, develops earlier, and remains preserved upon systemic challenges. Loss of rMAT occurs in mice with…
Genes, proteins, chemicals, diseases, species, mutations and cell lines named across the full text — each resolved to its canonical identifier and authoritative record.
Click any figure to enlarge with its caption.
 Figure 1
 Figure 2
 Figure 3
 Figure 4
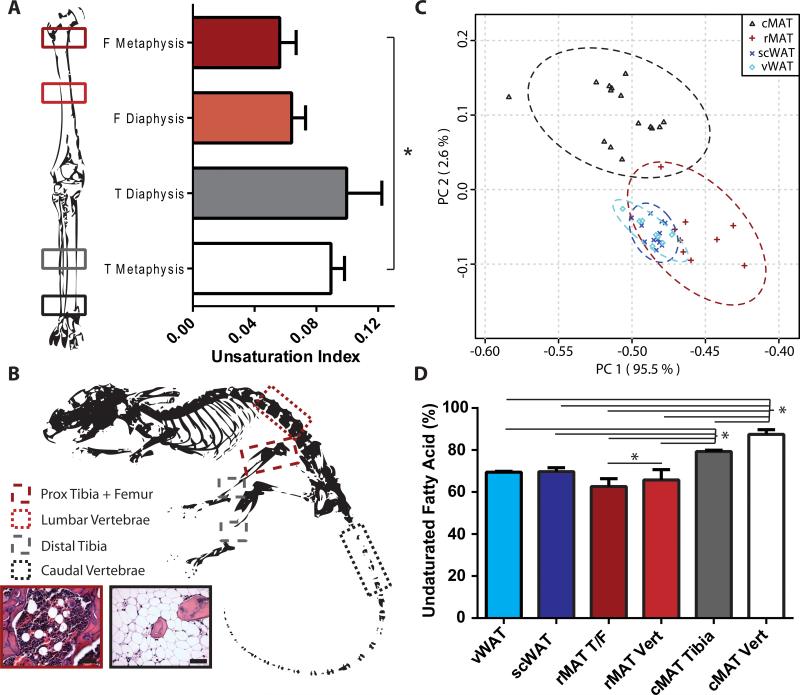 Figure 5
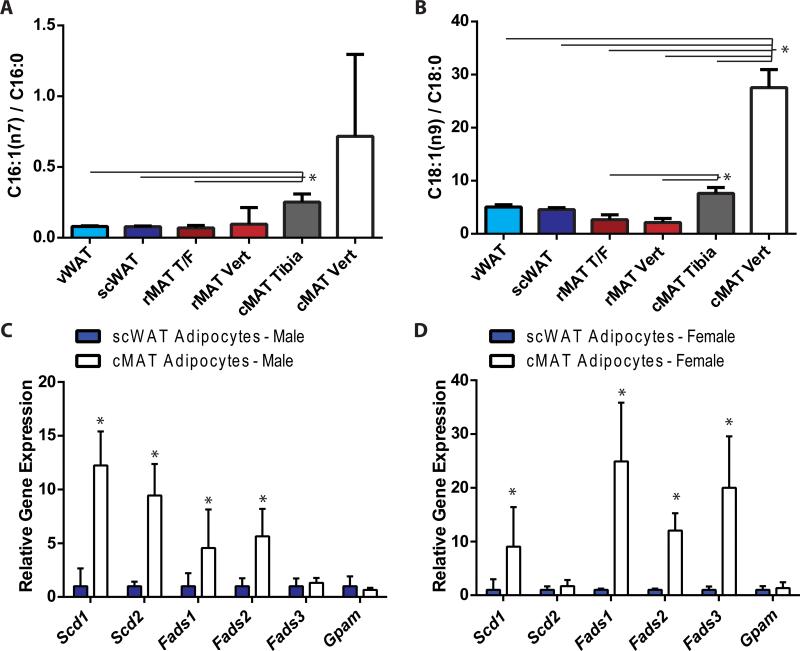 Figure 6
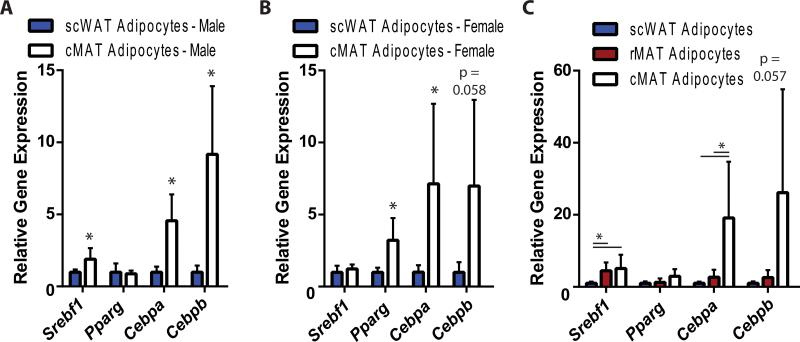 Figure 7
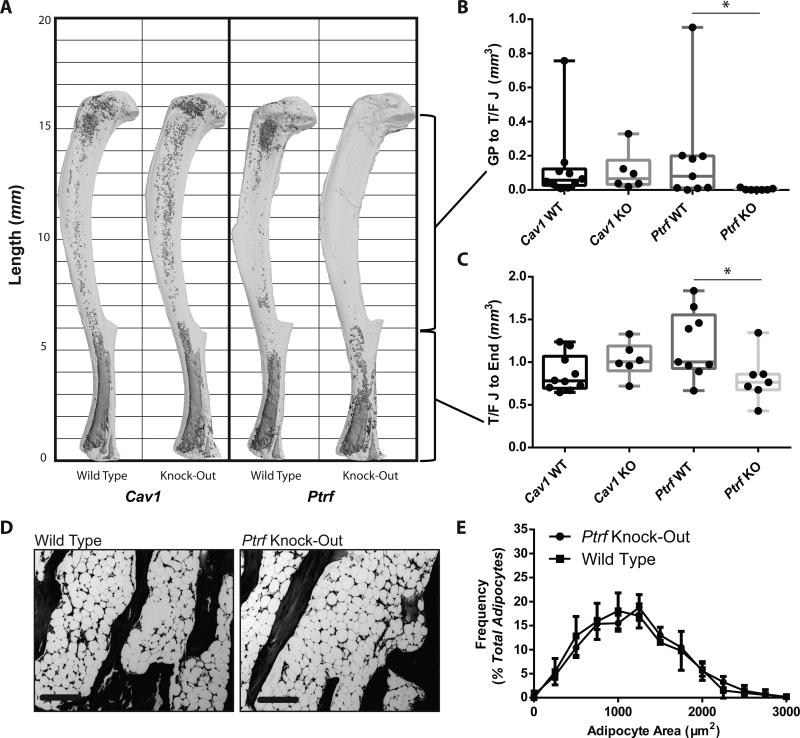 Figure 8
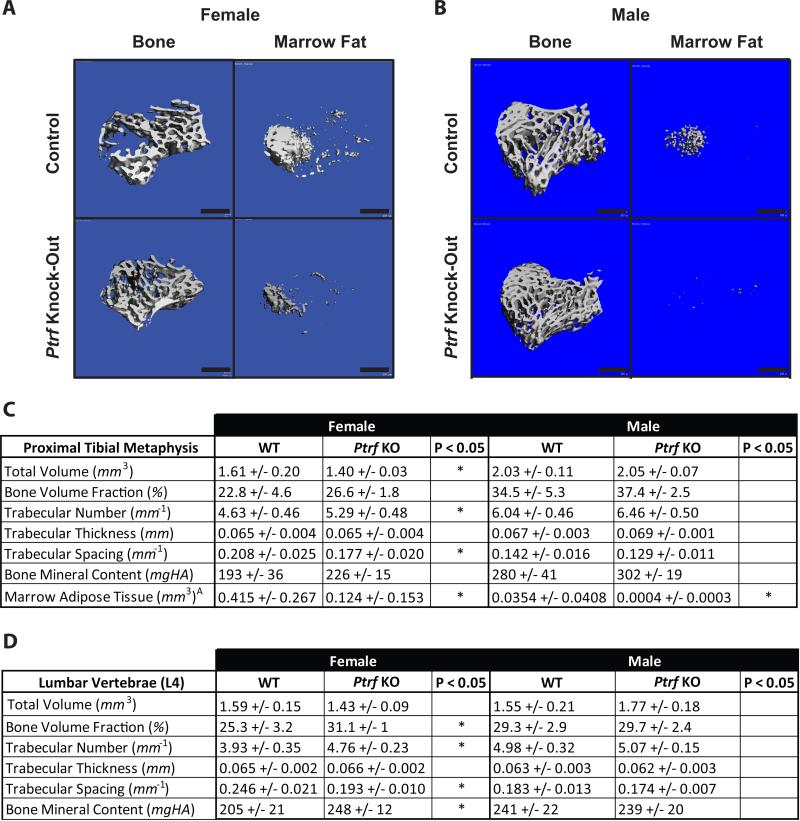 Figure 9
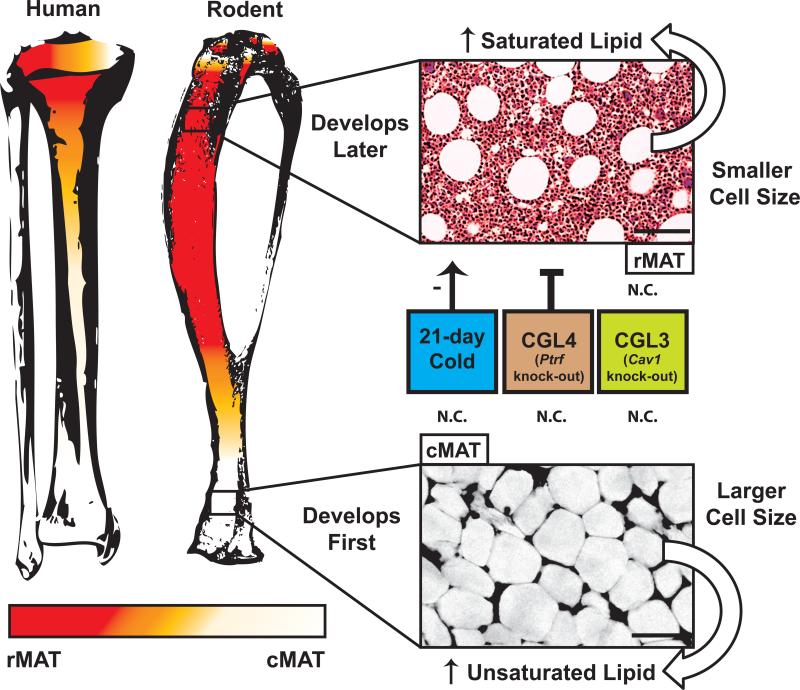 Figure 10
Peer Reviews
No public reviews on file for this paper yet. If you reviewed it on a platform where reviews are public (OpenReview, ICLR, NeurIPS, ICML), you can paste yours below so the community can read it here.
Videos
No videos yet. Explain this paper in a talk, walkthrough, or lecture? Add one.
Taxonomy
TopicsGalician and Iberian cultural studies · Comparative Literary Analysis and Criticism · Spanish Culture and Identity
Marrow adipose tissue (MAT) is a functionally distinct adipose depot, located within the skeleton, with the potential to contribute to both local and systemic metabolism ^1, 2^. Further accumulation of MAT occurs in a diverse range of clinical conditions including osteoporosis, aging, gonadal dysfunction, type 1 diabetes, and anorexia ^2, 3^. MAT formation is also induced with therapeutic interventions including radiation, chemotherapy, glucocorticoids, and thiazolidinediones ^1, 3^. Despite these clinical findings, the regulation and function of MAT remains largely unclear.
In many cases, MAT accumulation has been correlated with low bone mineral density, decreased bone formation, and bone loss (reviewed in ^2^). However, the presence of a direct relationship between MAT and bone remains controversial. For example, despite a clear correlation, increased MAT is not necessary for bone loss at the proximal tibia in rodent models of type 1 diabetes or ovariectomy-induced osteopenia ^4, 5, 6^. In addition, histomorphometric studies in rats demonstrate that sites of high MAT have decreased ovariectomy-induced trabecular bone loss, with trabecular width in rat tibial metaphyses being greater at sites of high MAT (distal tibia) than at sites of low MAT (proximal tibia) ^7, 8, 9^. The hypothesis that MAT is necessary for skeletal equilibrium is also supported by phenotypes of patients with congenital generalized lipodystrophy (CGL). A high proportion of patients with CGL1 or CGL2 (who lack MAT) develop pathologic osteosclerosis and skeletal cysts between age 10 and 20 – the time in humans when MAT generally undergoes robust formation in a developmentally defined pattern in the affected skeletal regions ^2^. In contrast, those with CGL3 or CGL4 (who retain MAT) fail to develop this pathology. These apparent contradictions emphasize the complex, context-specific relationship between MAT and bone, and likely the relationship between MAT and peripheral metabolism ^1, 10^.
Though it is generally assumed that all marrow adipocytes are equivalent, Tavassoli's studies from the 1970s suggest that characteristics of red marrow adipocytes may differ to those of adipocytes within yellow marrow ^11^. In humans, formation of adipocytes within the yellow marrow occurs at or slightly before birth, regardless of prematurity, and accelerates between 4 and 8 weeks of age ^2, 12^. Early MAT formation occurs in distal skeletal regions including the hands, feet, distal tibia, and tail (in rodents). Histologically, once this early MAT matures, the densely packed adipocytes resemble peripheral white adipose tissue (WAT) and are relatively devoid of active hematopoiesis. For the purposes of discussion in this paper, we define these areas as constitutive marrow adipose tissue (cMAT). After the initial peak, MAT accumulation continues in areas of red, hematopoietic marrow throughout life ^13^. We refer to this population as regulated marrow adipose tissue (rMAT) and define it histologically as single adipocytes interspersed with sites of active hematopoiesis. It is important to note that, especially in larger species, both histological patterns may exist side by side. In rats and mice, however, these regions appear to be spatially distinct.
We hypothesized that the later-forming rMAT adipocytes would have characteristics distinct from the cMAT adipocytes that arise early in development. Herein, we address this hypothesis using mouse models to examine MAT formation and regulation during development and with cold exposure; lipidomics and proton MR spectroscopy (^1^H-MRS) to measure MAT lipid composition in rats and humans; MAT isolated from rats to quantify molecular differences in gene expression; and CGL3 and CGL4 mouse models that reveal a genetic basis for development of distinct rMAT and cMAT subpopulations. In sum, this evidence distinguishes rMAT from cMAT – a fundamental finding that may help to explain previous inconsistencies in the literature and inform future research on the relationship between MAT, bone, hematopoiesis and whole-body metabolism.
RESULTS
Strain-specific marrow adipose tissue development in mice
The postnatal development of MAT remains poorly characterized on a spatiotemporal level. We used osmium tetroxide staining to visualize and quantify MAT in the whole tibia of male C57BL/6J (B6) and C3H/HeJ (C3H) mice at 1, 4, 12, and 56 weeks of age (Figure 1). At 1 and 4 weeks, the initial phase of MAT development was similar in both strains. In the distal tibia, MAT formation and maturation accelerated rapidly after birth until the marrow space filled with adipocytes at 4 weeks of age. The amount of MAT distal to the junction of the tibia and fibula was similar between B6 and C3H strains through 12 weeks and remained relatively stable until 56 weeks in C3H animals (Figure 1A,B). A parallel pattern of development occurred in the caudal vertebrae of the tail, with mature MAT filling the marrow space by 4 weeks of age (Figure 1C). At this time, MAT in the tail vertebrae matched the histologic appearance of cMAT as defined above.
In contrast to the distal tibia and tail, rMAT within the middle and proximal tibia was highly variable in both volume and rate of development (Figure 1A,B). By 12 weeks, MAT development diverged, with robust expansion in the proximal tibial marrow of C3H, but not B6, mice. Thus, C3H mice had nearly twice as much total MAT than B6 at this age. Surprisingly, by 56 weeks these differences in total MAT disappeared (Figure 1B); however, the distribution of the cells within the tibia remained divergent, with C3H mice having increased MAT volume in the proximal regions of the tibia (Figure 1B). These distinct developmental characteristics suggest discrete MAT populations, designated cMAT (distal tibia and tail vertebrae) and rMAT (mid- to proximal-tibia).
To examine the developmental relationship between MAT and bone, we also analyzed the tibiae of 12- and 56-week-old animals both prior to decalcification and again after osmium staining. Osmium-based localization of MAT in three dimensions demonstrated its asymmetric distribution within the tibial marrow cavity (Figure 2A,B). In both B6 and C3H mouse strains, MAT accumulation with age in the proximal metaphysis occurred most robustly in the medial marrow space. In the mid-diaphysis, B6 MAT continued to approximate the medial endocortical surface whereas C3H MAT closely followed the posterior cortex (Figure 2D,E). Development of trabecular and cortical bone was similar to what has been reported previously (Figure 2C,F) ^14^. In addition to increases in MAT with age in both strains, trabecular number decreased and thickness increased. Thus, in the proximal metaphysis across the 12- and 56-week-old groups, MAT volume correlated negatively with trabecular number (linear regression B6, P = 0.007; C3H, P = 0.005) but positively with trabecular thickness (linear regression B6, P = 0.010; C3H, P < 0.001).
Differential loss of MAT with cold exposure
Cold exposure in rodents elevates sympathetic tone and results in extensive remodeling of WAT, which enhances thermogenesis and allows maintenance of body temperature and survival at 4°C ^15^. However, the response of MAT to cold temperatures is unknown. To quantify changes in MAT after 21-day cold exposure (4°C), we analyzed MAT in the whole tibia of male C3H mice at 12 and 56 weeks of age. The C3H strain was used based on the robust proportion of MAT in both proximal and distal regions of the tibia (Figure 1), allowing for simultaneous analysis of rMAT and cMAT populations within the same bone.
After cold exposure in 12-week-old mice, the amount of rMAT decreased by 76% in the tibial epiphysis and 71% in the proximal tibia, between the growth plate and the tibia/fibula junction (Figure 3A,B). In 56-week-old mice rMAT decreased by 56% and 71%, respectively (Figure 3C). In contrast, cMAT in the distal tibia, below the fibular attachment, remained unchanged (Figure 3A-C). MAT loss at the proximal tibial metaphysis was most prominent in the center of the marrow space with a relative preservation of the adipocytes that were directly adjacent to the endocortical surface (Supplementary Figure 1A,B). This is the reverse of the developmental pattern of proximal MAT accumulation (Figure 2A,B). Despite the robust loss of rMAT, trabecular and cortical parameters in the tibia remained largely unchanged (Supplementary Figure 1C,D); indeed, the only significant finding was a slight decrease in the relative cortical bone volume in the 12-week-old C3H mice.
For osmium-based MAT analysis we use a μCT voxel size of 12 μm, which allows rough outlines of the marrow adipocytes to be observed (the average MAT cell diameter is 30-40 μm). However, at this resolution, μCT might be unable to detect more subtle changes in regions of densely packed adipocytes, such as those in the distal tibia. To test this, we re-scanned the bones from the 12-week-old mice at a voxel size of 2 μm using nano-computed-tomography (nanoCT). The resolution of these scans was sufficient to clearly identify individual adipocytes (Supplementary Figure 2). Using a digital histology approach, we quantified adipocytes sizes in two-dimensional nanoCT DICOM slices (Supplementary Figure 2) ^16^. To determine the adipocyte size distribution, we measured the two-dimensional area of 300 to 400 individual adipocytes in the proximal tibial metaphysis and at the mid-point of the distal tibia (Supplementary Figure 2). Consistent with our μCT results for total MAT volume, adipocytes in the proximal tibia decreased in size while those in the distal tibia remained unchanged (Figure 3D-F). This confirmed our μCT interpretation and the validity of the osmium/μCT method for total MAT volume quantification, even in adipocyte-dense regions such as the distal tibia ^17^. Together, the μCT and nanoCT data revealed that in response to cold exposure, proximal rMAT adipocytes decrease in both size and number, whereas the adipocytes in the distal tibia are unchanged (Figure 2G).
Average adipocyte size of rMAT and cMAT adipocytes
Adipocyte size is a parameter that has historically been used to track metabolic responsiveness of individual cells. Analysis of the 12-week-old C3H animals at room temperature revealed that cMAT adipocytes are significantly larger than rMAT adipocytes (Figure 4A), with average diameters of 37.8 ± 1.2 μm and 32.5 ± 2.4 μm respectively (two-tailed t-Test, P = 0.002). This 16% increase in cMAT adipocyte diameter extrapolates to an estimated 54.6% increase in cMAT adipocyte volume. Constitutive MAT adipocytes were also larger in rats (Figure 4B,C), with cMAT adipocytes in tail vertebrae being 24% or 17% larger in diameter than tibial rMAT adipocytes in males or females, respectively (male cMAT vs rMAT, 38.9 ± 1.9 μm vs 31.4 ± 1.6 μm, two-tailed t-Test, P < 0.001; female cMAT vs rMAT, 38.9 ± 1.6 μm vs 33.1 ± 3.2 μm, two-tailed t-Test, P = 0.003). The cell size distributions for each group are presented as histograms in Figure 4.
Region-specific fatty acid content of marrow adipose tissue
The mechanisms underlying site-specific regulation of marrow adipocytes with cold exposure could be related to differences in the local microenvironment and/or between adipocyte subpopulations. With the exception of Tavassoli ^11^, previous work on marrow fat has assumed that all MAT adipocytes are equivalent. To begin testing the validity of this assumption and thus determine if the microenvironment is the sole mediator, we characterized the lipidomic profile of the proximal rMAT and distal cMAT adipocytes.
We started with lipidomics because Tavassoli's work suggests that marrow adipocytes may have a region-specific lipid composition ^11^. In addition, our ‘marrow fat consortium’ group previously developed techniques to estimate the lipid unsaturation of MAT in the human skeleton using ^1^H-MRS ^18^ (Supplementary Figure 3). We applied this method to measure marrow lipid unsaturation in four regions of the human appendicular skeleton, including the femur (proximal metaphysis, mid-diaphysis) and the tibia (mid-diaphysis, distal metaphysis). We found that, in humans, the distal tibia had an increased unsaturation index relative to the proximal femur (Figure 5A), implying that distal marrow adipocytes contain more unsaturated lipids than those in proximal/central skeletal regions.
Since the human model relies on indirect analysis of intact marrow, we developed a modified collagenase digestion protocol to purify adipocytes from the rat bone marrow for direct lipidomic analyses ^19^. Adipocytes from WAT (perirenal, gonadal, and inguinal) were used as a control. The rMAT regions included the femur/proximal tibia and lumbar vertebrae, while the cMAT regions included the distal tibia and caudal vertebrae (Figure 5B). Adipocytes were isolated from a diverse population of rats including (Experiment #1) one-year-old female high-capacity-runner rats ^20^; (Experiment #2) 16-week-old male Sprague Dawley rats; and (Experiment #3) 8-month-old female Sprague Dawley rats ^21^. After isolating adipocytes, we extracted total lipid with methanol-choloroform and then used gas chromatography for lipidomic analysis of esterified fatty acids.
In the adipocyte, the vast majority of fatty acids are derived from triacylglycerols with minor contributions from species such as phospholipids. Palmitate, stearate and their unsaturated derivatives were the most common – accounting for >90% of the total lipid. To standardize between experiments we expressed each fatty acid subtype as a percent of the total lipid. The raw data for all experiments is presented in this format as Supplementary Data 1. This standardized dataset was used to perform principal component analysis of the 23 fatty acid subtypes across three independent experiments. In total, 44 unique lipidomic profiles of purified adipocytes from MAT (8 rMAT, 15 cMAT), visceral WAT (5 gonadal, 3 perirenal) and subcutaneous WAT (12 inguinal) were compared (Supplementary Data 1). Despite the diversity in the animal cohorts, all forms of WAT were tightly clustered while there was a clear separation of cMAT from rMAT and WAT (Figure 5C). Consistent with the human data, the percent of unsaturated fatty acids relative to total lipid was highest in the cMAT adipocytes purified from the distal tibia and the tail vertebrae (Figure 5D).
The increased proportion of unsaturated fatty acids in the rat cMAT adipocytes and separation from rMAT/WAT adipocytes on the principal component plot was primarily driven by decreases in palmitate and stearate and corresponding increases in their monounsaturated derivatives palmitoleate and oleate (Supplementary Data 1). This resulted in a robust increase in the monounsaturated-to-saturated ratio for these fatty acids (Figure 6A,B). This change was greater in cMAT adipocytes from the tail vertebrae when compared to the cMAT from the distal tibia, indicating that the distal tibia may be a region of mixed MAT. Consistent with the increased proportion of the unsaturated fatty acids palmitoleate and oleate, expression of stearoyl-CoA desaturase-1 (Scd1) was elevated in both male and female cMAT adipocytes relative to adipocytes isolated from subcutaneous WAT (Figure 6C,D). Elevated expression of desaturases including Fads1 and Fads2 was also noted in both males and females, with inconsistent elevations in Scd2 (males only) and Fads3 (females only) (Figure 6C,D). Expression of mitochondrial glycerol-3-phosphate acyltransferase (Gpam), an enzyme that preferentially incorporates saturated fatty acids during synthesis of glycerolipids, was similar between scWAT and cMAT in both cohorts.
Region-specific transcription factor expression
Differentiation of adipocytes from precursor cells is tightly regulated by a defined transcriptional cascade (see ^22^ for review). The transcription factors CCAAT/enhancer binding protein (C/EBP) β and δ are induced during early adipogenesis. These factors then activate expression of the essential adipogenic transcription factors PPARγ (peroxisome proliferator-activated receptor γ) and C/EBPα ^23^. Sterol regulatory element-binding protein-1 (encoded by Srebf1) serves as a transcriptional activator that is required for lipid homeostasis in mature adipocytes. Unexpectedly, in cMAT adipocytes expression of both Cebpa and Cebpb was elevated relative to rMAT and/or subcutaneous WAT adipocytes from male and female rats (Figure 7A-C). Expression of Srebf1 was elevated in cMAT and rMAT adipocytes of males, but not females. In contrast, Pparg was similar between cMAT/rMAT/WAT in males but increased in cMAT relative to scWAT in females. The similar or elevated expression of Pparg in MAT reinforces the notion that these cells are of the adipocyte lineage, but the selective elevation of Cepba and Cebpb in cMAT adipocytes suggests potential for alternative transcriptional regulation and function in this unique adipocyte population.
Knock-out of PTRF inhibits formation of rMAT adipocytes
Patients with congenital generalized lipodystrophy (CGL) lose a majority of their peripheral WAT; however, MRI scans indicate that MAT is preserved in those with mutations in CAV1 (CGL3) and PTRF (CGL4) (reviewed in ^2^). Caveolin-1 (encoded by CAV1) is a key structural component of caveolae, 50-100 nm invaginations of the plasma membrane that account for up to 50% of the surface of peripheral white adipocytes ^24^. PTRF encodes for cavin-1, a protein required for stabilization of caveolins and formation of caveolae ^25, 26, 27, 28^. Caveolae and their associated proteins coordinate many diverse signaling pathways and have been identified as key regulators of insulin sensitivity, lipid trafficking, and adipocyte precursor differentiation ^29, 30^.
To explore the preservation of MAT in CGL3 and CGL4, we quantified region-specific changes in MAT of adult male and female Cav1 and Ptrf knock-out mice at 16-17 weeks of age. The metabolic and peripheral adipose tissue phenotypes of these animals have been reported previously ^26, 31, 32, 33^. Consistent with the CGL3 human phenotype ^34^, Cav1 knock-out mice did not lose MAT (Figure 8A-C, Supplementary Figure 4) despite a significant decrease in the amount of peripheral WAT (Supplementary Figure 5A,B). As with MAT, trabecular bone at the proximal tibial metaphysis and cortical bone at the mid-diaphysis remained unchanged in the Cav1 knock-out animals (Supplementary Figure 5C,D).
In addition to loss of WAT (Supplementary Figure 6), in male mice knock-out of Ptrf caused nearly complete loss of proximal tibial rMAT adipocytes with a relative preservation of cMAT in the distal tibia (Figure 8A-C). Based on the 3D reconstructions of the tibiae from Ptrf knock-out animals, only the most distal portion of the MAT in the tibia was maintained while there was mixed preservation moving toward the tibia/fibula junction (Figure 8A). This finding, like the lipidomic data in the rats, suggests a possible mixture of rMAT and cMAT adipocytes in the distal tibia. In contrast, the tail vertebrae of male Ptrf knock-out mice remained completely filled with MAT (Figure 8D), and these vertebral cMAT adipocytes were the same size as those of wild-type animals (Figure 8E). Except for a 4.6% increase in cortical bone mineral content, trabecular and cortical parameters did not differ between the Ptrf knock-out males and their wild-type counterparts (Figure 9C, Supplementary Figure 6).
Similar decreases in rMAT and WAT were observed in the female Ptrf knock-out mice (Figure 9A; Supplementary Figure 4; Supplementary Figure 6). Unlike males, the female Ptrf knock-outs had a significant 14.3% increase in trabecular number and corresponding 8.5% decrease in trabecular spacing (Figure 9C). In addition, relative to males, both control and Ptrf knock-out females had increased MAT volume in the proximal tibia (Figure 9) that was inversely correlated with trabecular number at the proximal tibial metaphysis (P = 0.021). Interestingly, the trabecular bone phenotype of the females was even more striking in the L4 vertebral body, with a 21.1% increase in trabecular number, 21.5% decrease in spacing, 22.9% increase in bone volume fraction, and 21.0% increase in bone mineral content (Figure 9D). Consistent with previous reports ^10^, we did not observe MAT adipocytes in the lumbar vertebrae in either the wild type or knock-out females. As with the tibia, the trabecular phenotype of the vertebrae was unaffected by Ptrf knock-out in males.
DISCUSSION
Our results demonstrate that there are region-specific differences in development, regulation, adipocyte size, lipid composition, gene expression, and genetic determinants of marrow adipocytes that have implications for understanding the marrow niche and its relationship to skeletal and whole body metabolism. Localization of osmium-stained adipocytes in three-dimensions demonstrated that MAT in mice develops asymmetrically from distal to proximal. A similar pattern of early development occurs in vertebrae species including rats, rabbits, and humans. However, the absolute rate of formation decreases with increasing lifespan/size of the animal. For example, the ‘adult’ distribution of MAT in humans occurs around age 25; in rabbits by 6 months; and in mice as early as 8 weeks – likely with some relationship to sexual maturation ^12, 13, 35, 36^. The amount of MAT that forms during this phase also varies between species; larger animals have more MAT that extends farther into the skeleton than smaller animals (humans > rabbits > rats > mice). In addition, we found that MAT forms in two distinct temporal waves that are spatially separated in mice and correspond histologically to rMAT in red marrow and cMAT in yellow marrow (Figure 10). Conversely, MAT loss with cold exposure is the opposite of development – the last to form is the first to go. The cMAT in the distal tibia and tail, in particular, is highly resistant to dissolution. While the microenvironment likely plays a major role these site-specific responses, our lipidomic and gene expression data identify cell autonomous differences between the rMAT and cMAT adipocytes that might also contribute to their distinct behaviors.
Tavassoli, in 1976, demonstrated the presence of two different types of adipocytes in rabbit bone marrow – those that stain with performic acid Schiff (PFAS) and those that do not ^11^. The stain reaction is thought to rely on oxidation of the ethylenic linkages in unsaturated fats to aldehyde and processing with Schiff's reagent to generate a red/purple color, though this mechanism is controversial ^37^. Inspired by Tavassoli's PFAS stain ^11^, we found that rMAT and cMAT have distinct lipidomic profiles (Figure 5, Supplementary Data 1). In addition, despite the histologic similarities between WAT and cMAT - the lipid composition of WAT more closely mirrors that of rMAT, suggesting that lipid metabolism in WAT and rMAT adipocytes may be similar. Coordinate regulation by cold exposure and similarities in Pparg, Cebpa, and Cebpb gene expression between rMAT and WAT further support this hypothesis. Of note, the increase in cMAT unsaturation is actually the opposite of what we expected based on the proposed mechanism of the PFAS stain. This is likely due to the historic debate surrounding the stain, which in one paper from 1970 was characterized as “useless in lipid histochemistry” ^37^. Regardless, it led us to uncover a highly conserved difference between rMAT and cMAT in rats that, based on indirect evaluation with ^1^H-MRS, appears to extend to human MAT.
These findings have implications for diseases including osteoporosis, which has been associated with a decrease in MAT unsaturation ^38^. A shift in marrow fat composition to higher levels of saturated lipid has also been correlated with fragility fractures in postmenopausal women ^39^. For example, palmitate is lipotoxic to osteoblasts and impairs mineralization ^40^. As a proportion of total lipid, palmitate is enriched in rMAT relative to cMAT. In contrast, palmitoleate, which is enriched in cMAT, has been identified as a secreted adipose tissue-derived lipid hormone with the capacity to stimulate muscle insulin action and suppress hepatosteatosis ^41^. Our current analysis does not discriminate between lipid types (e.g. triacylglycerols vs phospholipids); hence, future work is needed to examine sub-cellular localization and secretion of fatty acids, in addition to other mediators, by rMAT and cMAT and to quantify their impact on local and distant tissues.
In the introduction we highlighted the unresolved controversy that exists regarding the relationship between MAT and bone. It is notable that the reports which correlate MAT accumulation with low bone mineral density, decreased bone formation, and bone loss generally analyze rMAT-enriched sites, including the proximal femur, hip, and lumbar spine (reviewed in ^2^). In contrast, studies demonstrating resistance to bone loss at sites of high MAT are all based on cMAT-enriched areas including the distal tibia and tail vertebrae ^7, 8, 9^. In this manuscript we explored changes in trabecular and cortical architecture and compared our findings to MAT volume and its three-dimensional distribution. During development in B6 and C3H mice, we observed polarization of rMAT toward the medial marrow space in the proximal tibia and to the medial/posterior endocortical surface at the mid tibia (Figure 2). MAT accumulation from 12 to 56 weeks of age correlated negatively with trabecular number and positively with trabecular thickness in both strains. Conversely, extensive loss of MAT in the proximal tibia in mice undergoing 21-day cold exposure failed to uniformly impact trabecular or cortical parameters (Supplementary Figure 1). In our genetic models, knock-out of Cav1 left both MAT and bone unchanged. In contrast, developmental inhibition of rMAT accumulation in the female Ptrf knock-out mice was correlated with increased trabecular number in the proximal tibia. With this phenotype it is tempting to conclude that rMAT loss is necessary for trabecular gain; however, in this same model the increase in trabecular number was actually more pronounced in the lumbar vertebrae – a skeletal site in the mouse that has little to no MAT.
What then can we conclude about the relationship between MAT and bone? It is certainly of note that developmental polarization of MAT along the medial and posterior surfaces of the cortical bone implies that rMAT may be related to cortical drift patterns during development. Similarly, logic dictates that accumulation of MAT in the proximal tibia must occur at the expense of either hematopoiesis or bone, since the size of the space within the skeleton is finite. It would not be unreasonable to subsequently assume that these components have an inherent ability to regulate one another. What we truly need, however, are animal models in which we can specifically regulate rMAT and cMAT in vivo. Identification of Ptrf knock-out as a selective mediator of rMAT loss (Figure 8) is one step toward generation of a genetic model of rMAT ablation. Future quantification of MAT, expanded beyond conventional methods to include both rMAT and cMAT, in currently available genetic models will undoubtedly reveal additional targets.
Though depletion of MAT has been proposed as a strategy to combat osteoporosis ^42^, the function of rMAT and cMAT must be clarified prior to removal of MAT populations. The highly defined accumulation of cMAT early in vertebrate development and its robust resistance to dissolution implies an important function for this adipose depot – one that may go beyond the skeleton ^1^. In contrast, rMAT adipocytes are more closely situated in areas of high bone turnover and are better positioned to actively influence hematopoiesis and/or skeletal remodeling. Though our data provide a working definition of rMAT and cMAT and highlight the need to explore these cells in more detail (Figure 10), there are many questions that remain. Our ability to definitively address fundamental differences in marrow adipocytes and their role locally in the skeletal microenvironment, or systemically, as a component of whole-body metabolism, depends on future development of targeted animal models and continued clinical investigation.
METHODS
Rodents
Where they were utilized, animal procedures were approved by the animal use and care committees at the University of Michigan, Maine Medical Center Research Institute, and/or Boston University. Animals were housed at 22°C on a 12 hour light/dark cycle unless otherwise indicated.
Development
Male C57BL/6J (Jackson Labs, Stock: 000664) and C3H/HeJ (Jackson Labs, Stock: 000659) mice were euthanized at 1, 4, 12, or 56 weeks of age and tissues were collected for analysis. The 12 and 56-week-old C3H animals are the same as the control groups for the C3H cold exposure experiment outlined below.
Cold exposure
At 8 or 52 weeks of age, 10 male C3H/HeJ (Jackson Labs, Stock: 000659) mice were placed individually into pre-cooled cages with bedding, food, and water, in a room held at 18°C. Littermate control mice (n = 10/strain) were held in identical conditions at room temperature (~22°C). After 1 week at 18°C, the cold room was adjusted to 4°C and maintained at this temperature for an additional 3 weeks. Control mice were held at 22°C for a total of 4 weeks (concurrently). Rectal core body temperature of control and cold-exposed mice was monitored daily using a Type T thermocouple rectal probe (RET-3, Physitemp Instruments, Inc., Clifton, NJ, USA) with a MicroTherma 2T hand held thermometer (ThermoWorks, Inc., Lindon, UT; Cat: THS-227-193). After 4 weeks, all mice were sacrificed and tissues were collected for analysis. Given the length of the intervention (21 days), we pre-scanned the non-decalcified tibia bones to calculate the marrow volume. After decalcification and osmium stain, the bones were re-scanned and the MAT volume was normalized to marrow volume in each region of interest to correct for any changes in the size of the tibiae between groups.
Cav1 and Ptrf Knock-out mice
Cav1 and Ptrf knock-out mice were generated previously ^26, 31^. Homozygous Cav^tm1Mls/J^ mice with knock-out of Cav1 on a mixed background (Jackson Labs, Stock: 004585) were crossed with B6129SF2/J controls (Jackson Labs, Stock: 101045). The resulting Cav1^+/−^ heterozygotes were crossed and the male homozygous offspring were euthanized for analysis at 16 weeks of age. The homozygous male and female Ptrf^−/−^ and their wild-type control littermates were generated from breeding Ptrf^+/−^ heterozygotes and used for the present study at 16 - 17 weeks of age. The Ptrf^−/−^ mice had previously been backcrossed to C57BL/6J mice for at least nine generations.
Marrow fat quantification by osmium staining and CT
Mouse bones were stained with osmium tetroxide for analysis of marrow fat, with slight modification from ^17^, as follows. Bones were fixed in 1.5 or 2.0 mL microtubes for 24-48 hours in 10% neutral buffered formalin (VWR, Radnor, PA; Cat: 16004-128), washed with water and decalcified in 14% EDTA, pH 7.4 for 14 days. After washing again with water, 600 μL Sorensen's phosphate buffer (pH 7.4) was added to one bone (femur or tibia) in a 1.5 mL microtube. (NOTE: ALL SUBSEQUENT STEPS MUST BE PERFORMED IN THE FUME HOOD) 200 μL of 4% osmium tetroxide solution (Electron Microscopy Services, Hatfield, PA; Cat: 19170) was added to each tube to make a 1% solution. Bones were stained in the fume hood 48 hours at room temperature. Osmium solution was carefully removed to a small liquid waste container that had been filled with corn oil to ~25% of the volume. Any used pipet tips were ‘rinsed’ of active osmium tetroxide by pipeting corn oil. All tips and tubes were discarded as osmium solid waste. Bones were washed, in the same tube, by incubating in 1 mL of Sorensen's buffer for 3 hours at room temperature. This was repeated twice and the last wash was left in the hood overnight. This waste was disposed of as indicated above. Stained bones were then moved to a fresh set of 1.5 mL microtubes containing 1 mL Sorensen's buffer each. The used tubes were discarded as solid osmium waste. At this point the bones and tubes were removed from the fume hood and used for computed-tomography.
MicroCT (μCT)
Specimens were embedded in 1% agarose and placed in a 19 mm diameter tube. The length of the bone was scanned using a μCT system (μCT100 Scanco Medical, Bassersdorf, Switzerland). Scan settings: voxel size 12 μm (all except Figure 1A, 1 week bones at 10 μm), medium resolution, 70 kVp, 114 μA, 0.5 mm AL filter, and integration time 500 ms. Density measurements were calibrated to the manufacturer's hydroxyapatite phantom. Analysis was performed using the manufacturer's evaluation software and a threshold of 400 for marrow adipose tissue.
NanoCT
Samples were scanned at 2 μm voxel size, 90kV, 90uA, and 1500 ms exposure time with a total scan time of 73 minutes on a nanotom-s (phoenix|x-ray, GE Measurement & Control; Wunstorf, Germany). DICOM image files were opened in ImageJ ^43^ for size analysis of individual adipocytes in two-dimensions using a ‘virtual histology’ approach (Supplementary Figure 1). The area of 300 to 500 adipocytes was measured per sample ^44^. A bin size of 250 was used to generate a size distribution histogram for each adipocyte type. The average adipocyte volume was estimated based on the average adipocyte area and compared to the total MAT volume (as determined by μCT) to determine the number of adipocytes in a region of interest.
Histology
Samples were fixed in 10% neutral buffered formalin and decalcified in 14% EDTA, pH 7.4 prior to paraffin embedding and hematoxilyn and eosin stain. Where indicated, osmium stained bones (prepared as detailed above) were submitted and processed in the same way.
Human marrow unsaturation
This study was approved by the Partners Healthcare Institutional Review Board and complied with Health Insurance Portability and Accountability Act guidelines. Written informed consent was obtained from all subjects after the nature of the procedure had been fully explained. We studied 5 women (mean age: 33±10 years) with a mean BMI of 24.8±10 kg/m2. All subjects underwent proton MR spectroscopy (^1^H-MRS) of the proximal femoral metaphysis, the mid femoral and tibial diaphyses, and the distal tibial metaphysis to determine MAT content and composition using a 3.0T MR imaging system (Siemens Trio, Siemens Medical Systems, Erlangen, Germany). Single-voxel 1H-MRS data was acquired using point-resolved spatially localized spectroscopy pulse sequence without water suppression as previously described ^18^. Coefficient of variation (CV) for bone marrow fat quantification was 5%. Fitting of all 1H-MRS data was performed using LCModel (version 6.3-0K) as previously described ^18^. A customized fitting algorithm for bone marrow analysis provided estimates for total marrow lipid content (lipid peaks at 0.9, 1.3, 1.6, 2.0, and 5.3 ppm combined). Unsaturation index (UI) was determined by obtaining a ratio between the olefinic resonance at 5.3 ppm, an estimate of fatty acid unsaturation bonds, and total lipid content.
Adipocyte Isolation for Lipidomics
Adipocytes were isolated from rat WAT and MAT using a modified collagenase digestion protocol as described below ^19^. Older female rats were obtained from the University of Michigan rat recycling program and including one-year-old female high-capacity-runner rats (N = 3) ^20^ and ~8-month-old female Sprague Dawley rats (N = 5). Sixteen-week-old male Sprague Dawley rats were obtained from Charles River (Strain Code: 400). Rats were anesthetized with isofluorane in a drop jar and euthanized by decapitation. The processing for each sample type is outlined in detail below. All protocols were performed simultaneously and the adipocytes from each tissue underwent methanol-choloroform extraction for total lipid at the same time (± 5 minutes).
WAT
Adipose tissues were removed and placed in warm Krebs-Ringer Hepes buffer, pH 7.4 (10 mM Hepes, 120 mM NaCl, 1.2 mM KH_2_PO_4_, 1.2 mM MgSO_4_, 2.5 mM CaCl_2_, 15 mM NaHCO_3_, 4.8 mM KCl, 1.0 g/L D-glucose, 500 nmol adenosine) that had been pre-equlibrated overnight in an incubator at 37°C, 5% CO_2_ and re-pHed to 7.4. Washed adipose tissue pieces totaling approximately one gram were minced in 10 mL KRH containing 1 mg/mL collagenase type I (Worthington Biochemical Corp, Lakewood, NJ; Cat:4197) and 3% fatty-acid free bovine serum albumin (BSA) (Calbiochem; Cat: 126575) in a 50 mL conical tube and placed in a shaking water bath at 100 rpm, 37°C for 45 – 60 minutes. Digested tissue was pulled gently through a 10 mL polypropylene luer-lock syringe (no needle) three times to complete disruption and then filtered through a 100 μm cell strainer (Fisherbrand®, Pittsburgh, PA; Cat:22363549) into a fresh 50 mL polypropylene conical tube.
Tibial cMAT
Both tibiae were removed and cleaned of muscle and tendon using gauze. A rotary power tool (Dremel®, Robert Bosch Tool Co, Addison, IL) with a Dremel® 545 Diamond cutting wheel was used to horizontally bisect the tibia at the base of the tibia/fibula junction. The distal portion was inverted into a 1.5 mL polypropylene microtube containing a hollow spacer and centrifuged at 3000×g to extrude the marrow. The bone was removed and discarded and the distal tibial marrow was then processed in the same manner as the WAT, described above.
Femur/Tibia rMAT
Both femurs were isolated and cleaned and the ends were removed with the rotary tool to expose the marrow cavity. The femurs and the proximal tibiae were inverted into 1.5 mL microtubes and centrifuged at 3000×g to separate the marrow. The bones were discarded. Gentle pipetting was used to combine and resuspend the proximal marrow in KRH containing 1 mg/mL collagenase and 3% BSA in a 50 mL conical tube. The suspension was then incubated in a shaking water bath at 100 rpm, 37°C for 30 – 45 minutes to liberate the rMAT adipocytes.
Vertebral cMAT
The most proximal ten tail vertebrae were separated and some of the surrounding muscle and tendon were removed with gauze. The vertebrae were added to a 50 mL conical tube with 2× the volume of KRH + 1 mg/mL collagenase and 3% BSA. The tube was then incubated in a shaking water bath at 100 rpm, 37°C for 20 minutes, with vigorous shaking by hand every 5 minutes to help dislodge remaining tissue on the outside of the vertebrae. After 20 minutes, the vertebrae solution was poured into a 10 cm dish. The vertebrae were quickly cleaned with gauze to remove any remaining soft tissue. Each vertebrae was then bisected longitudinally with a diagonal cutter and put into a fresh 50 mL conical tube containing 2× the volume of KRH/collagenase/BSA solution. The bisected vertebrae were incubated in a shaking water bath at 100 rpm, 37°C for an additional 30 minutes to liberate the cMAT adipocytes.
Vertebral rMAT
Eight lumbar vertebrae were isolated and cleaned with gauze. The processing then continued as described for the vertebral cMAT above.
Final Processing for all adipocyte types
After filtration, the conical tubes were centrifuged at 400×g for 1 minute to pellet the stromal vascular fraction and float the adipocytes. The pellet and the majority of the infranatant was carefully removed with a (glass pipet) and suction bulb. A plastic 1000 mL pipet tip was used to resuspend the adipocytes and transfer 300 μL of liquid containing 0.1 to 1.0 mg of cells to a 24-well plate size transwell insert with 8 μm pores (Corning Inc, Corning, NY; Cat: 3422). Approximately 90% of the liquid was removed by pressing the transwell membrane on a piece of dry paper towel. The cells in the insert were then washed twice in this manner with fresh KRH (no collagenase, no BSA). After the final wash and liquid depletion, the cells in the insert were collected in 300 μL of water and transferred immediately to a borosilicate glass tube for lipid extraction as described below.
Lipidomic Analyses of Rat Adipocytes
Lipid extraction
Lipids from the adipocyte samples were extracted following essentially the Bligh and Dyer method of solvent partition ^45^. A typical extraction procedure consists of suspending the cells in a borosilicate glass tube in 0.3 mL of water followed by adding 1.125 mL of a mixture of chloroform-methanol (1:2). The mixture was then vortexed to disrupt the cells. The samples were further treated with 0.375 mL each of chloroform and NaCl (0.9%) solution followed by vortexing and centrifugation at 4°C, 6500×g, for 7 minutes. The lower organic (chloroform) layer containing the total lipids was separated out and saved at −20°C for further use.
Preparation of methyl ester with Boron trifluoride-methanol and purification
The fatty acid components of the lipids were derivatized into their methyl esters via trans-esterification with boron trifluoride (BF_3_)-methanol ^46^ after slight modification as follows. The solvents of the above lipid extract were removed under nitrogen. To the dry residue, 2 ml of BF_3_-methanol (14% solution) and 10 μL of 4 mM heptadecanoic acid (C_17_) as an internal standard were added; the tubes containing the mixture were closed under nitrogen and incubated at 68°C for 3 - 3.5 h. The methyl esters were extracted by adding 2 mL of hexane and 1 mL of water, mixing followed by centrifugation. The hexane layer containing methyl esters was transferred into a separate tube. The solvent was then removed under nitrogen, the methyl esters were re-dissolved in to a small volume of hexane and purified by thin-layer chromatography (TLC) using n-hexane-diethyl ether-acetic acid (50:50:2, v/v) as the developing solvents ^47^ applying authentic standard fatty acid methyl ester (FAME) side by side on the TLC plate. After development, the plates were dried and sprayed with Premulin ^48^. The products were identified with respect to the retention flow (rf = 0.67) of the standard. The methyl esters were extracted from the TLC powder with diethyl ether, the volumes were concentrated under nitrogen, re-dissolved in 100 μL of hexane and the fatty acid compositions of the lipids were analyzed by gas chromatography as follows.
Gas chromatography (GC) of fatty acid methyl ester
Analysis of FAMEs was performed with 1 μL of sample injection, by GC on an Agilent GC machine, model 6890N equipped with flame ionization detector (FID), an auto sampler and a Chemstation software for data analysis. The GC column used was Agilent HP 88, 30 meter, 0.25 mm I.D. and film thickness 0.20 μm. Hydrogen was used as a carrier gas as well as for FID detector and nitrogen was used as a makeup gas. Analyses were carried out with a temperature programming of 125°C to 220°C. The fatty acid components in unknown samples were identified with respect to the retention times of standard methyl ester mixtures run side by side. The fatty acid components were quantified with respect to the known amount C_17_ internal standard added and the calibration ratio derived from each fatty acid of a standard methyl esters mixture and the methyl heptadecanoate (C_17_) internal standard.
Adipocyte Isolation for qPCR
Adipocytes were isolated from two cohorts of animals, 16-week old male Sprague Dawley rats and ~8 month old female Sprague Dawley rats as described above. Adipocytes, including rMAT from the proximal tibia and femur, were then isolated from a third cohort of 16-week old male Sprague Dawley rats by adding 50 U/mL heparin to the collagenase solution. Adipocyte preparations were lysed and processed using Stat60 reagent (Amsbio, Cambridge, MA, USA) to isolate total RNA. Pelleted RNA was resuspended in water and 100 μg of total RNA was reverse-transcribed to cDNA using TaqMan RT reagents (Applied Biosystems, Carlsbad, CA, USA). Quantitative PCR was performed using qPCRBIO SyGreen 2× mix, Hi-Rox, on an Applied Biosystems real-time PCR detection system (Applied Biosystems, Carlsbad, CA, USA). Gene expression was calculated based on a cDNA standard curve within each plate and normalized to the expression of TBP mRNA. Primer sequences are presented in Supplementary Table 1.
Statistics
Graphpad Prism® software was used to perform statistical tests. Tests including a two-tailed, homoscedastic t-Test, a non-parametric Mann-Whitney test, two-way ANOVA with Sidak's multiple comparisons test, and one-way ANOVA with Tukey's multiple comparisons test were applied as indicated in the figure legends. Principal components analysis was performed using MetaboAnalyst ^21^. When possible, sample size was determined based on the effect size of preliminary data and data analysis was performed by an investigator that was blinded to the sample groups.
Supplementary Material
1
The reference list from the paper itself. Each links out to its DOI / PubMed record.
- 1Cawthorn WP Bone Marrow Adipose Tissue Is an Endocrine Organ that Contributes to Increased Circulating Adiponectin during Caloric Restriction.Cell Metab 2014203683752499891410.1016/j.cmet.2014.06.003PMC 4126847 · doi ↗ · pubmed ↗
- 2Scheller EL Rosen CJ What's the matter with MAT? Marrow adipose tissue, metabolism, and skeletal health.Ann N Y Acad Sci 2014131114302465021810.1111/nyas.12327 PMC 4049420 · doi ↗ · pubmed ↗
- 3Fazeli PK Marrow fat and bone--new perspectives.The Journal of clinical endocrinology and metabolism 2013989359452339316810.1210/jc.2012-3634 PMC 3590487 · doi ↗ · pubmed ↗
- 4Motyl KJ Mc Cabe LR Leptin treatment prevents type I diabetic marrow adiposity but not bone loss in mice.J Cell Physiol 20092183763841893220310.1002/jcp.21608 PMC 2592498 · doi ↗ · pubmed ↗
- 5Botolin S Mc Cabe LR Inhibition of PPA Rgamma prevents type I diabetic bone marrow adiposity but not bone loss.Journal of cellular physiology 20062099679761697224910.1002/jcp.20804 · doi ↗ · pubmed ↗
- 6Iwaniec UT Turner RT Failure to generate bone marrow adipocytes does not protect mice from ovariectomy-induced osteopenia.Bone 2013531451532324679210.1016/j.bone.2012.11.034PMC 3564669 · doi ↗ · pubmed ↗
- 7Miyakoshi N Sato K Abe T Tsuchida T Tamura Y Kudo T Histomorphometric evaluation of the effects of ovariectomy on bone turnover in rat caudal vertebrae.Calcif Tissue Int 1999643183241008922510.1007/s 002239900626 · doi ↗ · pubmed ↗
- 8Li M Shen Y Qi H Wronski TJ Comparative study of skeletal response to estrogen depletion at red and yellow marrow sites in rats.The Anatomical record 1996245472480880040510.1002/(SICI)1097-0185(199607)245:3<472::AID-AR 3>3.0.CO;2-U · doi ↗ · pubmed ↗