NR3C1, LAX1, and RCAN3 as Circulating Epigenetic Biomarkers for Prognosis and Chemotherapy Response Prediction in Metastatic Pancreatic Cancer
Pablo Cano‐Ramírez, Marta Toledano‐Fonseca, María Teresa Cano‐Osuna, Nerea Herrera‐Casanova, Emilio Carrillo‐Pecero, Antonio Rodríguez‐Ariza, Enrique Aranda, María Victoria García‐Ortiz

TL;DR
This study identifies three genes (LAX1, NR3C1, and RCAN3) with altered methylation in blood DNA as potential non-invasive biomarkers for predicting prognosis and chemotherapy response in metastatic pancreatic cancer.
Contribution
The study introduces cfDNA methylation of LAX1, NR3C1, and RCAN3 as novel prognostic and predictive biomarkers for mPDAC.
Findings
Altered methylation of LAX1, NR3C1, and RCAN3 in cfDNA was associated with poor prognosis in metastatic pancreatic cancer patients.
Baseline NR3C1 methylation predicted chemotherapy response with 75% sensitivity and 92.86% specificity.
Methylation levels of these genes correlated with other biomarkers like CA19-9 and cfDNA fragmentation.
Abstract
Pancreatic cancer remains highly lethal, largely due to late diagnosis and limited efficacy of treatments. Improving first‐line treatment selection and patient monitoring requires novel, non‐invasive biomarkers beyond carbohydrate antigen 19‐9 (CA19‐9) and imaging. This study investigates epigenetic biomarkers from liquid biopsy with prognostic and predictive potential in metastatic pancreatic ductal adenocarcinoma (PDAC; mPDAC). Genome‐wide methylation profiling of cell‐free DNA (cfDNA) from healthy individuals and stage IV mPDAC patients identified 13 gene‐associated CpG sites with significantly altered methylation patterns. ddPCR validation confirmed consistent methylation differences in lymphocyte transmembrane adaptor 1 (LAX1), nuclear receptor subfamily 3 group C member 1 (NR3C1), and RCAN3 between healthy and patient groups. Elevated LAX1 and RCAN3 methylation and reduced NR3C1…
Genes, proteins, chemicals, diseases, species, mutations and cell lines named across the full text — each resolved to its canonical identifier and authoritative record.
Click any figure to enlarge with its caption.
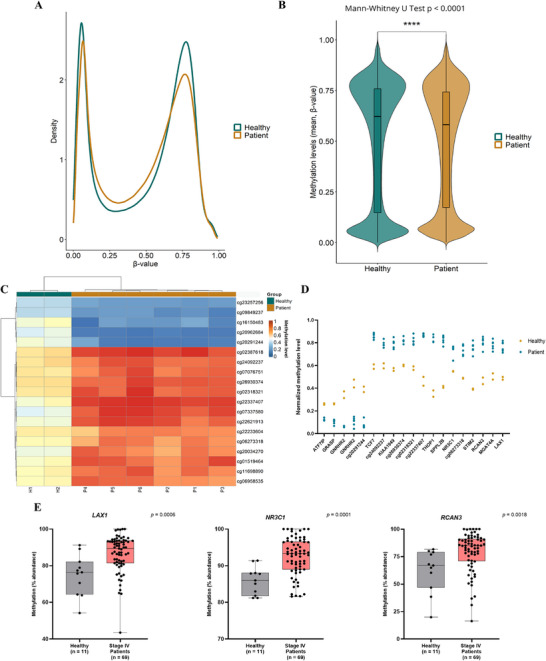 FIGURE 1
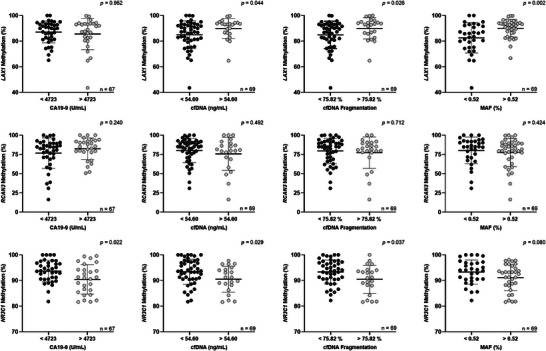 FIGURE 2
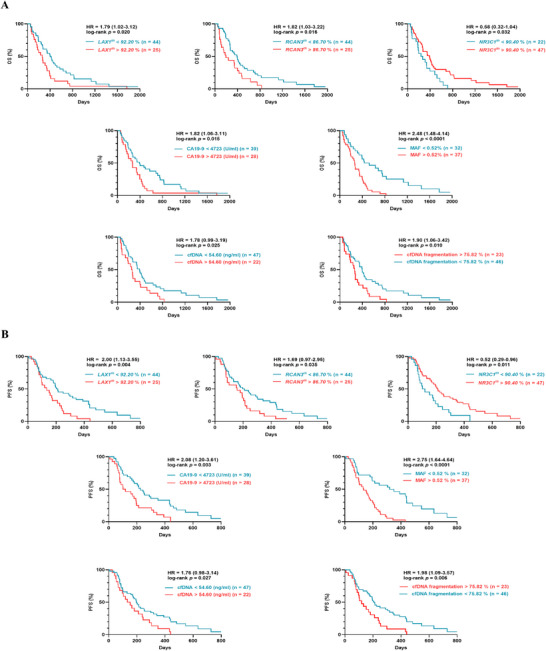 FIGURE 3
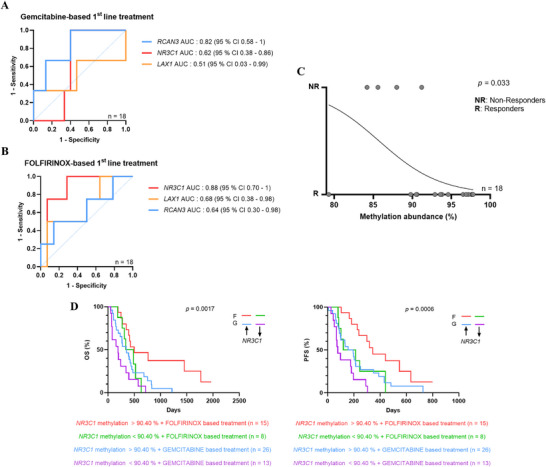 FIGURE 4
| Patient characteristics | Number of patients ( | Percentage |
|---|---|---|
|
| ||
| ≤ 65 years | 41 | 59.4 |
| > 65 years | 28 | 40.6 |
|
| ||
| Male | 41 | 59.4 |
| Female | 28 | 40.6 |
|
| ||
| IV | 69 | 100 |
|
| ||
| 0 | 32 | 46.4 |
| 1 | 28 | 40.6 |
| 2/3 | 9 | 13 |
|
| ||
| FOLFIRINOX‐based | 23 | 33.3 |
| Gemcitabine‐based | 39 | 56.5 |
| Others | 5 | 7.2 |
| No treatment | 2 | 2.9 |
|
| ||
| Never | 32 | 46.4 |
| < 1 pack/day | 16 | 23.2 |
| > 1 pack/day | 20 | 29.0 |
| N/A | 1 | 1.4 |
|
| ||
| Never | 38 | 55.1 |
| Ocassional | 15 | 21.7 |
| Current daily | 14 | 20.3 |
| N/A | 2 | 2.9 |
|
| ||
| No | 45 | 65.2 |
| Yes | 24 | 34.8 |
|
| ||
| Yes | 35 | 50.7 |
| No | 34 | 49.3 |
|
| ||
| Head | 20 | 29 |
| Tail | 21 | 30.4 |
| Body | 26 | 37.7 |
| N/A | 2 | 2.9 |
|
| ||
| Non‐hepatic | 9 | 13 |
| Hepatic | 60 | 87 |
|
| ||
|
| 55 | 79.7 |
|
| 14 | 20.3 |
| Variables | Median OS | OS | Median PFS | PFS | ||
|---|---|---|---|---|---|---|
| (days) | HR (95% CI) |
| (days) | HR (95% CI) |
| |
|
| ||||||
| ≤ 65 yearsa | 274 | 0.974 | 0.918 | 180 | 0.873 | 0.590 |
| > 65 years | 372 | (0.591–1.606) | 204 | (0.527–1.447) | ||
|
| ||||||
| Malea | 264 | 1.849 | 0.014 | 133 | 2.085 | 0.003 |
| Female | 440 | (1.128–3.031) | 295 | (1.270–3.423) | ||
|
| ||||||
| 0a | 419 | 232 | ||||
| 1 | 266 | 0.567 (0.324–0.994) | 0.030 | 163 | 0.555 (0.316–0.975) | 0.024 |
| 2 or 3 | 142 | 0.389 (0.140–1.084) | 0.009 | 65 | 0.365 (0.127–1.044) | 0.005 |
|
| ||||||
| FOLFIRINOX‐baseda | 482 | 0.459 | 0.004 | 299 | 0.457 | 0.005 |
| Gemcitabine‐based | 264 | (0.272–0.775) | 133 | (0.271–0.773) | ||
|
| ||||||
| Hepatic | 292 | 2.012 | 0.068 | 167 | 2.482 | 0.015 |
| Non‐hepatic | 435 | (1.086–3.726) | 391 | (1.388–4.437) | ||
|
| ||||||
| Never | 273 | 187 | ||||
| < 1 pack/day | 370 | 0.897 (0.468–1.720) | 0.732 | 200 | 0.964 (0.507–1.832) | 0.909 |
| > 1 pack/day | 351 | 0.836 (0.463–1.511) | 0.534 | 156 | 0.799 (0.441– 1.450) | 0.443 |
|
| ||||||
| Never | 293 | 204 | ||||
| Ocassional | 397 | 0.816 (0.432–1.542) | 0.504 | 203 | 0.752 (0.393– 1.440) | 0.350 |
| Current daily | 227 | 0.586 (0.279–1.228) | 0.088 | 99 | 0.524 (0.243– 1.129) | 0.040 |
|
| ||||||
| No | 338 | 0.918 | 0.729 | 196 | 1.007 | 0.977 |
| Yes | 345 | (0.560–1.504) | 174 | (0.615–1.650) | ||
|
| ||||||
| No | 336 | 1.157 | 0.560 | 180 | 1.141 | 0.616 |
| Yes | 349 | (0.696–1.923) | 199 | (0.686–1.897) | ||
|
| ||||||
| Head | 292 | 0.800 | 0.422 | 187 | 0.681 | 0.153 |
| Body/tail | 339 | (0.469–1.363) | 174 | (0.405–1.146) |
| Probe ID | Methylation difference in mPDAC |
Adj
| Chromosome | Probe position | Associated gene | Gene feature |
|---|---|---|---|---|---|---|
| cg07337580 |
| 0.0046 | 19 | 2809333 |
| Body‐shore |
| cg22621913 |
| 0.0065 | 19 | 2352414 |
| Body‐island |
| cg02387618 |
| 0.0342 | 5 | 133453480 |
| Body‐shelf |
| cg22337407 |
| 0.0342 | 1 | 11046185 | IGR | |
| cg20962684 |
| 0.0389 | 1 | 145515327 |
| Body‐shore |
| cg06273318 |
| 0.0432 | 2 | 64553381 | IGR | |
| cg22233604 |
| 0.0432 | 5 | 142729377 |
| Body‐opensea |
| cg26930374 |
| 0.0432 | 14 | 23013826 | IGR | |
| cg24092237 |
| 0.0432 | 14 | 22995133 | IGR | |
| cg16150483 |
| 0.0432 | 1 | 145515286 |
| Body‐shore |
| cg02318321 |
| 0.0432 | 14 | 23007177 | IGR | |
| cg11698890 |
| 0.0432 | 2 | 99254310 |
| Body‐opensea |
| cg20291244 |
| 0.0432 | 11 | 11820535 | IGR | |
| cg06958535 |
| 0.0457 | 1 | 203734478 |
| First exon |
| cg07076751 |
| 0.0457 | 6 | 30647539 |
| Body‐opensea |
| cg23257256 |
| 0.0457 | 12 | 14538000 |
| 5'UTR‐opensea |
| cg01519464 |
| 0.0457 | 1 | 24861818 |
| 3'UTR‐island |
| cg20034270 |
| 0.0457 | 4 | 26886485 |
| Body‐opensea |
| cg09849237 |
| 0.0457 | 12 | 52404250 |
| Body‐shelf |
| Variable | At diagnosis (%) | Median OS (days) | OS HR (95% CI) |
| Median PFS (days) | PFS HR (95% CI) |
|
|---|---|---|---|---|---|---|---|
|
|
| ||||||
| > 4723 (U/mL) | 28 (42%) | 266 | 1819 | 0.014 | 110 | 2078 | 0.0025 |
| ≤ 4723 (U/mL) | 39 (58%) | 391 | (1.063–3.113) | 226 | (1.196–3.608) | ||
|
| |||||||
| > 54.60 (ng/mL) | 22 (32%) | 254 | 1778 | 0.025 | 143 | 1755 | 0.027 |
| ≤ 54.60 (ng/mL) | 47 (68%) | 391 | (0.990–3.192) | 196 | (0.980–3.144) | ||
|
| |||||||
|
| 55 (80%) | 271 | 3021 | 0.0001 | 164 | 3148 | < 0.0001 |
|
| 14 (20%) | 658 | (1.815–5.027) | 440 | (1.878–5.278) | ||
|
| |||||||
| > 0.52 % | 37 (54%) | 264 | 2478 | < 0.0001 | 133 | 2753 | < 0.0001 |
| ≤ 0.52 % | 32 (46%) | 479 | (1.484–4.139) | 319 | (1.635–4.636) | ||
|
| |||||||
| > 75.82 % | 23 (33%) | 260 | 1906 | 0.010 | 119 | 1975 | 0.006 |
| ≤ 75.82 % | 46 (67%) | 397 | (1.062–3.422) | 213 | (1.094–3.565) | ||
|
| |||||||
| > 92.20 % | 25 (36%) | 260 | 1787 | 0.020 | 133 | 2002 | 0.004 |
| ≤ 92.20 % | 44 (64%) | 419 | (1.024–3.119) | 213 | (1.130–3.549) | ||
|
| |||||||
| > 86.70 % | 25 (36%) | 194 | 1824 | 0.016 | 157 | 1690 | 0.035 |
| ≤ 86.70 % | 44 (64%) | 395 | (1.033–3.220) | 204 | (0.967–2.953) | ||
|
| |||||||
| > 90.40 % | 47 (68%) | 391 | 0.578 | 0.032 | 211 | 0.524 | 0.011 |
| ≤ 90.40 % | 22 (32%) | 254 | (0.320–1.044) | 110 | (0.285–0.963) |
- —Instituto de Salud Carlos III10.13039/501100004587
- —European Union10.13039/501100000780
- —Consejería de Universidad, Investigación e Innovación, Junta de Andalucía10.13039/501100025471
- —Beca Carmen Delgado/Miguel Pérez‐Mateo 2024
- —Program “Nicolás Monardes” from Junta de Andalucía
Peer Reviews
No public reviews on file for this paper yet. If you reviewed it on a platform where reviews are public (OpenReview, ICLR, NeurIPS, ICML), you can paste yours below so the community can read it here.
Videos
No videos yet. Explain this paper in a talk, walkthrough, or lecture? Add one.
Taxonomy
TopicsSignaling Pathways in Disease · Reproductive System and Pregnancy · Pancreatic and Hepatic Oncology Research
Background
1
Pancreatic cancer is one of the deadliest malignancies, with a 5‐year survival rate of 8.2% [1]. Risk factors comprise family history, obesity, diabetes, smoking, and high alcohol consumption [2, 3]. Specifically, pancreatic ductal adenocarcinoma (PDAC) represents nearly 90% of pancreatic malignancies [4] and is characterized with dismal prognosis due to the lack of specific symptoms in the early stages of the disease [5], the absence of effective diagnostic methods, and the low efficacy of current treatments [6]. As a result, most patients (> 75%) are diagnosed at an advanced or metastatic stage, and only 15%–20% are candidates for curative surgery. Even following resection, relapse occurs early, resulting in a median survival of 10–20 months [7]. In metastatic cases, median overall survival (OS) from diagnosis is approximately 4.6 months [8].
FOLFIRINOX (a combination of fluorouracil, irinotecan, leucovorin, and oxaliplatin) and gemcitabine are the primary first‐line treatments for metastatic PDAC patients. FOLFIRINOX treatment has been reported to offer improved survival over gemcitabine‐based regimens, although response is heterogeneous and not all patients benefit [9]. Indeed, as a more aggressive therapy with higher toxicity (Grade 3/4), FOLFIRINOX‐based therapy is reserved for patients with a good ECOG (Eastern Cooperative Oncology Group) performance status [10, 11].
In recent years, advances in the analysis of tumor tissues and cell lines have improved our understanding of pancreatic cancer and led to the identification of distinct molecular subtypes [12]. Notably, Moffitt et al. proposed a gene expression‐based classification that accounted for stromal contamination in PDAC samples, identifying two main subtypes: basal‐like, associated with poorer survival, and classical, linked to more favorable outcomes [13]. Despite these advances, molecular classification of pancreatic cancer remains in its early stages, and there is currently no consensus on its clinical implementation for patient management [14].
Currently, carbohydrate antigen 19‐9 + remains the only blood‐based biomarker used to guide clinical management in pancreatic cancer, though it has relatively low sensitivity (79%) and specificity (82%) [15]. While CA19‐9 levels are linked to survival in mPDAC patients [16], there is no consensus on how changes in CA19‐9 levels should be interpreted during the disease progression [17]. Consequently, effective biomarkers are required to inform prognosis at diagnosis, as well as to support ongoing monitoring aimed at detecting early recurrence after surgical resection or treatment failure in advanced cases.
Compared to tumor biopsies, analysis of cell‐free DNA (cfDNA) in liquid biopsies provides a more comprehensive overview of the tumor landscape, as cfDNA is released from multiple tumor regions and metastatic sites, thereby capturing tumor heterogeneity [18]. In addition, liquid biopsy offers higher sensitivity than conventional imaging techniques, enabling the detection of tumors composed of as few as 50 million malignant cells, which remain undetectable by computed tomography (CT) that typically requires tumor burdens exceeding one billion cells (approximately 7–10 mm) [19].
Importantly, the minimally invasive nature of liquid biopsy allows for sequential sampling and longitudinal monitoring, facilitating the dynamic assessment of cfDNA concentration and fragmentation [20], as well as the emergence of genetic or epigenetic alterations associated with tumor evolution and treatment response [21].
In this regard, our group has demonstrated the utility of the RAS mutant allele fraction (MAF) and NPTX2 methylation dynamics in monitoring pancreatic disease evolution in advanced stage, both showing a strong correlation with CT scan results [20, 22]. Notably, dynamic variations in NPTX2 methylation anticipated disease progression detected by CT scans and CA19‐9 measurements [22].
However, studies identifying epigenetic biomarkers that enable a personalized therapeutic approach for pancreatic cancer are limited and often conducted in cell lines [23, 24, 25].
In the present study, we have identified epigenetic biomarkers in cfDNA that have the potential to guide first‐line treatment in patients with metastatic pancreatic cancer and monitor disease progression. Using a methylation array to profile cfDNA from both healthy individuals and stage IV pancreatic cancer patients, three differentially methylated genes were identified. Subsequent validation confirmed this cfDNA methylation profile and demonstrated that circulating nuclear receptor subfamily 3 group C member 1 (NR3C1) methylation could effectively stratify patients based on their response to first‐line FOLFIRINOX treatment, offering valuable insights into disease progression and correlating with treatment outcomes.
Results
2
Analysis of Patient Clinicopathological Characteristics
2.1
The clinicopathological characteristics of the patients are summarized in Table 1. Among the 69 patients included in the study, 28 were female, and 41 were male, with ages ranging from 48 to 84 years and a median age of 65. The primary tumor locations varied, with occurrences in the head (29%), tail (30.4%), and body (37.7%) and two cases where the location was undetermined. All patients presented with mPDAC, and liver metastases were observed in 87% of cases. Most patients (87%) had a good baseline performance status, classified as ECOG 0–1, and gemcitabine‐based regimens were the most commonly administered treatment, used in 56.5% of cases. RAS mutations were detected in plasma in 79.7% of patients. The prevalence of risk factors was as follows: cigarette smoking in 52.2%, alcohol consumption in 42%, diabetes mellitus in 34.8%, and arterial hypertension in 50.7% of the patients.
Disease progression occurred in 67 out of 69 patients, and by the conclusion of the study, 63 had reached exitus, while six remained alive. No differences in OS or progression‐free survival (PFS) were observed when patients were stratified by age, tobacco smoking, occasional alcohol consumption, diabetes mellitus, arterial hypertension, or primary tumor location (Table 2). A longer PFS was observed in patients with non‐hepatic metastases (p = 0.015), whereas PFS was significantly shorter in daily drinkers, compared to those patients who never consumed alcohol (p = 0.040). FOLFIRINOX‐based first‐line treatment, female gender, and ECOG 0 status were associated with better OS (p = 0.004, p = 0.014, and p = 0.030 vs. ECOG 1 and p = 0.009 vs. ECOG 2, respectively) and PFS (p = 0.005, p = 0.003, and p = 0.024 vs. ECOG 1 and p = 0.005 vs. ECOG 2, respectively).
Differentially Methylated Regions in cfDNA From Healthy Individuals and Patients With mPDAC
2.2
To thoroughly investigate the differences in methylation patterns between healthy and mPDAC conditions, a methylation array was performed using the Illumina EPIC 850k BeadChip, with cfDNA extracted from two healthy individuals and six mPDAC individuals at the time of diagnosis as the starting material. The β‐values in the two groups exhibited characteristic bimodal distributions (Figure 1A), with mPDAC patients, on average, showing lower methylation levels than healthy individuals (p < 0.0001; Figure 1B). Additionally, 19 differentially methylated CpG positions (adjusted p‐value ≤ 0.05) were identified, with 14 hypermethylated and five hypomethylated in stage IV pancreatic cancer patients, compared to healthy controls (Figure 1C,D). Most of these CpG sites (68%) are located within genic regions, with more than half situated in CpG islands or their flanking regions (Table 3).
*Landscape of DNA methylation in cfDNA from healthy individuals and metastatic PDAC (mPDAC) patients. (A) Density plot displaying the characteristic bimodal distribution of methylation β‐values in the two groups based on EPIC array analysis data. (B) Violin plot for the overall beta value distribution, showing the mean methylation values. ***p < 0.0001. (C) Heat map and hierarchical clustering analysis of the EPIC array based on the 19 differentially methylated CpGs (adj. p < 005) between healthy controls (H1 and H2) and mPDAC patients at diagnosis (P1‐P6). Methylation levels were scaled from 0 to 1. (D) Normalized methylation levels of the 19 most significant differentially methylated CpGs between healthy individuals and mPDAC patients. (E) Relative CpG methylation levels of LAX1, NR3C1, and RCAN3 genes detected by ddPCR in plasma cfDNA from healthy individuals (n = 11) and mPDAC patients (n = 69). Data are mean ± SD.
Among the 13 differentially methylated CpG positions associated with genes in patients with mPDAC, compared to healthy individuals (adjusted p‐value ≤ 0.05), we focused on those hypermethylated sites to perform a first validation using droplet digital PCR (ddPCR). This approach employed methylation controls and probes specifically targeting CpG positions identified as differentially methylated in the array analysis. Only those CpG positions showing a relative methylation abundance ≥ 95% in methylated and ≤ 5% in unmethylated control DNA samples (lymphocyte adaptor 1 [LAX1], RCAN3, NR3C1, and KIAA1949; Table S1) were selected for further analysis.
These four targets were validated by ddPCR in the study's extended cohort of healthy individuals and mPDAC patients. This analysis confirmed statistically significant differences in methylation levels for LAX1 (p = 0.0006), NR3C1 (p = 0.0001), and RCAN3 (p = 0.0018) between the two groups (Figure 1E), whereas no significant differences were observed for KIAA1949 (p = 0.5055; Figure S1). Considering the lower mean age of healthy controls compared to patients, we conducted additional analyses to determine whether age might confound the observed group differences in methylation levels of LAX1, RCAN3, and NR3C1. We applied multiple linear regression models including group (healthy vs. patient) and age as covariates. The analysis confirmed that group remained a significant predictor of methylation levels for LAX1 (p = 0.0073) and NR3C1 (p = 0.0005), while RCAN3 showed a borderline association (p = 0.0612; data not shown). In all cases, age did not exert a significant effect (LAX1 p = 0.9514, RCAN3 p = 0.7465, and NR3C1 p = 0.2049), indicating that the methylation differences between groups are not driven by age (Figure S2).
Basal Circulating Methylation Levels of LAX1, RCAN3, and NR3C1 Are Associated With Other Circulating Tumor Biomarkers in mPDAC
2.3
We examined the potential association between circulating methylation levels of LAX1, RCAN3, and NR3C1 and other tumor‐related circulating biomarkers, including RAS mutational status and RAS MAF in cfDNA, CA19‐9 levels or cfDNA concentration and fragmentation, in all 69 liquid biopsy samples obtained at diagnosis (Figure 2).
Association of basal circulating LAX1, RCAN3, and NR3C1 methylation levels with other circulating tumor biomarkers in mPDAC. LAX1, RCAN3, and NR3C1 methylation levels in plasma at diagnosis according to CA19‐9 levels, cfDNA concentration, cfDNA fragmentation, and RAS MAF. Cut‐off values for each biomarker were: 0.52 % for RAS MAF, 4723 U/mL for CA19‐9, 54.60 ng/mL for cfDNA concentration, and 75.82 % for cfDNA fragmentation. Data are mean ± SD.
For this analysis, cut‐off values according to OS for each biomarker were determined using the R2 platform. The LAX1 methylation levels were significantly elevated in those samples with a higher RAS MAF (92.10% vs. 84.65%, p = 0.002), higher cfDNA concentration (93.05% vs. 87.20%, p = 0.044), and higher cfDNA fragmentation (93% vs. 87.20%, p = 0.026). Conversely, elevated NR3C1 methylation was significantly associated with lower CA19‐9 levels (93.80% vs. 91.00%, p = 0.022), lower cfDNA concentration (93.65% vs. 91.20%, p = 0.029), reduced cfDNA fragmentation (93.70% vs. 91.10%, p = 0.037), and lower RAS MAF (93.29% vs. 91.10%, p = 0.080). Accordingly, circulating LAX1 methylation levels showed a significant positive correlation with cfDNA concentration, cfDNA fragmentation and RAS MAF, whereas NR3C1 methylation levels were negatively correlated with CA19‐9 levels, cfDNA concentration and cfDNA fragmentation (Figure S3).
Of note, cfDNA concentration and fragmentation were significantly higher in mPDAC patients, compared to healthy individuals (Figure S4). Finally, no significant association was observed between RCAN3 methylation levels and any of the other circulating biomarkers studied.
Circulating Biomarkers Showed Strong Prognostic Value in mPDAC
2.4
To evaluate the prognostic potential of circulating levels of LAX1, RCAN3, and NR3C1 methylation, along with other biomarkers, OS and PFS were analyzed using Kaplan–Meier curves with cut‐off values from R2 platform (Table 4 and Figure 3).
Circulating biomarkers show strong prognostic value in mPDAC plasma. (A) Overall survival (OS) and (B) progression‐free survival (PFS) according to LAX1 methylation, RCAN3 methylation, NR3C1 methylation, CA19‐9 levels, RAS MAF, cfDNA concentration, and cfDNA fragmentation.
As we previously reported, higher CA19‐9 levels, cfDNA concentration, cfDNA fragmentation, and higher RAS MAF load in cfDNA were associated with poor prognosis in mPDAC patients [20, 22]. Remarkably, LAX1, RCAN3, and NR3C1 methylation levels also significantly stratified mPDAC patients according to OS and PFS. Specifically, LAX1 methylation distinguished between low‐risk (419 days OS) and high‐risk (260 days OS) groups (p = 0.020; Figure 3A). Likewise, elevated RCAN3 methylation levels were associated with the high‐risk group (395 days), whereas lower methylation levels were observed in the low‐risk group (194 days). Interestingly, elevated NR3C1 methylation levels correlated with a more favorable prognosis, as reflected by a longer median OS of 391 days, compared to 254 days in patients with reduced NR3C1 methylation levels (p = 0.032). Importantly, these associations remained significant when ROC curve‐derived cut‐off values were applied, indicating that the prognostic impact of these markers is robust to the method used for cut‐off selection (Figure S5). In addition, a significant difference in PFS was observed between high‐ and low‐risk groups stratified according to the levels of non‐epigenetic circulating biomarkers analyzed (Figure 3B).
To assess the independent prognostic value of the proposed methylation biomarkers, multivariable Cox proportional hazards models were constructed for OS and PFS (Table S2). Remarkably, NR3C1‐gene methylation emerged as an independent prognostic factor (p = 0.05), together with baseline CA19‐9 levels (p = 0.012) and treatment regimen (p = 0.001). For PFS, multivariable analysis identified methylation of LAX1 gene (p = 0.044), cfDNA fragmentation (p = 0.006), RAS mutational status (p = 0.001), ECOG performance status (p = 0.003 and p = 0.013), and CA19‐9 levels (p = 0.001) as independent predictors of disease progression. Overall, these findings indicate that specific methylation markers retain independent prognostic value in multivariable models, with NR3C1 methylation being independently associated with OS and LAX1 methylation with PFS.
On the other hand, in those patients monitored using liquid biopsy following treatment initiation, plasma NR3C1 early methylation changes were found to correlate with clinical outcomes and survival. Specifically, a significant negative correlation was found between circulating NR3C1 methylation levels and survival (r = −0.337, p = 0.041; Figure S6). No significant correlations were observed for the remaining biomarkers, apart from cfDNA fragmentation, which also demonstrated a positive correlation with survival (r = 0.416, p = 0.008). These findings suggest that early changes in NR3C1 methylation levels in plasma may serve as a biomarker of disease evolution in patients with mPDAC.
Baseline Circulating NR3C1 Methylation Level Predicts FOLFIRINOX‐Based Regimen Outcome
2.5
Next, we evaluated whether circulating methylation levels of LAX1, RCAN3, or NR3C1 could predict treatment response. To this end, baseline methylation levels were compared with treatment outcomes (classified as responders or non‐responders) at the first follow‐up in two patient groups: 18 patients treated with FOLFIRINOX‐based therapy and 18 patients treated with gemcitabine‐based therapy. As shown by the ROC curve analyses (Figure 4), basal circulating methylation of none of the genes was found to be a reliable prognostic biomarker for first‐line gemcitabine‐based treatment (RCAN3 p = 0.086, NR3C1 p = 0.515; LAX1 p = 0.953; Figure 4A). In contrast, the basal circulating methylation level of NR3C1 proved to be a useful predictive biomarker for treatment outcome in patients receiving FOLFIRINOX‐based therapy, with a sensitivity of 75%, specificity of 92.86%, and an area under the curve (AUC) of 0.88 (95% CI: 0.70–1; p = 0.026; Figure 4B). This predictive value was further supported by simple logistic regression analysis (Figure 4C), which confirmed the ability of circulating NR3C1 methylation to stratify patients based on first‐line FOLFIRINOX‐based treatment response versus progression (non‐response; p = 0.033).
Basal circulating NR3C1 methylation level predicts FOLFIRINOX‐based regimen outcome in mPDAC patients. ROC curve analysis showing the predictive value of basal methylation levels of LAX1, RCAN3, and NR3C1 for disease progression at first follow‐up in mPDAC patients treated with (A) gemcitabine‐based or (B) FOLFIRINOX‐based first‐line regimens. (C) Simple logistic regression model evaluating the association between baseline NR3C1 methylation and treatment outcome in FOLFIRINOX‐treated mPDAC patients. (D) Kaplan–Meier curve analysis of OS and PFS in mPDAC patients stratified by basal NR3C1 methylation levels (90.4 % cut‐off) and first‐line treatment received (F: FOLFIRINOX; G: gemcitabine).
Subsequently, we evaluated the ability of circulating NR3C1 methylation to stratify the full 69‐patient cohort in terms of OS and PFS, according to the treatment received: FOLFIRINOX or gemcitabine. As shown in Figure 4D, Kaplan–Meier analysis revealed that those patients with basal NR3C1 methylation > 90.4 % that received first‐line FOLFIRINOX treatment exhibited better outcomes, with significantly improved OS (p = 0.0017) and PFS (p = 0.0006). These results reinforce the potential of NR3C1 methylation as a valuable biomarker for predicting treatment response and improving patient stratification in mPDAC, particularly for those undergoing FOLFIRINOX‐based therapy.
Aberrant Methylation of the NR3C1 Promoter Contributes to Its Transcriptional Downregulation in PDAC
2.6
To further investigate the role of NR3C1 methylation in PDAC, DNA methylation profiles from The Cancer Genome Atlas (TCGA) were analyzed using the Shiny Methylation Analysis Resource Tool (SMART). The dataset included Illumina Human Methylation 450K data from 10 normal tissue samples and 184 PDAC tumor tissue samples. NR3C1 promoter methylation was assessed by calculating the average β value across 17 CpGs within the CpG island located in the proximal promoter region. This analysis revealed significantly higher levels of NR3C1 promoter methylation in PDAC tumors, compared to normal tissue (p < 0.0001; Figure S7A).
Next, we examined the relationship between NR3C1 promoter methylation and gene expression in PDAC. Pearson correlation revealed a significant inverse correlation at 16 out of 17 CpGs sites within the proximal promoter CpG island, with correlation coefficients ranging from −0.45 to −0.13, p < 0.05 (Figure S7B,C). These results suggest that aberrant methylation of the NR3C1 promoter contributes to its transcriptional downregulation in PDAC, with multiple CpG sites likely playing a critical role in silencing gene expression.
Discussion
3
Surgical resection is the only potentially curative option for PDAC, yet most patients present with unresectable disease at diagnosis [26]. Unresectable patients are typically managed with FOLFIRINOX‐ or gemcitabine‐based regimens [4]. Although FOLFIRINOX provides survival benefits, its substantial toxicity makes it unsuitable for many patients, and responses remain highly variable [9]. First‐line therapy selection relies mainly on the patient's ECOG performance status [10], prioritizing tolerability over therapeutic efficacy. Therefore, identifying predictive biomarkers to guide first‐line treatment selection and monitor disease progression remains a critical unmet need in mPDAC.
In this study, we assess the predictive value of liquid biopsy–derived epigenetic markers for treatment response in patients with metastatic PDAC. First, by using high‐throughput methylation array profiling and validation by ddPCR, we have demonstrated the aberrant methylation of three specific genes, LAX1, RCAN3, and NR3C1, in cfDNA from PDAC patients. These results underscore the potential value of these epigenetic alterations as candidate PDAC biomarkers that may contribute to the development of minimally invasive tools for disease detection and monitoring.
On the other hand, unlike these three targets, KIAA1949 reached significance in the discovery array but did not show significant differences in ddPCR. This discrepancy may be due to several factors. There may be differences in CpG coverage between the array probe and the ddPCR assay, or it may reflect assay sensitivity and design, as in some cases, ddPCR may fail to detect subtle methylation differences reported by the array, particularly when the methylation change is small or the amount of input DNA is limited [27, 28].
The expression of LAX1 has been shown to inversely correlate with DNA methylation levels [29], and several studies have reported that LAX1 expression is negatively regulated by DNA hypermethylation [30, 31]. In this context, analyses from the TCGA Genomic Data Analysis Center identified the CpG site cg06958535 within LAX1 as one of the CpG sites most strongly inversely correlated with gene expression in PDAC, showing a Spearman correlation of −0.81, supporting a methylation‐dependent regulation of LAX1 expression [32]. Moreover, the expression of LAX1 has been previously described as a positive prognostic biomarker in several cancer types. Specifically, LAX1 expression is associated with favorable outcomes in ER‐/HER2 breast cancer [29], disease‐free survival when combined with other biomarkers in ovarian cancer [33], and recurrence‐free survival in colorectal cancer [34]. These findings support our observations in mPDAC patients, where higher LAX1 methylation levels were associated with shorter OS and PFS. Furthermore, LAX1 methylation levels significantly correlated with previously reported negative prognostic cfDNA‐based markers in metastatic PDAC, such as total cfDNA concentration, cfDNA fragmentation, and RAS MAF [20, 35], reinforcing the clinical relevance of LAX1 methylation status in mPDAC. Notably, while LAX1 expression has also been linked to increased sensitivity to platinum‐based chemotherapy in ovarian cancer [33] and to FOLFOX in colorectal cancer [34], such associations have not yet been demonstrated in the context of PDAC.
RCAN3 (RCAN Family Member 3) is located on chromosome 1 (1p36.11) and plays a role in calcium signaling through its function as a regulator of calcineurin [36]. Previous studies have demonstrated that RCAN3 expression is negatively regulated by DNA methylation [37]. Furthermore, RCAN3 has been characterized as a tumor suppressor gene, with reported roles in inhibiting tumor growth and angiogenesis in a human breast cancer model [38]. These findings are consistent with our current results from array and validation analyses, where increased methylation levels of RCAN3 were observed in plasma samples from mPDAC patients. Kaplan–Meier survival analyses further revealed that patients classified in the high‐risk group for RCAN3 methylation exhibited significantly lower OS and PFS. This observation agrees with findings by Wang et al., who reported that higher RCAN3 expression was associated with improved prognosis in patients with pheochromocytoma and paraganglioma, suggesting a potential context‐dependent role of RCAN3 in tumor progression and patient outcome [39].
NR3C1 is located on chromosome 5 (5q31.3) and encodes the glucocorticoid receptor (GR) [40, 41, 42]. NR3C1 is broadly expressed across most cell types, with particularly high expression levels in pancreatic islets [43, 44]. As a transcription factor, GR modulates various molecular pathways by binding to glucocorticoid response elements, though its downstream effects can vary depending on cell type and tissue context, and it is differentially expressed in healthy and tumor tissues [43, 45]. NR3C1 is known to regulate a variety of signaling cascades, including those associated with inflammatory responses like NF‐κB and cell survival through SGK1, as well as broader biological processes, including differentiation, energy metabolism, immunity, neuroendocrine integration, and cell cycle regulation [41, 46, 47].
NR3C1 expression has been shown to be reduced in several cancer types, including lung, bladder, prostate, and cervical cancers, compared to corresponding normal tissues [45]. Consistent with previous reports [48, 49], our analysis of TCGA data indicates that increased methylation of the NR3C1 promoter is associated with its reduced transcription in PDAC. Besides, our array and validation analyses identified significantly higher circulating NR3C1 methylation levels in metastatic PDAC patients, compared to healthy controls, supporting a potential role of NR3C1 silencing in advanced disease. However, our survival analysis revealed an association of elevated circulating NR3C1 methylation levels and better outcome in metastatic PDAC. Moreover, low NR3C1 methylation levels were consistently detected in samples characterized by higher values of CA19‐9, RAS MAF, and cfDNA concentration and fragmentation. Deng et al. reported in 2021 that higher NR3C1 expression in PDAC is associated with poorer patient survival [50]. Notably, our results align with these previous findings, suggesting that elevated NR3C1 methylation, and consequently reduced expression, may be associated with improved outcomes in metastatic PDAC patients treated with FOLFIRINOX‐based chemotherapy regimens.
Furthermore, although the role of NR3C1 as a transcription factor is well established, recent evidence has uncovered an additional function in mediating chemotherapy resistance. In gastric cancer, NR3C1 has been recently identified as a component of a transcriptional complex contributing to resistance to 5‐Fluorouracil [51], which is a key component of the FOLFIRINOX regimen, by promoting the transcription of downstream resistance‐associated genes [52]. In fact, NR3C1 has been shown to directly regulate ABCC1, which encodes the ABC transporter MRP1 [51], a membrane protein involved in the efflux of multiple chemotherapeutic agents, including FOLFIRINOX components such as irinotecan and leucovorin, thereby limiting their intracellular accumulation [53]. This NR3C1–ABCC1 axis provides a plausible molecular mechanism through which altered NR3C1 regulation may modulate FOLFIRINOX sensitivity. In the context of PDAC, response to FOLFIRINOX has been shown to differ by molecular subtype. Lansbergen et al. demonstrated that the classical and basal‐like subtypes, as defined by Moffitt et al. in 2015, remain the most reliable molecular classification for metastatic PDAC, with the basal‐like subtype exhibiting greater aggressiveness and reduced sensitivity to FOLFIRINOX treatment [9, 13, 54]. Notably, NR3C1 expression in the basal‐like subtype is nearly four times higher than in the classical subtype [13]. Consistent with this, our study demonstrates that high circulating NR3C1 methylation levels, which may be related to low NR3C1 expression in tumor, is associated with better outcomes with FOLFIRINOX‐based therapies. Collectively, these results suggest that circulating NR3C1 methylation may be subtype‐dependent and could be associated with different treatment outcomes in PDAC.
Recent studies have shown that AGRN‐driven epithelial‐mesenchymal transition (EMT) may constitute a molecular program responsible for aggressive and treatment‐refractory states in gastrointestinal cancers [55] and that the innovative nanodelivery of gemcitabine and deferasirox using M1 macrophage‐derived exosomes has demonstrated the ability to overcome chemotherapy resistance in pancreatic cancer [56]. Together with our findings, these studies support the need for reliable biomarkers capable of capturing resistance‐associated tumor states. In this context, circulating epigenetic markers, such as NR3C1 methylation, may provide a minimally invasive readout of underlying tumor biology and help support treatment stratification.
In summary, our study underscores the potential of circulating epigenetic biomarkers, specifically LAX1, RCAN3, and NR3C1 methylation levels, as promising tools for monitoring disease progression and predicting treatment response in metastatic PDAC. These biomarkers offer a minimally invasive approach to inform therapeutic decisions, with circulating NR3C1 methylation showing potential in predicting response to FOLFIRINOX‐based chemotherapy. Future studies are essential to elucidate the underlying mechanisms of these associations and to further refine the clinical application of these biomarkers in personalized PDAC management.
This study has certain limitations that should be considered. First, the genome‐wide methylation analysis was performed in a small discovery cohort, which increases the risk of both false‐positive and false‐negative results. However, the subsequent targeted validation by ddPCR in a larger sample set mitigates this concern and supports the robustness of the main findings. Besides, the imbalance in sample size between patients and controls may limit statistical power for specificity assessment and could influence false‐positive rates, so further studies with larger, more balanced cohorts are granted. Second, although the number of healthy controls was limited and the median age differed from that of patients, additional correlation and regression analyses demonstrated no significant association between age and methylation levels for any of the validated genes, suggesting minimal confounding by age. Third, subgroup analyses were limited by small patient numbers per treatment arm, making the predictive performance of NR3C1 preliminary and requiring validation in larger, independent, and prospective cohorts. On the other hand, future multicenter studies are warranted to confirm the reproducibility and clinical applicability of these biomarkers, including the methylation threshold determined for NR3C1, across diverse populations and analytical settings. Finally, inherent technical and standardization challenges associated with cfDNA methylation analysis and liquid biopsy—such as pre‐analytical variability, assay sensitivity, and inter‐platform comparability—remain important considerations for clinical translation.
Despite these limitations, the overall consistency of our findings across methods and datasets provides strong preliminary evidence supporting the biological significance and potential clinical relevance of the identified methylation markers, laying the groundwork for future multicenter prospective studies aimed at translating these biomarkers into clinical practice.
Conclusion
4
In this study, we demonstrated the prognostic value of LAX1, NR3C1, and RCAN3 methylation in patients with mPDAC, reinforcing the potential of liquid biopsy‐based epigenetic biomarkers in clinical practice to improve mPDAC management. Notably, we identified diagnostic NR3C1 methylation as a predictive biomarker for first‐line treatment response, supporting its utility in guiding clinical decision‐making. Future studies will aim to elucidate the role of NR3C1 methylation in FOLFIRINOX resistance, potentially revealing new therapeutic targets.
Methods
5
Patients and Samples
5.1
For this study, 69 patients were prospectively enrolled at the Reina Sofía University Hospital (HURS) in Córdoba (Spain), between May 2017 and September 2023. Eligibility criteria included adults (≥18 years) with histologically verified mPDAC, no history of chemotherapy or radiotherapy, and provision of written informed consent. The research adhered to the principles of the Declaration of Helsinki and obtained approval from the Córdoba Ethics Committee (Metilpancreas2 protocol, approved on November 29, 2022, Act 343, reference 5507). Table 1 provides a summary of the baseline characteristics of the patients enrolled in the study.
At diagnosis, blood samples were collected from 69 patients. During follow‐up, an additional 62 samples were obtained from 39 of these patients, aligned with CT‐based assessments of disease progression and continued until progression or death. In total, 131 patient samples were collected for analysis. The healthy cohort consisted of six women and five men, aged between 22 and 61 years, with a median age of 41 years.
Plasma was obtained by centrifuging blood samples at 1600 x g for 10 min at room temperature (RT) and removing any cellular debris by further centrifugation at 6000 x g for 10 min at RT. Plasma samples were aliquoted and cryopreserved at −80°C prior to analysis.
CA19‐9 levels (U/mL) were quantified in the hospital Clinical Laboratory using a standard radioimmunoassay.
Plasma cfDNA Isolation and cfDNA Fragmentation Analysis
5.2
cfDNA was purified from 3 mL of plasma using the QIAamp Circulating Nucleic Acid Kit in combination with the QIAvac 24 Plus vacuum system (Qiagen). The extracted cfDNA was quantified with a Quantus fluorometer (Promega), and the samples were stored at −80°C to maintain their integrity.
cfDNA fragmentation was assessed on the Agilent 2200 TapeStation system (Agilent) using the High Sensitivity D1000 ScreenTape Assay. cfDNA fragmentation was quantified as the fraction of short fragments compared with the total cfDNA content.
RAS MAF Assessment
5.3
Mutation analysis was performed either by the OncoBEAM RAS assay (Sysmex Inostics) or by the Plasma‐SeqSensei (PSS, Sysmex Inostics). Briefly, the OncoBEAM RAS Assay begins with a conventional PCR to amplify the target locus, which includes seven amplicons covering codons 12, 13, 59, 61, 117, and 146 and detects 34 mutations in the KRAS/NRAS genes. For each codon, a digital PCR was conducted, and the cfDNA was hybridized with fluorescent probes to measure mutant and wild‐type KRAS/NRAS molecules using flow cytometry. This method enables the accurate detection of mutant allele frequencies below 0.1 % in cfDNA [57]. Plasma‐SeqSensei is a next‐generation sequencing assay, which detects BRAF, KRAS, NRAS, and PIK3CA mutations in cfDNA [58]. The high sensitivity of this method relies in the labeling of DNA fragments with unique molecular identifiers (UIDs) during the first amplification step. Then, in the second amplification, each member of the same family of UIDs is identified with specific barcodes. Sequencing was performed on MiSeq (Illumina), and the Plasma SeqSensei software was used for data acquisition and analysis, reporting the proportion of mutated molecules relative to the total cfDNA (MAF).
Infinium MethylationEPIC BeadChip Array
5.4
The genome‐wide DNA methylation was quantified using the Infinium MethylationEPIC BeadChip Array via Diagenode S.A. (Belgium). This array interrogates 866,895 single‐nucleotide methylation sites, covering about 99% of annotated RefSeq genes.
This array encompasses 866,895 single‐nucleotide methylation sites and cover 99% of the annotated reference sequence (RefSeq) genes.
The discovery set included cfDNA samples from six mPDAC patients and two healthy individuals. Extracted cfDNA was measured with the Quantus fluorometer (Promega). A total of 25 ng was deaminated with the EZ‐96 DNA Methylation Kit (Zymo Research) according to Illumina's protocol. Bisulfite conversion efficiency was evaluated by qPCR, targeting a methylated region of DNAJC15 and the GNAS locus, which were used for quality control.
Comparative analysis of data was conducted using the Bioconductor R package Chip Analysis Methylation Pipeline (ChAMP) [59]. After normalization of the beta values with BMIQ [60], potential differentially methylated probes were identified using a Benjamini–Hochberg adjusted p‐value < 0.05, with no threshold applied to the methylation differences. The GRCh37/hg19 genome, obtained from the UCSC Genome Browser, was used as a reference.
cfDNA Sodium Bisulfite Conversion
5.5
A maximum of 25 µL of cfDNA sample was subjected to sodium bisulfite treatment using the EZ DNA Methylation‐Lightning kit (Zymo Research), following the manufacturer's protocol. Human HCT116 DKO methylated and unmethylated DNAs were used as control samples to assess cfDNA bisulfite conversion efficiency in each treatment intended for ddPCR.
ddPCR
5.6
Prior to ddPCR analysis, target sequences were subjected to a pre‐amplification step following established protocols [22]. Briefly, a 10 µL reaction mixture was prepared containing 1 µL of bisulfite converted cfDNA, 2 × ddPCR Supermix (without dUTP, Bio‐Rad) and 900 nM of each primer. PCR conditions were 95°C for 10 min, followed by 10 cycles of 94°C for 30 s and 58°C for 1 min and a final incubation at 98°C for 10 min. Finally, all pre‐amplified PCR products were diluted 1:10.
ddPCR was conducted using the QX200 system (Bio‐Rad). For each assay, 2 µL of the diluted pre‐amplification product was mixed with ddPCR Supermix, 900 nM of primers, and 250 nM of the corresponding probes (FAM or SUN fluorophore‐labelled (Integrated DNA Technologies, Inc.), in a final volume of 20 µL. To minimize background noise and enhance assay sensitivity, all probes were quenched using a 30 Iowa Black dark quencher (IABkFQ) and an internal ZEN quencher. When the positive droplets for methylated and unmethylated probes did not correctly separate from background, Affinity Plus probes were used. These probes enhance the discrimination of thermodynamically similar samples by incorporating up to six blocked nucleic acid monomers. The locked nucleic acids confer greater structural stability, which increases the hybridization melting temperature. The primer and probe sequences used are specified in Table S3. The ddPCR conditions were as follows: 95°C for 10 min, followed by 40 cycles of 94°C for 30 s, 58°C for 1 min, and a final step at 98°C for 10 min. The PCR products were analyzed using the QX200 droplet reader, which quantified the total number of droplets, and determined the counts of positive and negative droplets for each fluorophore. QuantaSoft Analysis Pro 1.0.596 program was employed to calculate the relative methylation abundance for each sample, defined as [number of methylated copies (FAM) / (number of methylated copies (FAM) + unmethylated copies (SUN))] * 100.
TCGA Database and Statistical Analysis
5.7
TCGA‐PAAD project data were analyzed using the SMART website (http://www.bioinfo‐zs.com/smartapp/) [61] to evaluate differential methylation levels in NR3C1 CpG island between normal and PDAC tissue samples, as well as to assess the correlation with gene expression.
SPSS Statistics version 26.0.0, GraphPad Prism 9.0 software and R version 4.4.2 were used for statistical analysis of the data. To account for potential age‐related effects on methylation between healthy and patient groups, a multiple linear regression model was applied for each validated target, including group and age as independent variables (methylation = group + age). The R2 Genomics Analysis and Visualization Platform (https://r2.amc.nl) was used to establish the cut‐off values of NR3C1, RCAN3, and LAX1 methylation levels, MAF, CA19‐9 levels, cfDNA concentration and cfDNA fragmentation. As R2 provides a data‐driven approach optimized for group separation but not explicitly designed for prognostic threshold definition, receiver operating characteristic (ROC) curve analyses were subsequently conducted to derive outcome‐oriented cut‐off values for OS and PFS. OS and progression‐free survival were defined as the time from diagnosis, based on tissue biopsy, to death from any cause or to the first CT‐progression, respectively. The statistical significance in the digital droplet PCR validation and the association analysis was determined using the non‐parametric Mann–Whitney test or the parametric unpaired t‐test. Correlations were assessed using the Pearson correlation coefficient. To control for multiple testing, p‐values from correlation analyses between circulating gene methylation levels and molecular biomarkers were adjusted separately for each gene using the Benjamini–Hochberg false discovery rate (FDR) method. Correlations with an adjusted q‐value ≤ 0.05 were considered statistically significant. Survival rates were estimated using Kaplan–Meier curves, and log‐rank test was employed to identify prognostic variables. Patient stratification for logistic simple regression and ROC curve analysis was based on response or non‐response to first‐line treatment. Statistical significance was defined as p < 0.05 for all analyses.
Author Contributions
P.C‐R., M.V.G‐O., A.R‐A., and E.A. conceived, designed, and supervised the study. M.T.C. and E.A. provided resources. P.C‐R., M.V.G‐O., M.T‐F., and E.C‐P. performed experiments and conducted data analysis. N.H‐C. was responsible for the bioinformatic analyses. E.A. and M.V.G‐O. acquired funding. P.C‐R., M.V.G‐O., and A.R‐A. wrote the manuscript. All authors reviewed and approved the final version of the manuscript.
Funding
This research was supported by grants to M.V.G‐O. and E.A. from Consejería de Universidad, Investigación e Innovación, Junta de Andalucía (ProyExcel_00734), Instituto de Salud Carlos III (PI25/00503) co‐funded by the European Union and a grant to M.V.G‐O. from Beca Carmen Delgado/Miguel Pérez‐Mateo 2024. M.V.G‐O. and A.R‐A. are funded with a researcher contract through the Program “Nicolás Monardes” from Junta de Andalucía.
Conflicts of Interest
The authors declare no conflicts of interest.
Ethics Statement
The research followed the ethical principles outlined in the World Medical Association Declaration of Helsinki and received approval from the Ethics Committee of Córdoba. (Metilpancreas2 protocol, approved on November 29, 2022, Act 343, reference 5507).
Supporting information
Figure S1: Comparative analysis of CpG methylation levels of KIAA1949 gene in plasma samples from healthy individuals and mPDAC patients. Figure S2: Residuals versus fitted values plots from multiple linear regression analyses evaluating the potential confounding effect of age on methylation levels for LAX1, RCAN3, and NR3C1 genes (model: methylation = group + age). Residuals were randomly distributed around zero, indicating no systematic bias and supporting that age does not significantly influence the observed group differences. Fitted values (X‐axis): predicted methylation levels estimated by the linear model (adjusted for group and age). Residuals (Y‐axis): the difference between the observed and predicted methylation values. p‐values correspond to the regression coefficient for age, indicating the lack of a significant association between age and methylation levels (p > 0.05). Figure S3: Correlation between basal circulating LAX1, RCAN3, and NR3C1 methylation levels with other circulating tumor biomarkers in mPDAC. LAX1, RCAN3, and NR3C1 methylation levels in plasma at diagnosis according to CA19‐9 levels, cfDNA concentration, cfDNA fragmentation and RAS MAF. Pearson's correlation p‐values and Benjamini–Hochberg false discovery rate (FDR)‐adjusted q‐values are shown. Figure S4: (A) cfDNA concentration and (B) cfDNA fragmentation in healthy individuals, compared with metastatic (stage IV) pancreatic cancer patients. Figure S5: Kaplan–Meier survival analyses of mPDAC patients stratified according to ROC curve‐derived cut‐off values for LAX1, RCAN3, and NR3C1 methylation markers. Overall survival (OS) and progression‐free survival (PFS) were compared between high‐ and low‐methylation groups using the log‐rank test. Results are consistent with those obtained using R2‐defined cut‐off values. Figure S6: Correlation between early changes of circulating biomarkers and progression‐free survival. Graphs show the slope from diagnosis to first follow‐up after treatment initiation of LAX1 methylation, RCAN3 methylation, NR3C1 methylation, CA19‐9 levels, RAS MAF, cfDNA concentration and cfDNA fragmentation. Figure S7: Aberrant methylation of the NR3C1 promoter contributes to its transcriptional downregulation in PDAC. (A) Average methylation of 17 CpGs sites within the proximal promoter CpG island in normal tissue and PDAC tumor tissue samples. (B) Pearson correlation coefficient for each CpG position. (C) Correlation between global proximal promoter CpG island methylation and NR3C1 mRNA levels. All data were from TCGA database. Table S1: Methylation levels of 9 CpG positions (adjusted p‐value ≤ 0.05; Δβ ≥ 0.20) with negative and positive controls of methylation. ± SD indicate Poisson's error (95% CI). Table S2: Multivariable Cox regression analysis for OS and progression‐free survival according to basal circulating biomarkers in mPDAC patients. Table S3: Primers and probes for methylation analysis of different genes in cfDNA.
The reference list from the paper itself. Each links out to its DOI / PubMed record.
- 1H. Wei and H. Ren , “Precision Treatment of Pancreatic Ductal Adenocarcinoma,” Cancer Letters 585 (2024): 216636.38278471 10.1016/j.canlet.2024.216636 · doi ↗ · pubmed ↗
- 2C. Bosetti , V. Rosato , D. Li , et al., “Diabetes, Antidiabetic Medications, and Pancreatic Cancer Risk: An Analysis From the International Pancreatic Cancer Case‐Control Consortium,” Annals of Oncology 25, no. 10 (2014): 2065–2072.25057164 10.1093/annonc/mdu 276PMC 4176453 · doi ↗ · pubmed ↗
- 3J. D. Mizrahi , R. Surana , J. W. Valle , and R. T. Shroff , “Pancreatic Cancer,” Lancet 395, no. 10242 (2020): 2008–2020.32593337 10.1016/S 0140-6736(20)30974-0 · doi ↗ · pubmed ↗
- 4W. Park , A. Chawla , and E. M. O'Reilly , “Pancreatic Cancer: A Review,” Jama 326, no. 9 (2021): 851–862.34547082 10.1001/jama.2021.13027 PMC 9363152 · doi ↗ · pubmed ↗
- 5J. X. Hu , C. F. Zhao , W. B. Chen , et al., “Pancreatic Cancer: A Review of Epidemiology, Trend, and Risk Factors,” World Journal of Gastroenterology 27, no. 27 (2021): 4298–4321.34366606 10.3748/wjg.v 27.i 27.4298 PMC 8316912 · doi ↗ · pubmed ↗
- 6I. Garajová , M. Peroni , F. Gelsomino , and F. Leonardi , “A Simple Overview of Pancreatic Cancer Treatment for Clinical Oncologists,” Current Oncology 30, no. 11 (2023): 9587–9601.37999114 10.3390/curroncol 30110694 PMC 10669959 · doi ↗ · pubmed ↗
- 7X. Y. He and Y. Z. Yuan , “Advances in Pancreatic Cancer Research: Moving Towards Early Detection,” World Journal of Gastroenterology 20, no. 32 (2014): 11241–11248.25170208 10.3748/wjg.v 20.i 32.11241 PMC 4145762 · doi ↗ · pubmed ↗
- 8A. Carrato , A. Falcone , M. Ducreux , et al., “A Systematic Review of the Burden of Pancreatic Cancer in Europe: Real‐World Impact on Survival, Quality of Life and Costs,” Journal of Gastrointestinal Cancer 46, no. 3 (2015): 201–211.25972062 10.1007/s 12029-015-9724-1PMC 4519613 · doi ↗ · pubmed ↗