Reduced vascular leakage correlates with breast carcinoma T regulatory cell infiltration but not with metastatic propensity
Liqun He, Chiara Testini, Neda Hekmati, Altea Bonello, Aglaia Schiza, Emmanuel Nwadozi, Mia Phillipson, Carina Strell, Michael Welsh

TL;DR
Reduced vascular leakage in breast cancer is linked to immune suppression and larger tumors but not increased metastasis.
Contribution
A mouse model and human cohort study reveal how vascular normalization affects immune cell infiltration and tumor progression.
Findings
Low vascular leakage correlates with increased regulatory T cell infiltration in human breast tumors.
Vascular normalization reduces tumor metastasis and alters immune checkpoint gene expression in immune cells.
Reduced vascular leakage is not associated with increased metastatic potential in breast cancer.
Abstract
The vasculature and the immune system both play roles in breast cancer progression and metastasis. In an experimental mouse model of Shb‐gene deficiency in endothelial cells, breast cancer lung metastasis correlated with immune suppression rather than with vascular leakage. The present study aimed to assess underlying gene expression changes in endothelial and immune cells responsible for this phenotype and to explore their relationship to human disease. Mouse endothelial cell Shb‐gene deficiency, leading to ‘vessel normalization’, resulted in altered expression of chemo/cytokine genes and upregulation of immune checkpoint genes in immune cells. Endothelial cells under these conditions exhibited gene expression patterns compatible with reduced angiogenesis and vascular leakage. Additionally, genes whose products relate to immune cell vascular transmigration and function were affected.…
Genes, proteins, chemicals, diseases, species, mutations and cell lines named across the full text — each resolved to its canonical identifier and authoritative record.
Click any figure to enlarge with its caption.
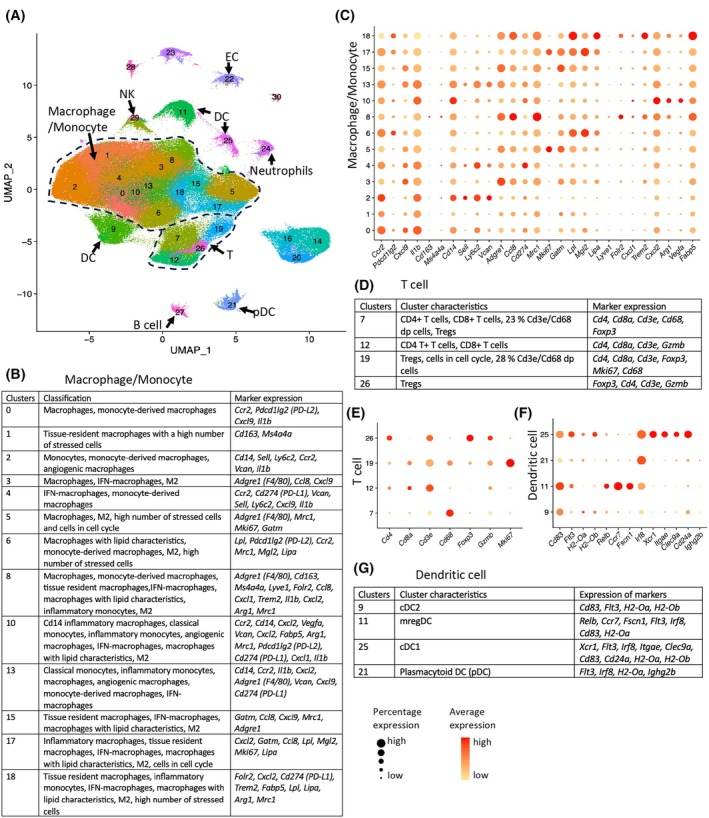 Fig. 1
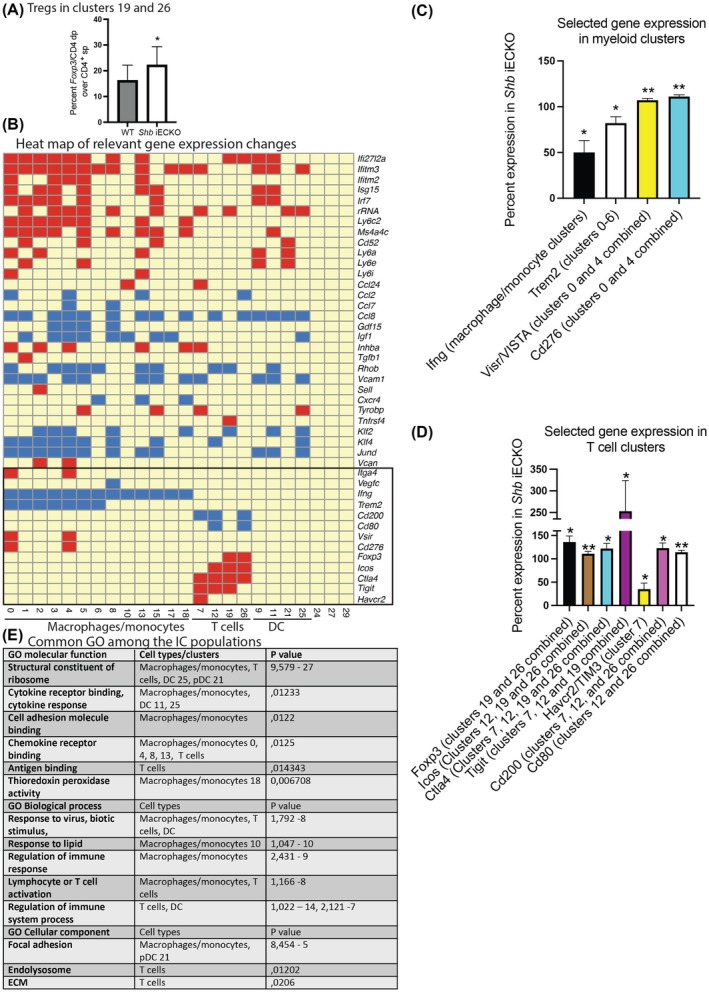 Fig. 2
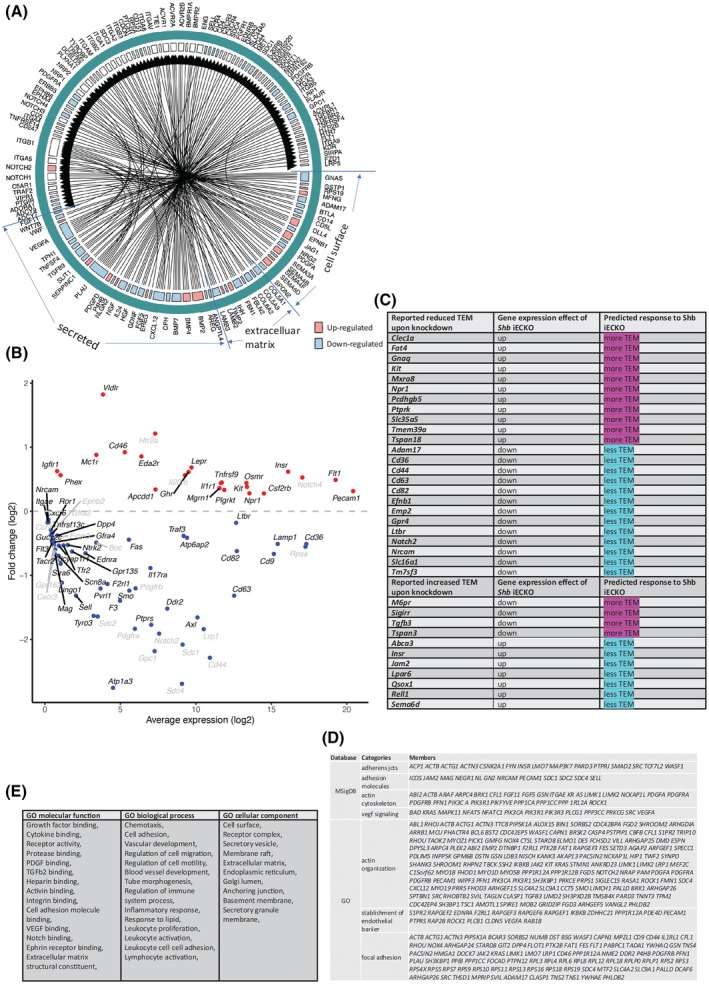 Fig. 3
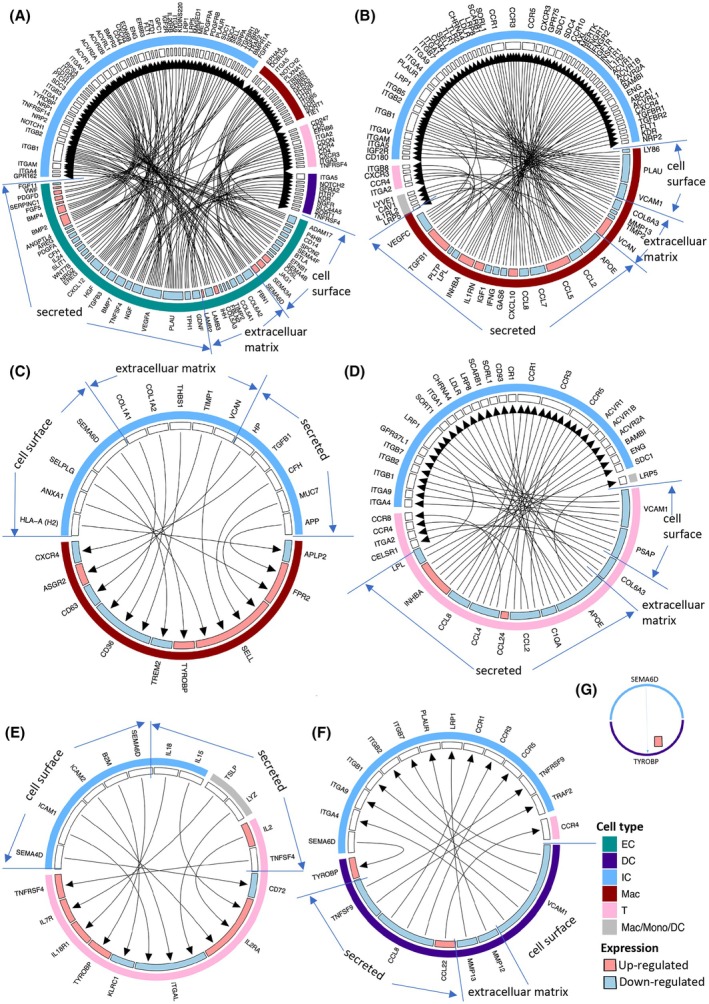 Fig. 4
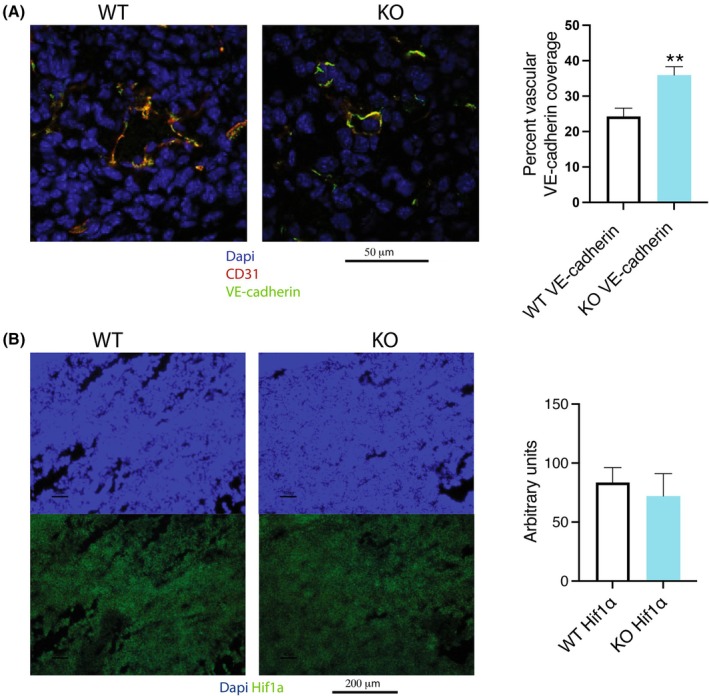 Fig. 5
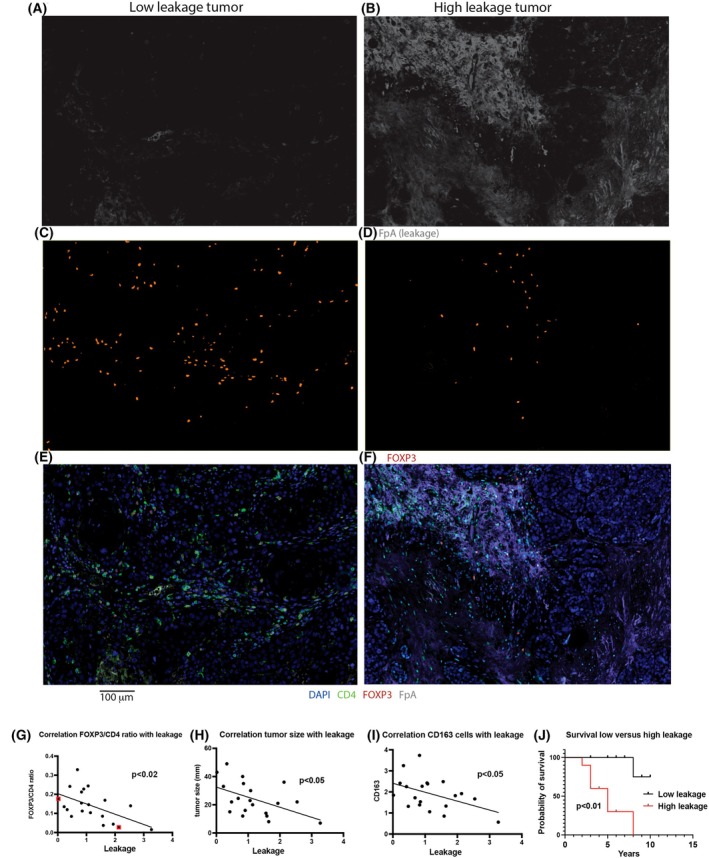 Fig. 6
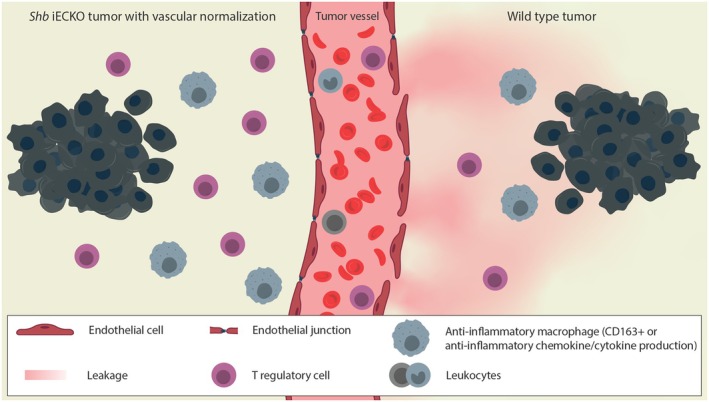 Fig. 7
| Endothelial DEGs by total RNAseq | Changes in response to | Predicted outcome |
|---|---|---|
|
| Increased expression | Reduced sprouting angiogenes [ |
|
| Increased expression | Increased angiogenesis [ |
|
| Decreased expression | Reduced angiogenesis [ |
|
| Increased expression | Reduced leakage [ |
|
| Decreased expression | Reduced leakage [ |
|
| Increased expression | Increased leakage [ |
|
| Increased expression | Increased IC TEM [ |
|
| Decreased expression | Decreased IC TEM or recruitment [ |
|
| Increased expression | Decreased IC TEM [ |
|
| Increased expression | Reduced T cell activation [ |
|
| Increased expression | Increased monocyte TEM [ |
|
| Increased expression | Increased |
|
| Increased expression | Increased platelet and monocyte adhesion [ |
|
| Increased expression | Increased Th1, Th2 and Treg differentiation, increased MDSC infiltration and M1 polarization [ |
|
| Decreased expression | Reduced Treg and Teff TEM [ |
|
| Decreased expression | Reduced lymphocyte TEM [ |
|
| Decreased expression | Reduced IC capture [ |
|
| Decreased expression | Reduced IC TEM [ |
|
| Decreased expression | Reduced antigen presentation [ |
|
| Decreased expression | Decreased immune checkpoint interaction by competition with Ctla4 [ |
|
| Decreased expression | Less IC adhesion and TEM [ |
|
| Increased expression | Increased antigen presentation, increased Treg transmigration, EC‐EC interaction [ |
|
| Decreased expression | Increased Treg infiltration [ |
|
| Decreased expression | Reduced inflammation and immunosuppression [ |
|
| Increased expression | Pleiotropic effects, increased PI3'‐kinase activity |
| Tumor | FpA | VE‐cadherin | CD4 | FOXP3/CD4 | CTLA4 | GZMB/CD8 | PD1/CD8 | CD8 | PD‐L1 | CD20 | CD163 | Metastasis |
|---|---|---|---|---|---|---|---|---|---|---|---|---|
| 3 | + | + | − | + | − | + | + | − | − | + | − | − |
| 4 | − | − | − | + | − | + | + | − | + | − | + | − |
| 6 | − | − | − | + | + | − | − | − | − | − | − | − |
| 7 | − | − | − | + | − | + | + | − | − | − | − | − |
| 8 | − | + | − | − | − | − | − | − | − | − | − | − |
| 9 | − | + | + | + | + | − | + | + | + | + | + | − |
| 11 | − | − | + | + | + | − | + | + | + | + | + | − |
| 14 | + | + | + | − | − | − | − | + | − | + | + | − |
| 15 | − | − | − | − | − | − | − | − | − | + | − | − |
| 18 | + | + | + | + | + | + | − | + | + | + | + | − |
| 1 | + | − | − | − | − | − | + | − | − | − | − | + |
| 2 | + | − | − | − | − | + | + | − | − | − | − | + |
| 5 | + | + | + | − | + | + | − | + | + | − | + | + |
| 10 | + | + | − | − | − | − | − | − | − | − | − | + |
| 12 | + | + | + | + | + | − | + | − | + | + | − | + |
| 13 | − | − | + | − | + | + | + | + | + | + | + | + |
| 16 | + | − | − | − | − | + | − | + | − | + | − | + |
| 17 | − | + | + | + | + | − | − | + | + | − | + | + |
| 19 | − | − | + | − | + | + | − | + | + | − | + | + |
| 20 | + | + | + | + | + | + | + | + | + | + | + | + |
- —Exodiab
- —Trond Mohn Stiftelse10.13039/100016190
- —Cancerfonden10.13039/501100002794
- —Vetenskapsrådet10.13039/501100004359
- —Knut och Alice Wallenbergs Stiftelse10.13039/501100004063
Peer Reviews
No public reviews on file for this paper yet. If you reviewed it on a platform where reviews are public (OpenReview, ICLR, NeurIPS, ICML), you can paste yours below so the community can read it here.
Videos
No videos yet. Explain this paper in a talk, walkthrough, or lecture? Add one.
Taxonomy
TopicsAngiogenesis and VEGF in Cancer · Immune cells in cancer · Single-cell and spatial transcriptomics
Introduction
1
Cancer is a debilitating disease, with tumor metastasis being the most common cause of death. Tumor expansion and metastasis are complicated processes that are highly individual to each tumor, involving an interplay between the tumor cells and the stroma [1]. Tumor cells commonly evade novel antigen recognition and consecutive targeting by the adaptive immune system. This can be achieved by inducing reduced antigen presentation by antigen‐presenting cells [2], suppression of CD4^+^ T helper cells [3] or suppression of CD8^+^ T killer cells [4] due to immune‐suppressing cells such as T regulatory cells (Tregs) [5]. Additionally, innate immunity may be tamed in a pro‐tumoral manner by recruitment of myeloid‐derived suppressor cells (MDSC) [6] or tumor‐associated macrophages [7] that exhibit tissue‐restorative macrophage‐2 characteristics [2, 8]. Moreover, the tumor vasculature develops angiogenic features, primarily driven by the increased production of vascular endothelial growth factor‐A (VEGFA) [9], to supply oxygen and nutrients. However, as a result, the tumor vasculature is commonly dysfunctional and leaky [10, 11, 12], and these characteristics play a role in tumor cell intravasation, hematogenic dissemination, and metastasis [13]. The vasculature also is a portal for immune cell extravasation to infiltrate the tumor, and for this reason, it can be expected that the vasculature plays a role in regulating the tumor's immune response [14].
There have been astounding recent developments in cancer treatment, including treatment with inhibitors of amplified tumoral signaling pathways, antiangiogenic treatment, and inhibition of immune checkpoint proteins [15]. Most successful has been immune checkpoint inhibition targeting the CTLA4 gene product, PD‐L1 (CD274), and PD1 (PDCD1), resulting in the cure of a number of cancers [16]. Despite this success, many cancers remain refractory to immune checkpoint inhibition, and thus the treatment repertoire needs to be expanded [17]. Further candidates under investigation are PD‐L2 (PDCD1LG2), ICOS, TIM3, TREM2, CD276, VISTA, and TIGIT [18]. Concerning angiogenesis inhibition, most treatments only have transient, if any, effects at all [19]. This can be partially explained by ‘vascular normalization’ [12], the process in which the vasculature becomes less leaky with a lower vascular density but with increased functionality, thus not changing tumor oxygenation, or by resistance to angiogenic inhibition. Vascular normalization is a rapid process upon efficient antiangiogenic treatment and is apparent within one week [20].
In addition to supplying oxygen and nutrients, the vasculature also governs the tumor's infiltration of leukocytes by immune cell extravasation, which is a complex process requiring endothelial cell (EC)–immune cell (IC) cell surface receptor interactions, local chemokine/cytokine production, and regulation of EC adherens and tight junctions [21, 22]. It is thus clear that ECs play an important role in this context, although there is currently no simple understanding of possible mechanisms by which ECs may operate as ‘gate‐keepers’ to selectively permit or restrict infiltration of specific ICs and thus exert control of tumor immunity [14]. However, EC junctions play a role in this context, and VEGFA is a major regulator of adherens junction disassembly [11], which is followed by vascular leakage.
Tregs are important players with respect to anticancer immunity. Although their extravasation and tumor infiltration follow the general mechanisms of leukocyte transendothelial migration (TEM) as briefly described above, a certain degree of specificity with respect to leukocyte extravasation has been observed [14] although it is unclear to what extent such described specificity applies to Treg TEM. However, the local cytokine/chemokine environment is also important for Treg recruitment [23, 24], as is the local expression of immune checkpoint proteins [25]. Particularly, stimulation of the Ccr5 chemokine receptor gene product appears important for Treg homing [26].
The SHB (Src homology 2 domain protein B) adapter protein is an important regulator of VEGFA‐induced angiogenesis and vascular leakage [27, 28]. Our recent study demonstrated that E0771.lmb breast carcinomas grown in mice with Shb conditionally deleted in ECs (Shb iECKO) exhibited reduced tumor vascular leakage while lung metastasis was simultaneously increased [29]. This paradox was attributed to selective infiltration of immune suppressive ICs into tumors as a consequence of the Shb‐deficient EC phenotype, demonstrating that ECs indeed exert selective control of the tumor's immune response.
Breast cancer exhibits the unusual trait of tumor recurrence at late time points after successful removal of the primary tumor. Additionally, the response of breast cancer to immune checkpoint protein blockade and angiogenesis inhibition is generally limited, although triple negative breast cancer may, under certain conditions, benefit from complementary immunotherapy treatment [30].
The present study was conducted in order to obtain a molecular explanation for the underlying mechanism(s) governing selective infiltration of immune‐suppressive ICs as a consequence of vascular normalization, with particular focus on breast cancer. For this purpose, mouse tumor ICs and ECs from Shb iECKO mice were subjected to RNAseq analysis. In addition, surgical specimens of human triple negative breast cancer were stained for IC, EC, and leakage markers. The data suggest reduced vascular leakage, without concomitant alterations of hypoxia, as an explanation for increased tumor immune suppression resulting from altered EC function. Metastasis in human disease, however, appears predominantly dependent on increased vascular leakage.
Materials and methods
2
Mouse experiments
2.1
Animal experimentation was approved by the animal ethics committee at Uppsala County Court (5.8.18‐05732_2022). Up to five mice were housed in cages of 501 cm^2^ at 24 °C at 40–60% humidity with free access to water and standard chow at the animal department at the Biomedical Centre at Uppsala University. Female mice at 10–16 weeks of age were used for the experiments. E0771.lmb tumors (RRID:CVCL_BOA2) were grown orthotopically in the forth mammary fat pad after tamoxifen injection (to induce Shb floxing) as previously described in wild‐type and Shb iECKO (Shb flox/flox; Cdh5‐CreERt2) mice [29], alternatively in Shb ICKO (Shb flox/flox; Vav1‐cre) mice. The conditional Shbflox (Shbtm1a(EUCOMM)Hmgu) mouse on the C57Bl/6 strain was generated by the Intrafrontier I3 mouse project at the Biocenter Transgenic Core Facility, University of Oulu, Oulu, Finland. The Cdh5‐CreERT2 transgenic mouse was kindly provided by Dr Ralf Adams, Max Planck Institute for Molecular Biomedicine, Münster, Germany. The Vav1‐cre mouse was kindly provided by Dr Maria Ulvmar, Uppsala University.
Mice were sacrificed on day 14–16 after tumor cell injection. The tumors were digested, CD45^+^‐cells isolated by MACS™ microbeads (Miltenyi, Bergich Gladbach, Germany) [29] and subsequently CD31^+^‐cells isolated by fluorescence‐activated cell sorting (FACS) [31] after staining for CD31. The average wild‐type tumor weight was 0.13 ± 0.03 mg and the corresponding Shb iECKO value was 0.11 ± 0.03 mg at sacrifice. The average number of CD45^+^ cells isolated from the wild‐type tumors was 2.4 ± 0.4 × 10^6^ whereas 2.6 ± 0.8 × 10^6^ cells were isolated from the Shb iECKO tumors.
RNAseq
2.2
Sequencing libraries were prepared from 10 000 cells after recovery using the Chromium Next GEM Single Cell 3′ Reagent kit v3.1 with dual index (cat# 1000268/269/120/127/1000215, 10× Genomics) according to the manufacturer's protocol (User guide CG000315, Chromium Next GEM Single Cell 3′ Reagent Kits v3.1 (Dual Index), 10× Genomics). The libraries were sequenced with the NovaSeq 6000 system (Paired‐end 150 bp read length, S4 flowcell, and v1.5 sequencing chemistry).
The raw sequence data were processed using cell ranger software (version: 4.0.0; 10x Genomics Inc., Pleasanton, CA, USA). The reads were aligned to mouse genome mm10 and gene counts matrix was summarized for each sample. The raw gene counts data were then loaded into r seurat package (version: 4.3.0; Satija Lab, New York Genome Center, New York, NY, USA) for quality control and downstream analysis and visualization. The cells which have less than 500 detected genes or have mitochondrial genes greater than 10% were filtered out. For the remaining cells, a scale factor of 10 000 was used to normalize the raw gene expression counts. To correct for the batch effect among different samples, the CCA method with default settings in the seurat package was applied to integrate all the samples. The top 2000 variable genes in the data were obtained using the vst method and the first 30 principal components were used for the shared nearest neighbor clustering analysis and Uniform Manifold Approximation and Projection (UMAP) visualization. For clustering the cells, the FindClusters function was used (with resolution r = 1). The genes enriched in each cluster were then subsequently identified using FindAllMarkers function. It first applies a Wilcoxon Rank Sum test for differential expression and then performs multiple test correction using Bonferroni correction method. The multiple test corrected P value < 0.05 was used as cutoff to identify significant differentially expressed genes.
Since the cluster cell numbers differed between the different experiments, only effects that were consistently observed in the three experiments were included. Furthermore, since the Cdh5‐creERt2 transgene used for conditionally deleting Shb in EC may also conditionally delete Shb in certain populations of ICs [31], effects on gene expression observed with Vav1‐cre floxing of Shb (Shb ICKO) were also excluded.
To visualize markers in different clusters, the DotPlot function in seurat package and also pheatmap package (version: 1.0.12) were applied. To show the detailed gene expression difference between groups, the r ggplot2 package (version: 3.5.1) was used to generate the volcano plot. To illustrate the interactions between different cell types, the r ccplotr package (version: 0.99.3) was utilized to produce the circular cell–cell interaction networks by employing literature‐assembled ligand–receptor pairs [32]. The Cdh5‐creERt2/Shb ^ flox/flox ^ data (iECKO) can be found at https://heomics.shinyapps.io/MW_Cdh5‐creERt2_Shbflox and the Vav‐cre/Shb ^flox/flox^ data at https://heomics.shinyapps.io/MW_Vav‐cre_Shbflox/.
Total (bulk) EC RNA was isolated using the RNeasy mini‐kit (Qiagen, Hilden, Germany) from CD31^+^ cells previously depleted of CD45^+^ cells and subjected to bulk RNAseq using NovaSeq6000 or NovaSeq X Plus Sequencing. Libraries were prepared from 30 ng total RNA using the Illumina Stranded Total RNA library preparation kit with Ribo‐Zero Plus treatment (cat# 20040525/20040529, Illumina Inc., San Diego, CA, USA). Unique dual indexes (cat# 20040553/20040554, Illumina Inc.) were used. The library preparation was performed according to the manufacturer's protocol (#1000000124514). Paired‐end 150 bp read length were sequenced. The RNAseq data were analyzed with the nf‐core/rnaseq bioinformatics pipeline. Sequencing was done in 4 separate experiments with 2–5 samples per genotype in each experiment including samples that were resequenced (total 11 WT samples from 9 tumors and 10 KO samples from 8 tumors). Average expression for each gene per experiment and genotype were calculated and compared by paired Student's t‐test.
Sequencing was performed by the SNP&SEQ Technology Platform in Uppsala. The facility is part of the National Genomics Infrastructure (NGI) Sweden and Science for Life Laboratory. The SNP&SEQ Platform is also supported by the Swedish Research Council and the Knut and Alice Wallenberg Foundation.
Human breast cancer cohort
2.3
A cohort of human triple negative breast cancer (TNBC) patients diagnosed between 2014 and 2022 at Uppsala Akademiska University Hospital was employed to study the expression of IC and vascular markers in 20 tumors. The study was conducted in accordance with the Declaration of Helsinki. Breast tumor tissue samples were identified, collected, and analyzed as approved by the Swedish Ethical Review Authority (permit number Dnr2022‐00478‐01 with amendment Dnr2022‐06689‐02 including informed consent for each patient via U‐CAN/Dnr2010/198/3). We selected TNBC due to its complex metastasis and immune evasion mechanisms, making it an ideal model to study the role of vascular leakage and immune cell infiltration in tumor progression. Additionally, TNBC is one of the few subtypes that may respond to immunotherapy and VEGF inhibitors, providing an opportunity to explore how these factors influence treatment outcomes. We selected 10 cases with metastatic recurrence and 10 without recurrence to facilitate a more balanced comparison of tumor behavior. The tumors were selected in a manner to minimize differences between the groups with respect to age, tumor size, and lymph node status. The treatment schemes differ between patients with or without lymph node involvement and metastasis, and therefore these are potentially confounding factors. This we had no means of influencing since the treatment regimens were based on the medical history. This approach enables us to explore how factors like vascular leakage and immune cell infiltration differ between patients who experience relapse and those who remain disease‐free, offering valuable insights into the mechanisms driving disease progression and recurrence.
Multiplex immunofluorescence
2.4
The multiplex staining was performed with the BOND RX autostainer (Leica Biosystems). Paraffin‐embedded sections (4 μm) were deparaffinized with Dewax solution (Leica Bond #AR9222, Leica Biosystems, Nussloch, Germany) followed by first antigen retrieval using Epitope retrieval solution 2 (Leica Bond ER2, #AR9640) at the final temperature of 95 °C and for a total of 30 min. Staining started by performing six subsequent staining cycles following the antibody orders for panel 1 and 2 respectively: VE‐cadherin, PD‐L1, Fibrinopeptide A, CD4, FoxP3, CTLA4 and PD‐L1, PD‐1, Granzyme B, CD163, CD20, CD8. Details of antibodies are provided in Table S8. Each staining cycle was followed by 5 min blocking with Protein Block Serum‐Free ready to use (DAKO #X0909). Primary antibody was added and incubated for 30 min followed by 10 min incubation with secondary antibody either ImmPress‐mouse HRP, MP‐7402, or ImmPress‐rabbit HRP, MP‐7401 (Vector Laboratories, Newark, CA, USA). At the end of a 10‐min incubation with tyramide signal amplification by using opal dyes in the following order for panel 1 and 2 respectively: 690, 570, 520, 480, 620, TSA‐DIG/780 and 690, 620, 520, 570, 480 and TSA‐DIG/780 (all Akoya Biosciences). All opal dyes were diluted at 1 : 300 in 1× Automation Amplification Diluent (Akoya Biosciences #FP1609, Marlborough, MA, USA). Each cycle was completed with antigen retrieval by using Epitope retrieval solution 1 (Leica Bond ER1, #AR9961) for 20 min at 95 °C. All slides were counterstained with DAPI for nuclear staining for 5 min (Akoya Biosciences, #FP1490) and followed by mounting with ProLong Diamond Antifade media (Thermo Fisher Scientific, #P36970, Waltham, MA, USA). All staining steps were performed at room temperature and Wash solution (Leica Bond, #AR9590) was used for washing steps.
Stained sections were scanned and spectrally unmixed by using Vectrapolaris© system and phenoimager‐ht‐2 software. Cell detection was performed on Qupath with a set intensity threshold of 100, a background radius of 8 μm, a sigma factor of 1.5, and cell expansion of 5 μm. Based on visual inspection, these settings accurately detected cells consistently across all images. Cell numbers were determined per tumor unit area in arbitrary units. Fibrinogen peptide A (FpA) staining was determined as a positive percentage area per tumor area.
Statistics
2.5
prism 10 was used for statistical comparisons between groups of data using Student's t‐test (paired or unpaired whenever appropriate) or correlation analysis. Paired t‐tests were considered appropriate when conditions of the two experimental groups in a separate experiment were identical, that is, same tumor and RNAseq experiment. Correction was done for multiple comparisons for scRNAseq data except for selected gene expression (15 genes) in which TPM per cluster (as indicated) and sample were compared between wild type and knockout. Bulk RNAseq and correlation analyses were not corrected for multiple comparisons. The uncorrected data were used to prioritize gene expression pattern changes or possible correlation patterns.
Results
3
IC single‐cell RNAseq (scRNAseq)
3.1
To evaluate the specifics of the immune‐suppressive phenotype in the Shb iECKO E0771.lmb experimental breast cancer model, in which previously increased lung metastasis accompanied by increased tumor immune suppression and reduced leakage was demonstrated [29], scRNAseq on CD45^+^ cells was conducted in three separate experiments with tumor samples from two wild‐type and two Shb iECKO mice in each experiment (total of six separate tumor samples for each genotype). A total of 238 188 cells were sequenced (119 530 wild‐type cells and 118 658 Shb iECKO cells). seurat clustering identified 30 separate clusters. Clusters 0–6, 8, 10, 13, 15, 17, and 18 consisted of primarily macrophage/monocyte populations (163 864 cells combined), clusters 7, 12, 19, and 26 consisting of T cells (25 374 cells combined), 9, 11, 25 dendritic cells (DCs) (17 827 cells combined) [3, 33], 21 of plasmacytoid dendritic cells (pDC) (3188 cells) [33], 24 of neutrophils (2353 cells), 27 of B cells (1504 cells), and 29 of natural killer (NK) cells (696 cells) [3] (Fig. 1A for Umap1 vs. Umap2 depiction, Table S1 for cell number percentages). Clusters 14, 16, 20, and 23 appeared primarily to express fibroblast markers, 22 endothelial markers, 28 mural cell markers, and cluster 30 epithelial markers, and consequently, these were not analyzed further unlike the macrophage/monocyte, T cell, and DC clusters that were subjected to more detailed analysis.
Breast cancer IC cluster characterization by markers. (A) UMAP1/UMAP2 plot depicting cluster separation. Clusters 14, 16, 20, and 23 are probably fibroblasts, 28 mural cells, and 30 epithelial cells. (B) Macrophage/monocyte clusters, their classification, and markers motivating the classification. (C) Relative expression of myeloid markers in the macrophage/monocyte clusters. (D) T cell clusters, cluster characteristics, and their markers. (E) Relative expression of the T cell markers. (F) Relative expression of the dendritic (DC) markers. (G) DC clusters, cluster characteristics, and markers. EC, endothelial cells; IC, immune cells; iECKO, conditional deletion of Shb in EC; IFN, interferon; M2, macrophage type 2; NK, natural killer cells; Treg, T regulatory cells; UMAP, uniform manifold approximation and projection. N = 6 each genotype.
Characterization of the macrophage/monocyte clusters (Fig. 1B,C) was inspired by a recent publication [34], describing tumor macrophage/monocyte cell characteristics according to specific markers defined in that study and in addition employing the macrophage 2 markers Arg1, Mrc1, and Mgl2 (Fig. S1, Table S2). Expression of the macrophage 2 genes Arg1, Mrc1, and Mgl2 was noted in clusters 3, 5, 6, 8, 10, 15, 17, and 18, although no distinct macrophage 2 profiles correlated with the Shb iECKO genotype. In addition, clusters with cells active in the cell cycle (Mki67) and/or stressed cells (clusters with more than 10 percent of the cells expressing more than 7.5% transcripts from mitochondrial DNA) were also taken into account. Clusters 5 and 17 contained cells active in the cell cycle, and clusters 1, 5, 6, and 18 contained a large proportion of stressed cells. It is apparent that the macrophage/monocyte clusters were pleiotropic with respect to the selected markers. Whereas clusters 2 and 13 seem to be the clusters mostly enriched for monocytes, these also expressed macrophage characteristics. The relative cell numbers were increased for cluster 4 and decreased for clusters 17 and 25 in response to the Shb iECKO genotype (Table S1). Clusters 8 and 10 contained macrophages with IFN (interferon) and lipid metabolism properties. The presence of macrophages with ‘IFN‐properties’ is a common feature in tumors, and thus, these cells are likely to have some tumor supportive features. Lipid macrophages are associated with poor prognosis, making these also populations of interest [34]. Cluster 4 showed an IFN profile and was the cluster with the highest expression of the immune checkpoint protein PD‐L1 gene (Cd274). This is relevant since the cell numbers of this cluster were increased as a consequence of the knockout genotype. Other clusters displaying lipid or IFN profiles were 3, 6, 13, 15, 17, and 18.
Cd4 was expressed in all four T cell clusters (7, 12, 19, and 26) whereas Cd8a was relatively sparsely expressed in cluster 26 (Fig. 1D,E and Fig. S2). Of these, cluster 19 contained many cells active in the cell cycle. Clusters 7 and 19 were rich in Cd3e/Cd68 double‐positive (dp) cells (23% cluster 7 and 28% cluster 19, Fig. S2) although the average Cd68 expression in these clusters was lower than in most macrophage clusters (Fig. S1). Upon activation, CD4^+^ and CD8^+^ T cells have been described to express macrophage markers [35, 36]. Clusters 19 and 26 contained Tregs by virtue of their expression of Foxp3. The percentages of Foxp3 ^+^/Cd4 ^+^ double‐positive cells of total Cd4 ^+^ cells were 16 ± 6 in the wild‐type populations and 22 ± 7 in the Shb iECKO populations (P < 0.05 paired Student's t‐test for the three separate tumor experiments, Fig. 2A) suggesting immune‐suppressive conditions as a consequence of endothelial Shb deficiency.
*Differentially expressed genes (DEGs) in breast IC upon Shb iECKO. (A) Percentage Foxp3/Cd4 double‐positive cells among CD4+ cells in clusters 19 and 26. Indicates P < 0.05 by pairwise comparison using a paired Students' t‐test in the three separate experiments based on six samples each genotype. Means ± SEM are given. (B) Heat map of certain significant gene expression changes in different clusters by a Wilcoxon Rank Sum test for differential expression and then multiple test correction using the Bonferroni correction method. The multiple test corrected P value < 0.05 was used as cutoff to identify significant differentially expressed genes. Boxed area displays genes with significant changes calculated on average expression in one or multiple clusters combined. Red, increased expression and blue, decreased expression. (C) Shb iECKO expression (percent of wild‐type control) of selected genes in myeloid clusters. * and ** indicate P < 0.05 and P < 0.01, respectively, when TPM data were pairwise compared by a paired Students' t‐test based on six samples for each genotype performed at three separate occasions. Means ± SEM are given. (D) Shb iECKO expression (percent of wild‐type control) of selected genes in T cell clusters. * and ** indicate P < 0.05 and P < 0.01, respectively, when TPM data were pairwise compared by a paired Students' t‐test based on six samples for each genotype performed at three separate occasions. Means ± SEM are given. (E) Common significant GO categories for the IC populations. DC, dendritic cells; ECM, extracellular matrix; GO, gene ontology; IC, immune cells; iECKO, conditional deletion of Shb in EC; Treg, T regulatory cells. N = 6.
DC cluster characterization is shown in Fig. 1F,G and Fig. S2. Cluster 25 contained primarily cDC1 cells, which comprise antigen‐presenting cells. The cell numbers of this cluster were significantly decreased in Shb iECKO mice, supporting the view of a reduced immune activation under these conditions [37]. Cluster 9 was primarily composed of cDC2 cells, and cluster 11 of mregDC cells. Cluster 21 consisted of pDC cells.
Differentially expressed IC genes (DEGs) as a consequence EC
Shb deficiency
3.2
DEGs between wild‐type and Shb iECKO ICs were determined on the expression of genes in individual cells in each cluster. Table S3 shows all DEGs by cluster and for combined macrophage/monocyte, T cell, and DC clusters.
Selected significant gene expression changes have been summarized in Fig. 2B. A set of genes described as IFN‐induced (top five genes in Fig. 2B) can be detected as DEGs in most clusters, despite the fact that there was no increase in IFN expression among the cell populations. These genes have been described, according to Genbank (https://www.ncbi.nlm.nih.gov/gene/), to regulate virus entry, DNA binding, apoptosis, mitochondrial localization, and ubiquitin ligase. The consequences of their differential expression in immune cells for tumor biology remain unclear, although high levels of Ifitm2 were observed in terminally exhausted T cells [38]. Increased expression of genes coding for ribosomal proteins was commonly observed, suggesting increased protein synthesis in tumor ICs from Shb iECKO mice [39]. Expression of Ly6c2, Ms4a4c, Cd52, Ly6a, Ly6e, and Ly6i, all with poorly defined function in the current context (https://www.ncbi.nlm.nih.gov/gene/), was increased in several clusters. Among other gene expression changes, Inhba was increased in several clusters. Inhba codes for activin A, which is an immune suppressive cytokine [5, 40]. Another immunosuppressive cytokine gene, Tgfb1 [41], showed increased expression in cluster 1. We observed reduced Igf1 expression in a number of myeloid clusters, and lower Igf1 has been associated with the progression of breast cancer lung metastasis [42].
A set of chemokines (Ccl2, Ccl4, Ccl5, Ccl7, Ccl8, Ccl12, Ccl22, Ccl24, and Cxcl10) was conspicuously detected among the DEGs (Table S3). These interact in a largely overlapping manner with the chemokine receptors Ccr1, Ccr2, Ccr3, Ccr4, Ccr5, and Cxcr3 [43, 44, 45] expressed in monocytes, macrophages, DCs, and T cells. Chemokines alter immune responses by recruiting various immune cells, and their effects are diverse depending on context [5, 46]. Consequently, the net effect of these changes on the immune response is difficult to predict [2]. Assessing chemokine receptor stimulation in an integrative manner based on individual chemokine expression, Ccr1 appears to receive both stimulatory and inhibitory cues, Ccr2 inhibitory cues, Ccr3 stimulatory and inhibitory cues, Ccr4 inhibitory cues (see below), and Ccr5 both stimulatory and inhibitory cues. In the cases where mixed signals are provided, the spatial relationship between the different cell types may be important. Ccr2, which appeared to be less active in the Shb knockout environment, is expressed on macrophages, T cells, and DCs, and thus the outcome of reduced stimulation is hard to predict. Whereas most chemokines were downregulated in several clusters, Ccl5 expression was increased in the macrophage cluster 5, Ccl24 in the T cell and macrophage clusters 7 and 10, and Ccl22 in the mregDC‐containing cluster 11. Ccl22 interacts selectively with Ccr4 on T cells, including Tregs, and Ccl22 expression in mregDC cells has recently been shown to recruit Tregs that prevent tumor antigen trafficking to the regional lymph nodes [47]. Thus, increased Ccl22 expression in cluster 11 contributes to explaining the increased presence of Tregs, the reduction of local lymph node Tregs [29] and the reduction of the antigen‐presenting cluster 25 cDC1 population as a consequence of Shb iECKO. Operating in synergy with Ccl22 in the current context is the increase of Cxcl10, a chemokine that participates in T cell recruitment [48], which was higher in the monocyte cluster 2. The Cxcl10 cognate receptor is Cxcr3 [49] and Cxcr3‐expressing Tregs interact with type cDC1 cells to restrict antitumor immunity [50] thus also contributing to explaining the reduction of cluster 25 cell numbers. Expression of Ccl4 was reduced in the T cell cluster 19. Expression of Ccl2 (macrophage/monocyte and Treg clusters), Ccl7 (macrophage clusters), and Ccl8 (macrophage/monocyte, T cell, and DC clusters) was reduced, and the latter showed the most prominent changes. Ccl8 has been poorly studied, although it partakes in recruiting most categories of T cells, which may lead to an immunostimulatory effect [51], and thus, the reduction of Ccl8 expression may promote an immune suppressive environment. Taken as a whole, the predominant effect is reduced chemokine expression, and this is compatible with a less inflammatory environment.
Klf2, Kl4 (transcription factors), and Gdf15 (cytokine) have been shown to resist inflammatory conditions [52, 53] whereas Jund codes for a transcription factor that is required for the production of inflammatory cytokines such as Il1b [54]. The reduced expression of these genes thus also suggests a less inflammatory state in the Shb iECKO tumors.
Vcam1 codes for a cell adhesion molecule that interacts with the integrin Itga4 and endothelial Vcam1 partakes in leukocyte recruitment [14]. Macrophage Vcam1 is presumably involved in IC/IC interactions, and Vcam1‐expressing macrophages are commonly present in tumors [7, 55]. In addition, Vcam1‐expressing macrophages also express the immune stimulatory product Trem2 [55]. Thus, the reduced Vcam1 expression is paralleled by decreased expression of Trem2 in Shb iECKO macrophages (see below). Vcan codes for an extracellular matrix protein [56] that is expressed in angiogenic and monocyte‐derived macrophages [34] and is thus pro‐tumoral. RhoB was decreased in several clusters, and RhoB serves a role in endocytosis and antigen presentation [57].
Gene expression changes in the T cell and DC clusters that were not observed in the macrophage/monocyte clusters have also been listed in Table S3. Il2ra (CD25) is particularly relevant since elevated expression (37% in cluster 19) is compatible with more Tregs. Ccl22 was among the DC‐specific changes, as discussed above.
Gene expression differences were also calculated for 15 selected genes of major importance to immune suppression based on average gene expression in each individual sample and cluster followed by paired comparisons between the corresponding wild‐type and Shb iECKO populations (Fig. 2C,D). According to these comparisons, 11 were significantly (individual P values < 0.05) different in relevant macrophage or T cell clusters. In macrophage/monocyte cells, the immune stimulatory gene products Ifng (50 ± 13% decrease in all macrophage/monocyte clusters when combined) [58] and Trem2 (18 ± 7% decrease in combined clusters 0–6) [59] exhibited significantly reduced expression whereas the immune suppressive genes Visr/VISTA (7 ± 2% increase in combined 0 and 4 clusters) [60] and Cd276 (11 ± 2% increase in combined 0 and 4 clusters) [61, 62] were significantly increased (Fig. 2C). In T cells, the Treg marker Foxp3 (36 ± 16% increase in combined clusters 19 and 26) or the immune suppressing/immune checkpoint genes Icos (11 ± 5% increase in combined clusters 12, 19, 26) [4], Ctla4 (22 ± 11% increase in combined clusters 7, 12, 19, 26) [63], Tigit (153 ± 71% increase in combined clusters 7, 12, 19) [64, 65] and Havcr2/TIM3 (35 ± 13% increase in cluster 7) [3, 63] all exhibited small but significantly increased expression in ICs from Shb iECKO tumors (Fig. 2D). Ctla4, Tigit, and Havcr2/TIM3 are expressed at high levels in exhausted T cells [38]. Cd200 (23 ± 11% decrease in combined clusters 7, 12, and 26), a marker for active T effector cells [66, 67], and Cd80 (14 ± 4% decrease in combined clusters 12 and 26) [68], which when expressed in antigen‐presenting cells competes with the CTLA4 gene product for CD28 binding on T cells, were decreased under the same conditions. The expression levels of Lag3, Cd274 (PD‐L1), Pdcd1lg2 (PD‐L2), or Pdcd1 (PD1) [63] were unchanged. Although PD‐L1 and PD1 are important immune checkpoint proteins, their lack of altered expression does not necessarily invalidate the relevance of the other immune checkpoint gene expression changes since the final immunosuppressive state will be the product of many modest changes that in the end will tip the response towards a pro‐tumoral state.
Taken together, the IC gene expression profile in response to Shb iECKO, despite moderate changes, suggests an overall immunosuppressive mode, which is possibly a consequence of the altered chemokine and cytokine profile observed in myeloid cells. This view is further reinforced by the increased cell number of IFN‐macrophage cluster 4, which corresponds to a Cd274 (PD‐L1)‐high macrophage cluster commonly present in tumors, thus likely to be tumor supportive, and the reduction in cell number of the antigen‐presenting cDC1 cluster 25 [37].
Gene ontology (GO) analysis of IC DEGs as a consequence of EC
Shb deficiency
3.3
GO molecular function by Toppgene (https://toppgene.cchmc.org/enrichment.jsp) pertaining to ‘structural constituent of ribosome’ (P < 0.0001), ‘CCR1, CCR2, CCR4 and CCR5 chemokine receptor binding’ and ‘cytokine receptor binding’ (P < 0.02), ‘cell adhesion molecule binding’ (P < 0.02) and ‘lipoprotein particle binding’ (P < 0.02) were observed in macrophages/monocytes (Fig. 2E). ‘Thioredoxin peroxidase activity’ (P < 0.01) was observed in cluster 18. These conferred significant changes to the biological processes ‘response to virus and biotic stimulus’, ‘response to lipid’, ‘regulation of immune response’, and ‘lymphocyte or T cell activation’. As cellular components, ‘ribosome’ and ‘focal adhesion’ were identified. In T cells, ‘chemokine receptor binding’ (P < 0.0001), ‘antigen binding’ (P < 0.05), ‘collagen binding’ (P < 0.05) and ‘immune receptor activity’ (P < 0.05) were observed (Fig. 2E). These had implications for ‘regulation of immune system process’, ‘response to biotic or virus stimulus’ and ‘T cell activation’. Cellular components of ‘endolysosome’ (P < 0.02) and ‘extracellular matrix’ (P < 0.05) were changed. DCs (cluster 25) exhibited ‘structural constituent of ribosome’ (P < 0.05) and ‘response to cytokine’ (P < 0.05). Changed biological processes were ‘response to virus or biotic stimulus’ and ‘regulation of immune system process’ (Fig. 2E). Table S4 provides a detailed list of GOs in individual clusters or in merged macrophage/monocyte, T cell and DC populations. The changes are in line with properties that infer an altered immune response.
EC gene expression changes in Shb‐deficient tumor
3.4
Bulk EC RNAseq was performed on wild type and Shb iECKO samples in four separate experiments from nine wild type and eight KO tumors. Means of each genotype in each separate experiment were calculated and compared by paired Student's t‐test. Significant differences in gene expression and expression values for all genes are shown in Table S5A,B. Gene ontology (GO) analysis for the differentially expressed genes is shown in Table S6. The GOs recorded were fairly non‐specific, including a number of processes and components such as the cytoskeleton, focal adhesions, ribosomes, endothelial barrier, and apoptosis. Previous literature has compiled a large number of ligand/receptor interactions [32] and using these, we then analyzed the significant EC gene expression changes in a ligand/receptor context. EC ligand changes (Table S5C) and their EC receptor partners are shown in Fig. 3A. The EC ligands fall into the categories ‘secreted ligand, cell surface ligand (including intracellular modification of ligand signaling) and extracellular matrix’. Finally, all significant EC receptor changes are displayed in Fig. 3B, Table S5C. To understand the possible relevance of the differentially expressed EC ligand and EC receptor interactions in Fig. 3A,B and Table S5, the literature was searched for reported responses, and the most likely and prominent effects in relation to the vasculature and its influence on immune cells were presented (Table 1). Gene expression changes that support decreased sprouting angiogenesis and leakage according to the literature strongly predominate, falling in line with the experimental observations. These include Notch4, Dll4, Jag1, Src, Prprj, Sdc1, Sdc2, Sdc4, Vegfa, Fgd5, Ptk2b, Efnb1, Sema3a, Sema4b, and Sema6d. Only an increase in Plcg1 stands out as a change suggesting an opposite effect. There were numerous EC DEGs coding for receptors (Fig. 3B, Table S5) of possible interest. Erbb3 has been shown to be important for the endothelial cytoskeleton in vitro [112]. Additionally, Ednra codes for an endothelin receptor, Gpr135 a bradykinin receptor, Npr1 a natriuretic receptor, Ptprs a receptor tyrosine phosphatase that localizes to junctions, Rpsa a laminin receptor, and Traf3 a product that interacts with Cd40lg on T cells according to Genbank. These have not been explored in detail in the present context but are potentially relevant mediators in immune responses.
Breast cancer EC gene expression changes upon Shb iECKO. (A) Wheel chart showing EC ligand gene expression changes according to published ligand–receptor interactions and cognate receptors expressed in EC. Ligands were categorized as secreted proteins, cell surface proteins, and extracellular matrix proteins. Red = increased expression, blue = decreased expression. (B) Volcano plot of the EC receptor gene expression changes according to published ligand–receptor interactions. Receptors with intracellular ligands have been omitted. Genes with gray text represent EC receptor genes differentially expressed with cognate ligands significantly differentially expressed in EC. (C) Current EC gene expression changes and described effects upon knockdown in EC on leukocyte transendothelial migration (TEM) [69]. (D) Significant EC gene expression changes after Shb iECKO grouped according to GSEA mSigDB (adherens junctions, adhesion molecules, actin cytoskeleton, VEGF signaling) and GO (actin organization, establishment of endothelial barrier, focal adhesion). (E) GO categories of significant EC gene expression changes, EC, endothelial cells; GO, gene ontology; iECKO, conditional deletion of Shb in EC. Significant changes in A–E were determined on 11 wild‐type and 10 iECKO samples performed on four separate occasions using a paired Student's t‐test.
A comparison of the present data with those of Wang et al. [69] on genes relevant for leukocyte transendothelial migration (TEM) has been compiled in Fig. 3C. The data demonstrate disparate effects with respect to predicted TEM responses, further supporting pleiotropic effects of EC Shb deficiency on the immune system. EC gene expression changes pertaining to adherens junctions (https://www.gsea‐msigdb.org/gsea/msigdb/human/geneset/KEGG_ADHERENS_JUNCTION.html), adhesion molecules (https://www.gsea‐msigdb.org/gsea/msigdb/human/geneset/KEGG_CELL_ADHESION_MOLECULES_CAMS.html), actin cytoskeleton (https://www.gsea‐msigdb.org/gsea/msigdb/human/geneset/WP_REGULATION_OF_ACTIN_CYTOSKELETON.html) and Vegfa signaling (https://www.gsea‐msigdb.org/gsea/msigdb/human/geneset/KEGG_VEGF_SIGNALING_PATHWAY.html) are displayed in Fig. 3D. In addition, gene expression changes pertaining to the GO categories ‘actin organization’, ‘establishment of endothelial barrier’, and ‘focal adhesion’ have been indicated (Fig. 3D), implicating their importance for vascular and immune cell responses. Prominent GOs based on DEGs presented in Fig. 3A,B are displayed in Fig. 3E.
In summary, the observed reduced angiogenesis and leakage phenotypes [29] are easily supported by the EC gene expression changes and are in line with ‘vascular normalization’. Of further importance are the components adherence junctions, actin organization, and extracellular matrix. In addition, numerous gene expression changes were observed that are likely to influence the immune system in a complex manner. The changes may allow for an immune cell environment to evolve that shows important changes in cytokines, chemokines, cell adhesion molecules, and immune checkpoint proteins.
EC and IC DEGs and their interactions
3.5
The potential interactions between EC DEG ligands and cognate receptors on ICs are depicted in Fig. 4A. A number of ligand/receptor pairs are likely to affect IC function. Concerning EC/IC interactions, that is, IC adhesion to EC, TEM, and IC activation by ECs, a disparate pattern of responses was observed (Table 1). This provides a rationale for the overall pro‐tumoral/immunosuppressive response since it may cause selective recruitment of relevant immunosuppressive cell populations. One response that has previously been characterized is the recruitment of Tgfb1‐expressing monocytes by endothelial Sema3a [83]. Tgfb1 codes for an immunosuppressive cytokine that exhibited elevated gene expression in a macrophage cluster, and this could reflect increased Sema3a‐dependent monocyte TEM that has subverted the immune system to a pro‐tumoral phenotype. However, numerous other changes which have a potential impact on leucocyte capture, recruitment, TEM, and activation, thus contributing to the immune environment, are apparent (Table 1). Those include Efnb1, Dll4/Jag1, Cxcl12, Pdgfa/Pdgfd, Sema4b, Tnfsf4, and Bmp7 with respect to EC ligand changes. Cxcl12, Dll4, Jag1, Pdgfd, and Class II MHC appear to exhibit pleiotropic effects in this context (Table 1). Areg (Fig. 3A) has been shown to promote an inflammatory environment [113] and thus a reduction in Areg expression is compatible with reduced inflammation. Bmp4, Hgf, Sema3a, Sema6d, Vegfa, and Wnt7b have been reported to exert diverse direct or indirect effects on IC (Table 1). Btla, when expressed in T cells, suppresses immune responses [114]; Ihh is required for thymus development [115] and Il24 partakes in inflammation [116]. Ngf exerts multiple roles in the immune system [117] and Tgfb3 is both immunosuppressive and immunostimulatory depending on context [118]. Vwf plays a role in leukocyte recruitment [119].
EC‐IC interactions according to published ligand–receptor interactions based on tumor EC and IC gene expression changes in Shb iECKO mice. (A) Wheel chart of EC ligand (secreted, cell surface, extracellular matrix) and potential cognate receptors expressed in ICs (monocytes/macrophages, T cells, DCs, or ICs in general according to color code). (B) Monocyte/macrophage ligand gene expression changes and potential cognate receptors in T cells, monocytes/macrophages/DCs or ICs in general. (C) Monocyte/macrophage receptor gene expression changes with potential cognate ligands in ICs in general. (D) T cell ligand gene expression changes and potential cognate receptor gene expression changes in T cells, monocytes/macrophages/DCs and ICs in general. (E) T cell receptor gene expression changes and cognate ligands in T cells, monocytes/macrophages/DCs and ICs in general. (F) DC ligand gene expression changes and cognate receptors in T cells or ICs in general. (G) DC receptor gene expression changes and cognate ligand in ICs in general. Increased (red) or decreased (blue) expression has been color coded in A–G. DC, dendritic cells; EC, endothelial cells; IC, immune cells; iECKO, conditional deletion of Shb in EC; Mac, macrophages; Mono, monocytes; T, T cells. N = 6 for each IC genotype and n = 11 for wild‐type and n = 10 for iECKO genotype. Statistical differences were determined as in Figs 2 and 3.
In summary, EC gene expression changes are likely to exert pleiotropic effects on the immune system. One alteration that may partially explain the anti‐inflammatory status of the *Shb‐*KO tumors is Sema3a‐dependent recruitment of Tgfb1‐expressing monocytes.
Macrophage/monocyte ligand gene expression changes that may interact with IC receptors are shown in Fig. 4B. Many of these have already been described above (Fig. 2B) as macrophage/monocyte DEGs. Plau and Timp2 are also present among the EC DEGs. Gas6 stimulates the EC DEG receptors Axl and Tyro3, suggesting reciprocal IC to EC signaling. A reduction in macrophage‐derived Vegfc will reduce lymphangiogenesis [120] whereas Il1rn is anti‐inflammatory [121]. Apoe (apolipoprotein E), Lpl (lipoprotein lipase), and Pltp (phospholipid transfer protein) pertain to aspects of lipid metabolism.
Differentially expressed macrophage/monocyte receptors were Aplp2, Fpr2, Sell, Tyrobp, Trem2, Cd36, Asgr2, and Cxcr4 (Fig. 4C). Trem2 has been described above as an immune checkpoint protein, and Sell and Cd36 were also observed among EC DEGs. Cxcr4 is the Cxcl12 receptor, and endothelial Cxcl12 was reduced, suggesting another example of synergy between EC and IC signaling.
T cell ligand gene expression changes that may interact with IC receptors are shown in Fig. 4D. These largely overlapped with the macrophage/monocyte changes except for Ccl4, Ccl24, and Psap (prosaposin). Differentially expressed receptor genes were Cd72, Il2ra (CD25), Il7ra, Il18r1, Tnfrsf4, Itgal, Tyrobp, and Klrc1 (killer cell lectin‐like receptor C1) (Fig. 4E). Particularly, CD25 is an important player in the immunosuppressive role of Tregs.
DC ligand gene expression changes that may interact with IC receptors and DC receptors that interact with IC ligands are shown in Fig. 4F,G. Besides Ccl22, which has been discussed above, the other changes overlap largely with macrophage gene expression changes.
Vascular barrier morphology and tumor hypoxia as a consequence of EC
Shb deficiency
3.6
Of interest to the immune cell gene expression profile in the breast carcinoma model of Shb iECKO is the function of the vasculature with respect to leakage and oxygenation. We previously reported less leakage in this model [29]. This is confirmed by more extensive VE‐cadherin coverage of the tumor vasculature as a consequence of Shb iECKO (Fig. 5A), in agreement with reduced leakage and further suggesting that the immune phenotype is not a direct consequence of increased vascular leakage. In addition, there were no signs of increased hypoxia as assessed by Hif1a staining (Fig. 5B), contradicting the assumption that the immune cell alterations were hypoxia‐induced and further supporting the notion of vascular normalization.
E0771 tumors in mice in wild‐type (WT) or Shb iECKO (KO) mice. (A) Staining for CD31 (red), VE‐cadherin (green), and DAPI (blue). Vessels with partial or nearly complete VE‐cadherin coverage are shown by confocal microscopy. Quantitation for 3 WT and 5 KO separate mice (percent coverage of vascular circumference ± SEM) is shown. ** indicates P < 0.01 by Student's t‐test. (B) HIF1a (hypoxia‐induced factor 1a) staining of wild‐type (WT) and Shb iECKO (KO) tumors with quantitation (normalized unit intensity ± SEM) for 3 WT and 5 KO separate mice. iECKO, conditional deletion of Shb in EC. Scale bars for A (50 μm) and B (200 μm) have been indicated.
Vascular and immune cell characteristics of human breast cancer
3.7
In relating the experimental mouse data of increased metastasis and less leakage paralleled by an immunosuppressive environment to human breast cancer, a cohort of 20 triple‐negative breast cancers were stained for vascular and immune cell markers. The tumor characteristics have been summarized in Table S7. Sections were stained for VE‐cadherin (endothelial adherens junctions), FpA (fibrinogen peptide A reflecting leakage, [122]), CD4 (T helper cells), FOXP3 (Tregs), CTLA4 (immune suppressing T cells expressing the CTLA4 immune checkpoint protein), CD8 (T killer cells), PD1 (immune suppressed T cells responding to PD‐L1), PD‐L1 (CD274 which is an immune checkpoint protein), CD163 (CD163 which is a marker for macrophages), CD20 (MS4A1 which is a marker for B cells), and granzyme B (GZMB which is a marker for T and NK cells active in target cell killing). The stroma surrounding the tumor proper was commonly rich in immune cells and displayed a higher vascular density (Fig. S3A,B).
Tumor staining for FpA, FOXP3, CD4, and DAPI is shown in Fig. 6A–F. Among the immune cell populations in the different tumors, FOXP3‐stained nuclei in almost exclusively CD4^+^‐cells (Fig. 6C,E), and tumor FOXP3^+^ cell counts correlated with those of CD4^+^ cells, indeed supporting the notion that these are primarily CD4^+^ Tregs (Fig. S4A). The ratio FOXP3^+^/CD4^+^ was thus taken as the relative proportion of Tregs among T helper cells. CTLA4^+^ correlated with CD4^+^ cells and FOXP3^+^/CD4^+^ cells (Fig. S4B,C), suggesting that Tregs commonly express the immune checkpoint protein CTLA4. However, CTLA4 staining occasionally was observed in non‐immune cells, and this was particularly apparent in one tumor (Fig. S4L, tumor from patient six), suggesting that some tumor cells also express CTLA4 in this cohort. CD4^+^ cells also correlated positively with CD8^+^, CD20^+^, and CD163^+^ cells (results not shown), in line with an overall inflamed tumor phenotype. Granzyme B was determined as a ratio of GZMB^+^/CD8^+^ cells, and this ratio did not correlate with any other vascular or IC marker among the tumors (results not shown). PD1, a marker for exhausted CD8^+^ cells, also showed no correlation with any other vascular or IC marker (results not shown). The percentages of GZMB^+^/CD8^+^ or PD1^+^/CD8^+^ cells were low (never exceeding 21% in any tumor), and only granzyme B showed relevant co‐expression with CD8 (Fig. S3C,D), suggesting that the tumors show no propensity toward active cytotoxicity or CD8^+^ exhaustion.
Human tumor IC and leakage staining. One tumor with low leakage (A, C, E) and one with high leakage (B, D, F) are shown. FpA (leakage A–B; gray), FOXP3 (Tregs C–D; red) and merged image (E, F) with CD4 (T helper cells; green) and DAPI (blue) in addition are shown. (G) Negative correlation between the FOXP3/CD4 ratio (indicating the relative fraction of Tregs) and leakage is shown (P < 0.02). The two tumors in panels A–F are indicated with red boxes. (H) Negative correlation between leakage and tumor size (diameter in mm). P < 0.05. (I) Negative correlation between leakage and CD163+ cells. P < 0.05. (J) Kaplan–Meier survival plots of overall survival in years among patients with lower or higher than median leakage. P < 0.01 by log‐rank sum test. Alive patients at the end of the study were censored. Corresponding cox regression for overall survival comparing patients with leakage above versus below median showed a hazard ratio of 13.69 (95% CI: 1.62–115.61, P = 0.016, Wald test). Cells per unit area (0.002 mm2) were determined as well as FpA‐positive area in percent. Significant Pearson r correlation P values are indicated. Correlation coefficients (r) in G–I are −0.540, −0.491, and −0.453, respectively. IC, immune cells. N = 20 patients for A–J. Scale bar of 100 μm for A–F is shown below.
Tumor diversity with respect to the vascular and IC markers was extensive (Table 2). It can be noted that tumors 6, 9, and 11 showed high numbers of cells expressing the immunosuppressive markers FOXP3^+^/CD4^+^ and CTLA4^+^. These tumors did not display high levels of leakage. On the other hand, tumors 1, 2, and 14 showed low numbers of cells expressing these immunosuppressive markers while simultaneously exhibiting high leakage. To better understand tumor diversity with respect to vascular and IC markers, correlations between the variables were determined.
When comparing vascular density (VE‐cadherin staining) with immune cell populations in these tumors, a positive correlation was observed for CD4 (Fig. S4D), FOXP3 (Fig. S4E), and CTLA4 (Fig. S4F). This suggests that a high vascular density indeed promotes immune cell infiltration. However, leakage did not correlate with vascular density and tumor infiltration of CD4^+^, FOXP3^+^, CTLA4^+^, and PD‐L1^+^ cells. The only T cell population that showed a correlation (negative) with leakage was FOXP3^+^/CD4^+^ cells, that is, the relative Treg abundance, which was significantly reduced in tumors with high leakage (Fig. 6A–G). The relative Treg abundance may be a significant factor in immune suppression since not only total cell population numbers matter but also the relative proportion of the particular cell population. Tumor size and CD163 (a marker for macrophages) also displayed a negative correlation with leakage (Fig. 6H,I), suggesting a possible negative relationship between leakage and tumor growth—macrophages—Tregs. The immune checkpoint protein PD‐L1 was largely expressed in CD163^+^ cells (Fig. S3E,F) and correlated with CD4^+^ and CD163^+^ expression (Fig. S4G,H).
In contrast to this, tumor metastasis appeared to be less common in patients with tumors exhibiting less leakage. Whereas seven of 10 high leakage patients exhibited metastasis (Table 2), metastasis in patients with low leakage was observed in three of 10 patients. This difference was, however, not statistically significant (P = 0.074 by chi‐square test), likely due to the low number of patients. However, survival was increased in patients with low leakage (Fig. 6J). There was no significant difference in age between the ‘high’ versus ‘low’ leakage groups (65.8 ± 4.3 and 68.4 ± 4.6 years, respectively, P = 0.69).
The findings partly confirm those of the experimental mouse model of Shb‐gene inactivation in ECs that resulted in reduced tumor leakage and increased immune suppression. However, vascular leakage appears to play a predominant role over immune suppression in human breast cancer metastasis.
Discussion
4
This study was conducted in order to understand the role of ECs in the regulation of breast cancer immune responses by investigating IC and EC gene expression changes under conditions of low vascular leakage. This was motivated by the observation that in an experimental mouse model with conditional Shb deficiency in ECs, orthotopic E0771.lmb triple‐negative breast carcinoma metastasis was increased due to immune suppression and not to increased vascular leakage [29]. The main findings of this study on human breast cancer are that immune suppression is associated with reduced vascular leakage, whereas metastasis may be more prevalent in tumors with high leakage. The experimental mouse model suggests that this was due to a primary endothelial effect since Shb deficiency was induced in endothelial cells. This could infer that the human data on immune suppression and leakage also reflect a primary endothelial alteration.
In‐depth analysis of the gene expression changes occurring in EC as a consequence of Shb deficiency mostly supports a non‐leaky vasculature, as does the increased fraction of vascular VE‐cadherin coverage. This vascular phenotype, together with unchanged tumor oxygenation, is in line with the concept of ‘vascular normalization’ [12]. A recent study reported that vascular normalization by angiogenesis inhibition selectively increased CD8^+^ T cell infiltration into hepatocellular carcinoma [125]. That finding agrees with our present finding of reduced vascular leakage supporting selective extravasation of a specific immune cell population. However, in contrast to the present findings, an IC component (CD8^+^ effector cells) that promoted an immune response was selectively stimulated in that study. Such a dichotomy suggests that a specific IC response to ‘vascular normalization’ is subject to control by the local tumor milieu, including the degree of oxygenation and/or cytokine/chemokine production, and consequently the responses cannot easily be categorized as simply ‘immune suppressive’ or ‘immune stimulatory’ but rather a mix of these in which the balance may be skewed in either direction due to minor local differences. Although vascular normalization has, in many cancer models, been found to improve the efficacy of immunotherapy [126, 127], we do not think that our present data necessarily contradicts this notion. An immunosuppressed environment with an increased abundance of Tregs, as currently observed, may be more amenable to immune checkpoint inhibition since this cell type responds to anti‐PD‐L1 immunotherapy [128].
It is uncertain whether the selective immune response is solely a consequence of reduced vascular leakage or reflects a parallel endothelial process. Numerous EC gene expression changes were observed occurring in the non‐leaky Shb iECKO tumors, and these would be expected to exert pleiotropic effects on IC function. This provides a rationale for the disparate immune responses in different tumors—depending on local conditions, different responses will predominate.
The IC landscape in the experimental model suggests a primarily immunosuppressive environment with relatively more Tregs, slightly increased immune checkpoint protein expression, and fewer cDC1 antigen‐presenting cells. Whether this is a direct consequence of the EC phenotype or secondary to EC‐dependent changes in the monocyte/macrophage populations cannot presently be determined. Among the monocyte/macrophage populations, a large plethora of changes was observed, some immune inhibitory and others immune stimulatory, making it difficult to predict the changes that are responsible for immunosuppression.
When a human triple‐negative breast cancer cohort was investigated, a considerable variation between different tumors with respect to vascular and IC characteristics was noted. Conspicuously, three tumors with high leakage showed low infiltration of immune suppressive cells, whereas three tumors with low leakage had high infiltration of immune suppressive cells. Thus, it was considered that determining correlations between different parameters within the cohort was an appropriate manner in order to establish relevant differences. Accordingly, a negative correlation between leakage and Tregs or CD163 macrophages was observed. That both were similarly altered is in agreement with an interdependence between Tregs and myeloid cells. However, the presence of Tregs in human breast cancer appears to play a subordinate role compared with leakage for metastasis since tumors with less leakage did not exhibit much metastasis but rather longer survival. This is in contrast to the mouse experimental model. Although experimental mouse models are useful in proposing mechanistic aspects of relevance to human disease, their applicability to full‐scale understanding is limited. Unlike metastasis, tumor size was increased in tumors with low leakage in human disease. This indicates that tumor growth and tumor metastasis are two independent processes.
It should be noted that the tumor sample size is limited (20 patients) and thus future validation in larger, independent tumor cohorts is required.
Conclusions
5
In summary, the EC phenotype influences the immune response, which in the case of breast carcinoma is primarily immune suppressive in tumors with low vascular leakage (Fig. 7). A likely explanation is selective IC extravasation which alters the tumor IC landscape, thus conferring numerous gene expression changes including those of chemokines. Consequently, there is a selective increase of Tregs in tumors with low vascular leakage. From a general perspective, the data are in line with the notion that selective IC extravasation is dependent on intact functional junctions and that immunosuppressive or immunostimulatory conditions are the consequence of the local environment. This suggests that the vasculature in human tumors plays a crucial role in shaping immune dynamics and therefore is an important target of therapeutical intervention. Targeting vascular function could either enhance antitumor immune responses or limit metastatic spread, depending on the specific characteristics of the tumor microenvironment.
Schematic figure illustrating the differences between wild‐type breast tumors (right side) and tumors with ‘vascular normalization’ as observed in Shb iECKO mice (left side). The wild‐type tumors have high leakage, relatively few Tregs, and few anti‐inflammatory macrophages (defined as CD163 positive [123, 124] and/or with altered chemokine/cytokine profiles). The Shb iECKO phenotype displays low leakage in line with ‘vascular normalization’ and has more Tregs and anti‐inflammatory macrophages. The human breast cohort displays variability with respect to these alternate states, giving rise to distinct tumor characteristics. EC, endothelial cell; iECKO, conditional deletion of Shb in EC; Treg, T regulatory cell.
Conflict of interest
The authors declare no conflict of interest.
Author contributions
LH performed bioinformatic analysis and figure design. CT conducted the tumor experiments and CD45^+^/CD31^+^ cell isolations. NH performed multiplex staining and scanning of human tumor samples. AB did mouse tumor staining and participated in tumor experiments. AS characterized breast cancer patients. EN helped analyze vascular staining patterns. MP contributed to analyzing IC gene expression changes and supported the study. CS designed the human breast cancer study. LH, CT, CS, and MW all participated in study design and interpretation of data. MW wrote the paper. All authors have read and commented on the manuscript and approved submission.
Supporting information
Fig. S1. Cluster expression of signature macrophage and monocyte gene markers. Fig. S2. Cluster expression of signature T cell and DC (dendritic cell) gene markers. Fig. S3. (A) Typical staining for VE‐cadherin (vascular, red), FpA (leakage, gray), and CD4^+^‐cells (green). (B) DAPI of the same section. Tumor boundary has been indicated. (C) CD8 (white) and GZMB (green) or (D) PD1 (red). (E, F) CD163 (yellow) and PD‐L1 (red) in human breast cancer stroma. Fig. S4. Correlations between CD4 and FOXP3 (A), CTLA4 and CD4 (B) and CTLA4 and FOXP3/CD4 (C) in the human breast cancer cohort. Correlation between vascular density (VE‐cadherin staining) and CD4 (D), vascular density and FOXP3 (E) and vascular density and CTLA4 (F) is also shown. (G) Correlation CD4 and PD‐L1 and (H) correlation CD163 and PD‐L1. A tumor with tumor cell CTLA4‐staining is also shown. (I) DAPI (blue), (J) CD4 (green) and FOXP3 (red), (K) FpA (gray) and VE‐cadherin (red) and (L) CTLA4 (yellow). Table S1. IC cluster cell numbers. Table S2. Extended list of signature markers in different myeloid clusters. Table S3. Gene expression differences in myeloid, T cell and DC (dendritic cell) cell clusters. Table S4. GO of gene expression changes listed in Table S3. Table S5. EC (endothelial cell) gene expression changes. Table S6. GO (gene ontology) categories of EC (endothelial cell) gene expresssion changes. Table S7. Tumor and patient characteristics. Table S8. List of immune reagents and software.
The reference list from the paper itself. Each links out to its DOI / PubMed record.
- 1Hanahan D , Weinberg RA . Hallmarks of cancer: the next generation. Cell. 2011;144:646–674. 10.1016/j.cell.2011.02.013 21376230 · doi ↗ · pubmed ↗
- 2Schol P , van Elsas MJ , Middelburg J , Nijen Twilhaar MK , van Hall T , van der Sluis TC , et al. Myeloid effector cells in cancer. Cancer Cell. 2024;42:1997–2014. 10.1016/j.ccell.2024.11.002 39658540 · doi ↗ · pubmed ↗
- 3Cohen M , Giladi A , Barboy O , Hamon P , Li B , Zada M , et al. The interaction of CD 4(+) helper T cells with dendritic cells shapes the tumor microenvironment and immune checkpoint blockade response. Nat Cancer. 2022;3:303–317. 10.1038/s 43018-022-00338-5 35241835 · doi ↗ · pubmed ↗
- 4Geels SN , Moshensky A , Sousa RS , Murat C , Bustos MA , Walker BL , et al. Interruption of the intratumor CD 8(+) T cell:Treg crosstalk improves the efficacy of PD‐1 immunotherapy. Cancer Cell. 2024;42:1051–1066.e 1057. 10.1016/j.ccell.2024.05.013 38861924 PMC 11285091 · doi ↗ · pubmed ↗
- 5Galassi C , Chan TA , Vitale I , Galluzzi L . The hallmarks of cancer immune evasion. Cancer Cell. 2024;42:1825–1863. 10.1016/j.ccell.2024.09.010 39393356 · doi ↗ · pubmed ↗
- 6Hegde S , Leader AM , Merad M . MDSC: markers, development, states, and unaddressed complexity. Immunity. 2021;54:875–884. 10.1016/j.immuni.2021.04.004 33979585 PMC 8709560 · doi ↗ · pubmed ↗
- 7Franklin RA , Liao W , Sarkar A , Kim MV , Bivona MR , Liu K , et al. The cellular and molecular origin of tumor‐associated macrophages. Science. 2014;344:921–925. 10.1126/science.1252510 24812208 PMC 4204732 · doi ↗ · pubmed ↗
- 8Mantovani A , Marchesi F , Malesci A , Laghi L , Allavena P . Tumour‐associated macrophages as treatment targets in oncology. Nat Rev Clin Oncol. 2017;14:399–416. 10.1038/nrclinonc.2016.217 28117416 PMC 5480600 · doi ↗ · pubmed ↗