Genome-wide insights into adaptive divergence, historical demography, and habitat suitability of Ptychobarbus Kaznakovi and P. leptosomus
Taiming Yan, Ping Chen, Huiling Wang, Mengna Chang, Qipeng Fu, Wenjie Luo, Fei Liu, Junjie Huang, Wenxiang Ding, Kuo Gao, Lin Wen, Jinxing Xiong, Haochen Wang, Rukui Zeng, Ziting Tang, Zhi He, Deying Yang

TL;DR
This study explores the genetic and evolutionary history of two fish species, revealing how geological and environmental changes shaped their divergence and adaptation.
Contribution
The study provides genome-wide insights into the adaptive divergence and historical demography of Ptychobarbus species.
Findings
P. leptosomus is an independent species distinct from P. kaznakovi.
Environmental factors like precipitation and temperature seasonality influence genetic differentiation.
Selected genes are linked to adaptation in high mountain water environments.
Abstract
Our previous study from 2024 indicated that Ptychobarbus leptosomus is a new species found only in the Yalong River (the largest tributary of the Jinsha River). P. leptosomus was historically classified as P. kaznakovi, which lives in the Jinsha River. To date, the evolutionary history and population dynamics of P. leptosomus and P. kaznakovi have not been reported. In our study, both species have similar morphologies, which may reflect gene flow between the two species. Genotyping-by-sequencing (GBS) technology was utilized to acquire whole-genome single-nucleotide polymorphism (SNP) markers, which were subsequently used to assess population structure, population dynamics, and adaptive differentiation. Phylogenetic and population structural analyses based on SNPs indicated that P. leptosomus is an independent Picea species. Additionally, P. kaznakov is more closely related to P.…
Genes, proteins, chemicals, diseases, species, mutations and cell lines named across the full text — each resolved to its canonical identifier and authoritative record.
Click any figure to enlarge with its caption.
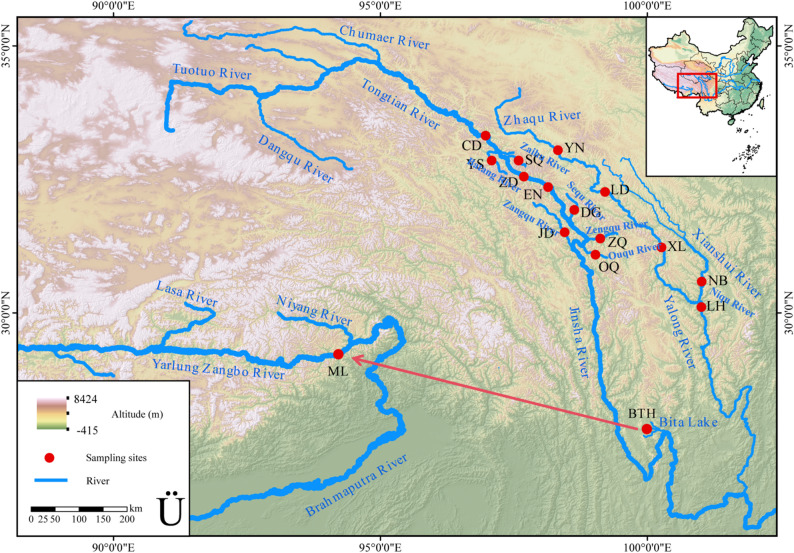 Figure 1
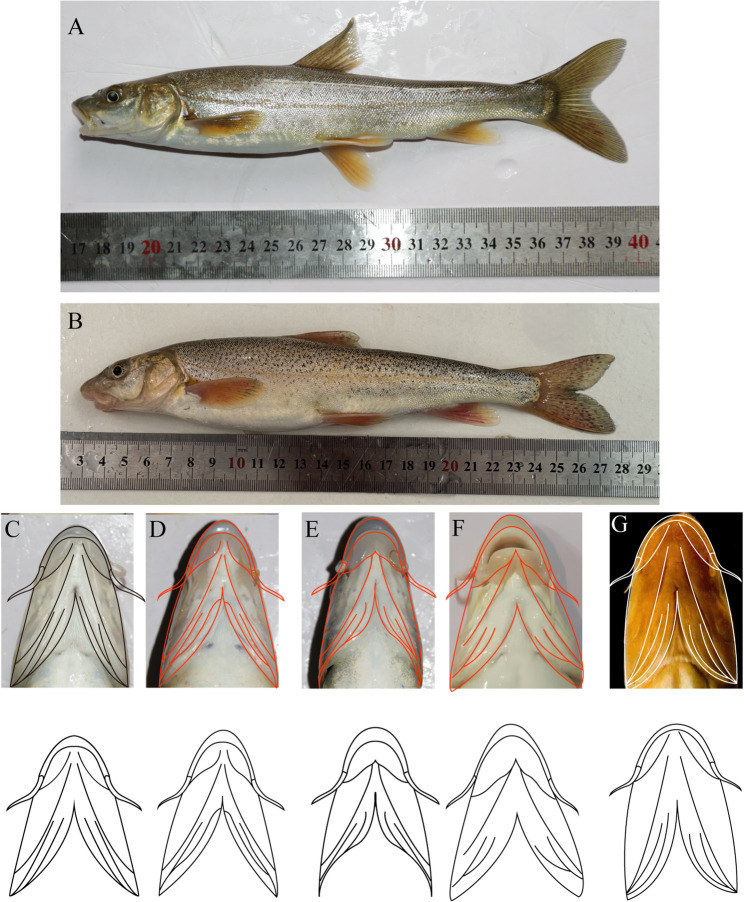 Figure 2
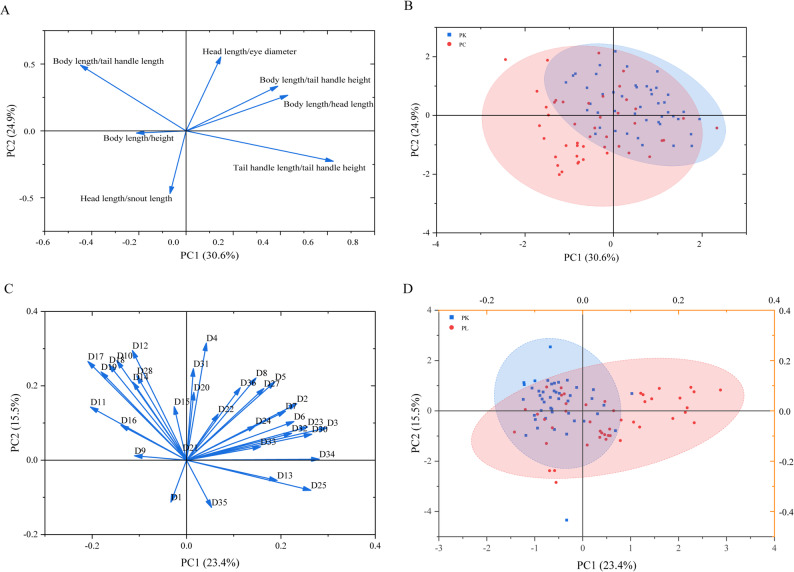 Figure 3
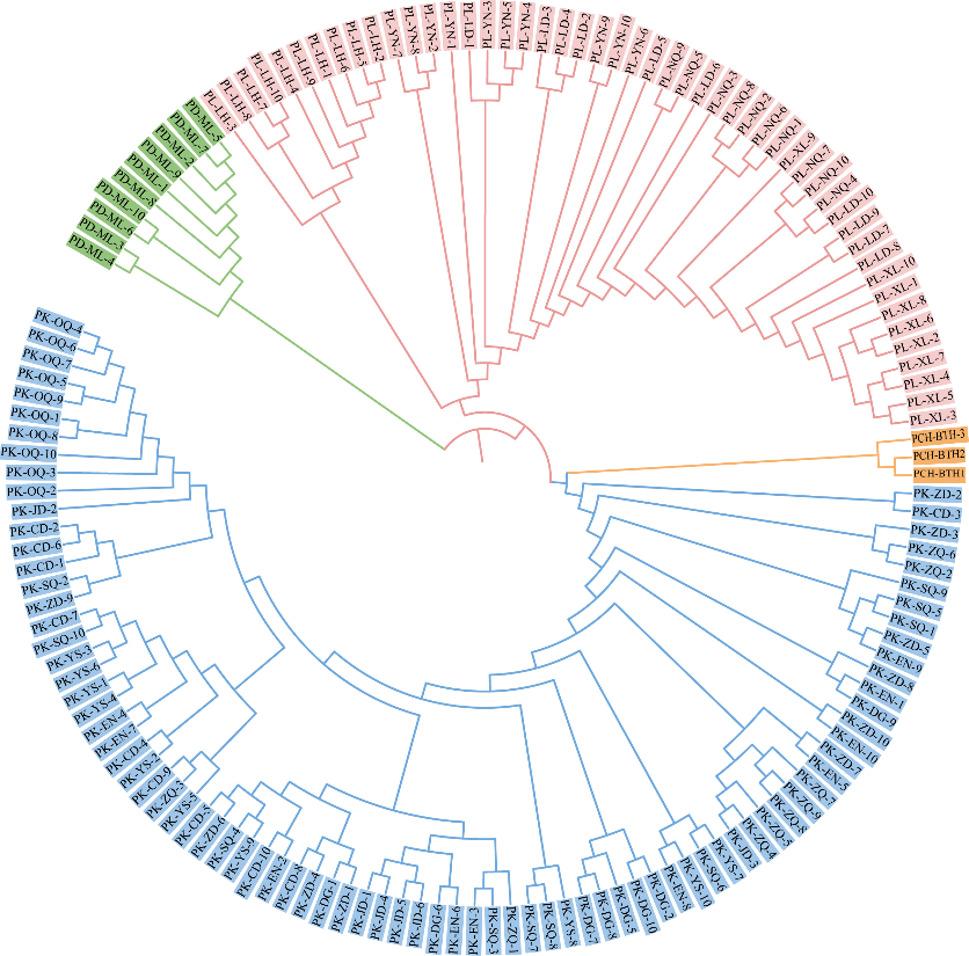 Figure 4
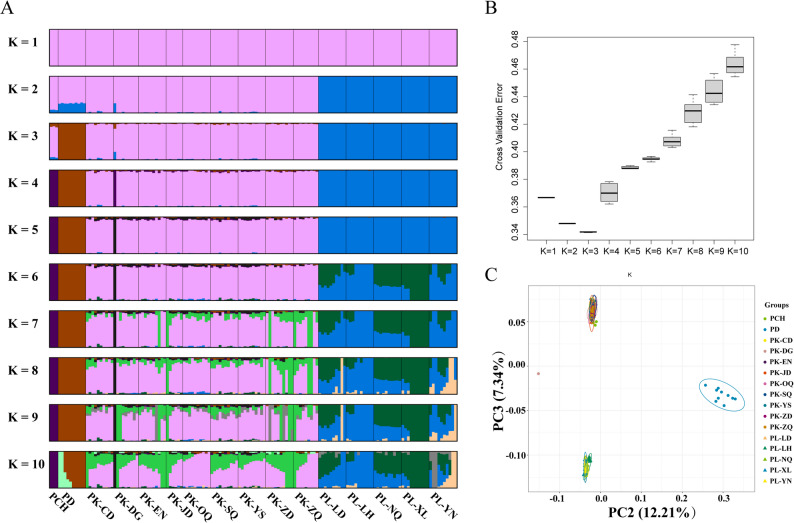 Figure 5
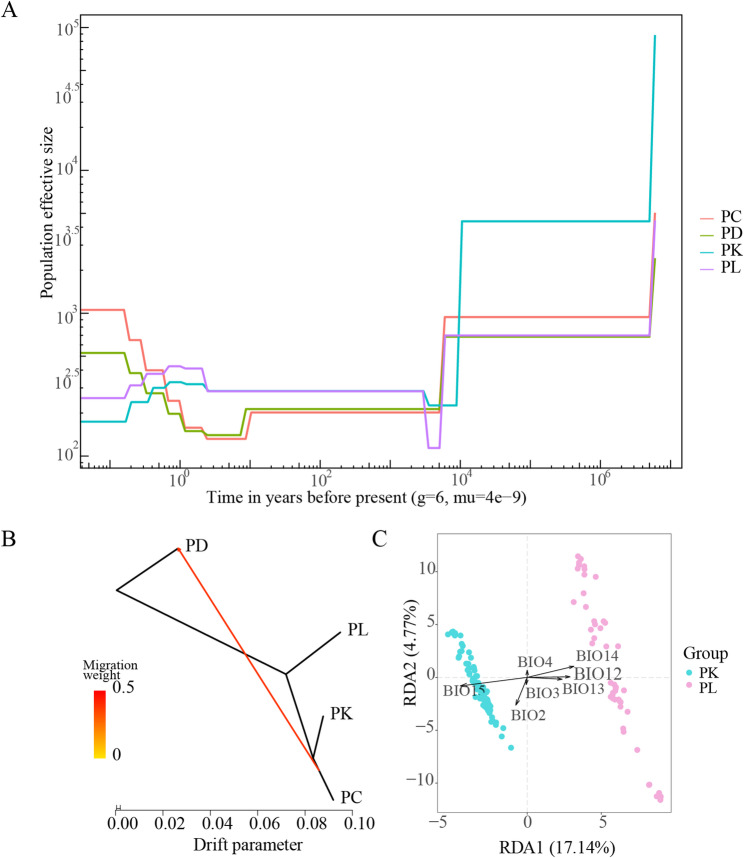 Figure 6
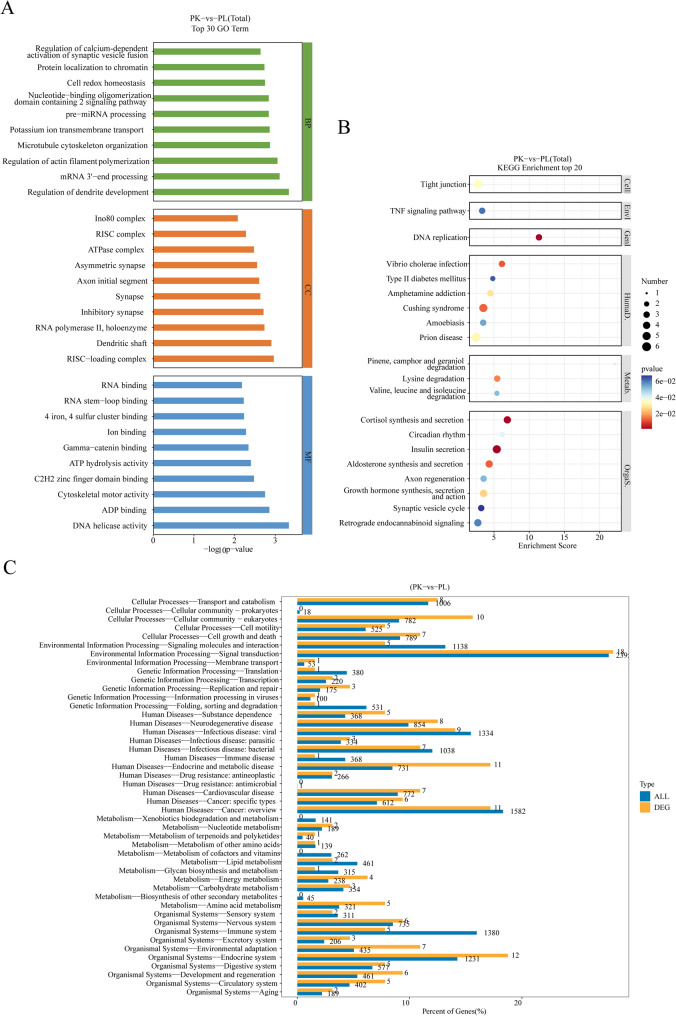 Figure 7
Peer Reviews
No public reviews on file for this paper yet. If you reviewed it on a platform where reviews are public (OpenReview, ICLR, NeurIPS, ICML), you can paste yours below so the community can read it here.
Videos
No videos yet. Explain this paper in a talk, walkthrough, or lecture? Add one.
Taxonomy
TopicsBotanical Studies and Applications · Genetic diversity and population structure · Yeasts and Rust Fungi Studies
Background
Complex geological events (such as river capture) and climate change-induced geographical isolation are the major drivers shaping the current genetic diversity and structural patterns of many biotas [1, 2]. The complex ecological environment of the mountainous regions in Southwest China, with their geological and climatic variations, has led to intricate changes in landscapes and waterways, resulting in the isolation and independent evolution of aquatic species [2]. The gene flow between geographically or ecologically isolated populations is often highly restricted. Unique adaptive genetic characteristics may occur in isolated populations exposed to different food, landscape and hydrological conditions. The Shaluli Mountains, situated between the Jinsha River and the Yalong River in the southeastern Tibetan Plateau, constitute the largest mountain range in the Hengduan Mountains region. Formed as part of the uplift of the Tibetan Plateau, the Shaluli Mountains have played a key role in past glacial events in the southeastern plateau and continue to play a crucial role in the origin and differentiation of fish species within the Jinsha River Basin [3, 4].
Fish possess strong environmental adaptability, enabling them to respond rapidly to environmental changes. Through adaptive evolutionary processes, they can ultimately evolve into new species. Compared with other vertebrates, the geographical distribution of fish is more tightly linked to aquatic environments and is strictly constrained by river system structures. Furthermore, the population structure and genetic differentiation of fish are more susceptible to the influence of geological events. The genus Ptychobarbus comprises specialized-grade Schizothorax fish whose evolutionary history is closely tied to the uplift of the Tibetan Plateau, having formed and evolved gradually within this geological context. To date, Ptychobarbus consists of five species, but only P. leptosomus and P. kaznakovi are distributed within the Shaluli Mountains region [5]. P. leptosomus was identified as a new species by Zhang et al. in 2019 and is restricted to the Yalong River system [6], whereas P. kaznakovi is widely distributed in the Jinsha River system [7]. Originating on the Qinghai‒Tibet Plateau (QTP), the Jinsha River flows southeast through mountainous terrain, receiving several major tributaries within western Sichuan; its principal tributary, the Yalong River, drains a parallel basin separated from the main Jinsha channel by the Shaluli Mountains. These two river systems converge in Panzhihua City, Sichuan Province (elevation 980 m). Across the broader Jinsha River basin, P. leptosomus and P. kaznakovi inhabit diverse aquatic environments. Their distribution encompasses both river drainages and plateau lakes, spanning a significant elevational gradient from the Panzhihua confluence up to altitudes between 3,000 and 4,000 m [3]. These two species are morphologically highly similar, with features such as long beards, lower lips, and hypopharyngeal teeth. Therefore, on the basis of their distinct distribution patterns, P. leptosomus and P. kaznakovi are likely excellent case studies for investigating the impact of plateau uplift on the speciation processes of fish distributed across different river systems.
This study employed multivariate morphological methods to comparatively analyze the morphological characteristics of the slender leaf catfish and the naked-bellied leaf catfish. Additionally, to analyze the genetic diversity of geographically distinct populations within P. leptosomus and P. kaznakovi and cover their adaptive characteristics, whole-genome single-nucleotide polymorphism (SNP) markers were screened using genotyping-by-sequencing (GBS) technology. Then, the population structure, population dynamics, and adaptive differentiation were analyzed. By correlating findings with regional geological structures and climate oscillation events, this study addressed the characteristics of adaptive differentiation against the background of plateau uplift. The results provide a solid foundation for the study of the origin of fish diversity in the Shaluli Mountains region.
Materials and methods
Sample collection
From 2022 to 2024, 84 samples of P. kaznakovi were collected from nine sampling sites at the main stream and tributaries of the Tongtian River and Jinsha River, including the Chengduo County section (CD), Zhengda section (ZD), and Enan village section (EN) and the tributaries of the Batang River Yushu section (YS), Zaihuqu Shiqu section (SQ), Sequ Dege section (DG), Zenggqu section (ZQ), Ouqu section (OQ) and Jiangda section (JD) (Fig. 1). Fifty samples of P. leptosomus were collected from five sampling sites in the main stream and tributaries of the Yalong River, including the Yiniu section (YN), Langduo section (LD), Xinlong section (XL), Xiuluohai hydropower station reservoir section (LH) and Niqu kanang village section (NQ), which are tributaries of the Xianshui River. A total of 10 fish samples were collected from the Milin section of the middle reaches of the Yarlung Zangbo River. The collected fish were quickly anesthetized with 0.02% tricaine buffer (80 µg/L) (Sigma, SaintLouis, MO, USA). After morphological measurements were performed, pectoral fin samples (1 cm × 1 cm) were cut and immediately preserved in absolute ethanol, followed by storage at − 20 °C for subsequent DNA extraction. The phenol chloroform extraction method [8] was used to extract genomic DNA. The samples were systematically numbered and stored in the endemic fish herbarium of Sichuan Agricultural University in the upper reaches of the Yangtze River. In addition, a total of 3 fin samples of P. chungtienensis were provided by the Kunming Institute of Zoology, China, and were collected from Bitahai, Shangri La, Yunnan Province (Table 1). All experimental protocols and investigations were reviewed and approved by the Animal Research and Ethics Committee of Sichuan Agricultural University (Approval No. 20220479) and were conducted in strict compliance with the committee’s established guidelines.
Table 1. Data for all samplesSpeciesRiversSample size/sampling siteLongitude and latitudeAltitude (m)Ptychobarbus kaznakoviTongtian River10/Chengduo County(CD)97.16493056 E33.08931111 N3616Batang River10/Yushu City(YS)97.15174106 E33.00119815 N3602Jinsha River10/Zhengda Town(ZD)97.55528894 E32.516666 N3338Zaihu Qu10/Shiqu County(SQ)97.71396784 E32.53220952 N3945Jinsha River10/Enan Village(EN)98.26735628 E32.19837932 N3164Se Qu9/Dege County(DG)98.57926111 E31.69600278 N3105Zeng Qu9/Baiyu County(ZQ)99.0451442 E31.39178508 N3055Ou Qu10/Baiyu County(OQ)98.84391388 E31.17272867 N3035Zang Qu6/Jiangda County(JD)98.58831667 E31.22833132 N2956P. lepteptosomusYalong River10/Yiniu Town(YN)98.307810E33.062918 N3906Yalong River10/Langduo Town(LD)99.051021E32.263964 N3635Yalong River10/Xinlong County(XL)100.271447E31.345688 N3011Xianshui River10/Luhuo County(LH)100.7285847E31.34568754 N3150Ni Qu10/Niba village(NQ)100.2381621E31.6762026 N3210P. dipogonYarlung Zangbo River10/Mili City(ML)94.211372E29.221844 N2976 P. chungtienensis Bitai Hai3/Shangri-la(BTH)99.99148964E27.82047069 N3538E east, N north
Fig. 1. Sampling sites for four Ptychobarbus species. N, Yiniu Town; LD, Langduo Town; XL, Xinlong County; LH, Luhuo County; NQ, Ni Qu; CD, Chengduo County; YS, Yushu City; ZD, Zhengda Town; SQ, Shiqu County; EN, Enan Village; DG, Dege County; ZQ, Zang Qu; OQ, Ou Qu; JD, Jiangda County; ML, Milin; Shangri-la, BTH. The red arrow presented the direction of gene flow from BTH to ML
Morphological analysis
In this study, a combined method of framework-based morphometric distance and traditional morphological indexes was employed to compare and analyze the morphological characteristics of P. kaznakovi (n = 45) and P. leptosomus (n = 45) systematically (Table S1 and Figure S1). The framework data were measured using Digimizer software with a precision of 0.01 mm.
The countable traits included the pattern of pharyngeal teeth, gill rakers on the first gill arch, pectoral fins, pelvic fins, branched rays of dorsal and anal fins, lateral line scales, scales above and below the lateral line, and the number of intestinal folds. For measurable traits, individual indicators that could not be measured due to sample issues were treated as missing values. Prior to analysis, data preprocessing was conducted. First, all the morphological data were log-transformed to conform to a normal distribution. The transformed data were subsequently tested for normality using independent sample t tests. Afterward, cluster analysis was performed on the data. To avoid interference from differences in body size among groups in the morphological analysis results, all framework measurement data, except for standard length, were normalized by dividing them by the standard length. To distinguish morphological variations among different groups more effectively, principal component analysis (PCA) was conducted using Origin 24.0 software on the basis of standardized multivariate morphometric data for P. kaznakovi and P. leptosomus.
Library construction
After the quality of extracted sample DNA was verified, super GBS sequencing technology was used to construct the sequencing library [9]. In summary, PstI HF/MspI was used for DNA digestion, and T4 ligase was utilized at both ends of the digested fragment to add connectors and barcodes. Then, 300–700 bp fragments were recovered by adjusting the volume ratio of magnetic bead solution to the linked product. The recovered fragments were amplified by PCR with high-fidelity enzymes. Furthermore, the concentration of the PCR product was determined using a Qubit fluorometer and was required to exceed 5 ng/µL. The mixed library was sequenced on an Illumina Nova instrument (PE150).
Sequencing and SNP calling
High-throughput sequencing was performed using the Illumina HiSeq PE150 sequencing platform. Stack software was used to split the offline data according to barcode and enzyme digestion site information to obtain raw reads for each sample [10]. Fastp software further filtered the quality of the raw reads and obtained the clean reads [11]. BWA software was used to compare the quality-controlled clean reads with the reference genome to assess the similarity between the sample and the reference genome [12]. The depth information of sample sequencing was obtained, and the coverage of sequencing data relative to the reference genome was calculated. The reference genome and its annotation information were provided by Xiao et al. [13]. The insert size distribution of each sample was qualitatively determined [14]. In accordance with the comparison results between the sample genome and the reference genome, the haplotypecaller module in Gatk4 software [15, 16] was used for single-nucleotide polymorphism (SNP, only high-quality biallelic SNPs) and insertion/deletion (indel) detection. VCFtools [16] was used to perform further filtering as follows: (1) the sites with a support depth of no less than 4 were retained; (2) the loci with a minimum allele frequency (MAF) lower than 0.01 were deleted; and (3) at least 80% of the samples could be successfully typed.
Analysis of population genetic diversity
The relevant indicators of genetic diversity [16], including polymorphism information content (PIC), observed heterozygosity (Ho), expected heterozygosity (He) and nucleotide diversity (Pi), were calculated using VCFtools. The genetic differentiation index (Fst) and genetic distance (DR) between different populations were calculated using Arlequin 3.5.1.3 [17].
Analysis of population genetic structure
The phylogenetic tree was constructed using the neighbor‒joining (NJ) method [18]. The distance matrix was calculated using Treebest software [19]. To evaluate the reliability of the evolutionary tree, and the number of repetitions was set to 1000 [20]. PCA was performed on the obtained SNP markers using Plink2 software [21] to extract the first two feature vectors with the greatest impact. The analysis of population structure was performed using Admixture v1.3.0 software [22]. The range of the K value was set to 1‒10. The optimal number of clusters was determined by minimizing the cross-validation error (CV error).
Analysis of population historical dynamics and gene flow
The smc + + v0.6.5 [23] software was used to analyze the population dynamic history, which can be used to calculate the change trend of the effective population size (Ne) in the time dimension. The generation time was 6 [24], and the mutation rate was 4e-9. The software TreeMix v1.12 [25] was used to analyze population gene exchange.
Analysis of genome‒environment associations and selective sweep regions
The 19 climate data sets were downloaded from WorldClim (https://www.worldclim.org/data/world clim21.html), and the Spearman correlation coefficient was subsequently calculated among those factors. If the correlation coefficient between two variables was greater than 0.8, one of them was removed [26]. This study used redundancy analysis (RDA) for environmental correlation analysis, which was executed using the rda function in the VEGAN software package (version 2.5) [14, 26, 27].
The Fst and Pi values between populations were used for selective elimination analysis [28, 29]. VCFtools software [16] slid the interval (the parameter is– maf 0.05 --max-missing 0.8 --min-alleles 2 --max-alleles 2 --window- Pi 10000 --window- Pi -step 5000). The Pi values of the two species were determined. VCFtools software [16] slid the interval (the parameter is– maf 0.05 --max-missing 0.8 --min-alleles 2 --max-alleles 2 -- Fst t-window-size 10000 -- Fst -window-step 500). The Fst values between the two populations were determined. Finally, the common interval of Pi and Fst was integrated.
For functional enrichment analysis, all selected sites were mapped to terms in the GO (Gene Ontology) and KEGG (Kyoto Encyclopedia of Genes and Genomes) databases [30, 31]. By setting p < 0.05 as the significance threshold, the significantly enriched GO terms and KEGG pathways were identified.
Results
Analysis of the main external characteristics
P. leptosomus has a bluish-gray color on its sides and back, with fewer spots that are mostly concentrated on the caudal fin, and the ventral side is silvery white (Fig. 2A). P. kaznakovi has a dark brownish-black color on its sides and back, with dense and irregular small spots distributed across the body; its ventral side is also silvery white (Fig. 2B). The fins are grayish yellow, with numerous spots on the dorsal and caudal fins, whereas the other fins have fewer spots.
Comparative observation of P. kaznakovi and P. leptosomus revealed that the lower lip structure of P. leptosomus has three characteristics: the left and right lobes are not in contact, there is a small middle lobe, and the left and right lobes are thick and not in contact with each other (Fig. 2C, D and E). P. kaznakovi subsequently developed, and the lower lip divided into two lobes, which are in contact at the front (Fig. 2F). This type of lower lip feature was observed in P. chungtienensis from the Jinsha River Basin (Fig. 2G) [6]. However, there was no difference in body length or sex (male or female) among all the samples observed.
Fig. 2. External morphological characteristics of Ptychobarbus leptosomus (A) and* P. kaznakovi* (B) and the lower lip features of P. leptosomus, P. kaznakovi, and P. chungtienensis. Three types of lower lip features in P. leptosomus (C, D, E); lower lip features in P. kaznakovi. (F); and lower lip features in P. chungtienensis from Jinsha River Basin (G) [6]. The lowercase letters in the fish mouth pictures correspond to uppercase letters in the figure legend
Analysis of countable traits
The numbers of gill rakes outside the first gill arch of P. kaznakovi and P. leptosomus are 11 ~ 15 and 14 ~ 17, respectively. There were ranges overlap in the number of gill rakes outside the first gill arch between P. kaznakovi and P. leptosomus. However, there was no significant difference in the number of gill rakes, teeth, dorsal fins, pectoral fins, abdominal fins, anal fin branches, lateral line scales, lateral line upper/lower scales, or intestinal bends on the inner side of the first branchial arch (Table 2).
Table 2. Statistics of countable traits of Ptychobarbus Kaznakovi and P. leptosomusCountable traitsPtychobarbus kaznakoviP. leptosomusNumber of gill rakes outside the first branchial arch11 ~ 1514 ~ 17Number of gill rakes inside the first gill arch16 ~ 1916 ~ 20Toothed type2 lines, 3.4–4.32 lines, 3.4–4.3Dorsal fin branching fin88Branching fin of pectoral fin17 ~ 1917 ~ 19Ventral fin branching fin8 ~ 108 ~ 9Breech fin branching fin55Number of lateral scales94–12291–122Number of scales on side line18–2620–30Number of scales under side line14–2016–23Number of bowels22
Cluster analysis of the morphological indexes
PCA of traditional quantifiable traits
The measurable traits are presented in Table S2. P. leptosomus has an elongated body, with a body length that is 4.01‒5.70 times the body height and 6.13‒7.74 times the caudal peduncle length. In contrast, P. kaznakovi has a body length that is 4.34‒5.53 times the body height and 5.98‒7.62 times the caudal peduncle length, which is consistent with the morphological description of P. leptosomus by a previous study [6]. PCA was used to analyze the proportional traits of P. kaznakovi and P. leptosomus. Four principal components were obtained, and the results of the variable contribution rates indicate that when the number of extracted principal components reaches four, the eigenvalues begin to show no significant changes. Therefore, four main principal components of the proportional trait data were identified, with eigenvalues of 2.144, 1.740, 1.215, and 0.735. The cumulative contribution rate of the four principal components was 83.37%. The principal component loading plot (Fig. 3A) and the scatter distribution plot (Fig. 3B) show that PC1 and PC2 together explain 55.5% of the total variation (PC1 = 30.6%, PC2 = 24.9%). PC1 is driven mainly by the proportional traits of the tail and head; positive indicators such as body length/caudal peduncle length and head length/orbital diameter reveal the slender tail characteristics of P. leptosomus. PC2 is centered on body length/body height, indicating the elongated body shape of P. leptosomus. The results suggest that the two species, P. kaznakovi and P. leptosomus, do not significantly differ in measurable traits. Most individuals are relatively concentrated with overlapping traits. The distribution of traits in P. kaznakovi is relatively more concentrated.
Fig. 3PCA of traditional morphological data and multivariate morphological data of Ptychobarbus kaznakovi and P. leptosomus. A, principal component loading diagram of traditional morphological data; B, distribution map of the scattered points of the main components of traditional morphological data; C, principal component loading diagram of multivariate morphological data; D, distribution map of the scattered points of the main components of multivariate morphological data. PK, P. kaznakovi; PL, P. leptosomus; PC, principal component
PCA of multivariate morphological data
After PCA was conducted using the multivariate morphological data of P. kaznakovi and P. leptosomus, a total of 34 principal components were obtained. An analysis of the variable contribution rates and the scree plot revealed that the eigenvalues did not significantly change after the ninth principal component was extracted. Therefore, there were nine main principal components for the morphometric traits for both species, with eigenvalues of 7.944, 5.258, 3.350, 2.707, 2.025, 1.831, 1.485, 1.176, and 1.017. The cumulative contribution rate of these nine principal components was 87.652%.
The principal component loading plot (Fig. 3C) and scatter plot (Fig. 3D) based on the multivariate morphological data revealed that in the first principal component, indicators such as the distance from the snout tip to the pectoral fin base (D3) and the distance from the post-occipital region to the pelvic fin base (D10) had higher loadings, mainly reflecting the characteristics of the trunk. In the second principal component, indicators such as the length of the caudal peduncle (D35) and the height of the caudal peduncle (D36) had higher loadings, mainly reflecting the characteristics of the tail. P. kaznakovi and P. leptosomus presented a partially overlapping distribution pattern.
Sequencing quality
A total of 63 Ptychobarbus samples were sequenced by GBS, yielding 424.68 Gb of raw data. After filtering, 384.52 Gb of clean data were obtained. The sequencing quality was high, with a Q20 > 96.50% and a Q30 > 90.89%. A total of 9,695,559 raw SNPs were called, and 2,070,747 high-quality SNPs were detected after filtering.
Phylogenetic analysis and population genetic diversity
The NJ phylogenetic tree was constructed on the basis of the simplified genome data of P. dipogon, P. leptosomus and P. chungtienensis combined with the resequencing data of P. kaznakovi obtained from our research team (Fig. 4). The results revealed that 147 samples could be divided into three branches, and P. dipogon were located at the outermost side of the phylogenetic tree. P. kaznakovi and P. chungtienensis formed a sister group and clustered into one branch, whereas P. leptosomus clustered separately.
The genetic diversity index (Table 3) was calculated according to the simplified genomic SNPs. The Ho, He, Pi and PIC of P. leptosomus were greater than those of P. kaznakovi, P. chungtienensis and P. dipogon. The results revealed that the diversity of P. leptosomus was relatively high; additionally, the genetic information was relatively abundant. The observed heterozygosity (Ho) was greater than the expected heterozygosity (He).
Fig. 4. Neighbor-joining evolutionary tree of 147 individuals of Ptychobarbus leptosomus,* P. kaznakovi*, P. chungtienensis, and P. dipogon. PL, Ptychobarbus leptosomus, pink color; PK, P. kaznakovi, blue color; PCH, P. chungtienensis, orange color; PD, P. dipogon, green color. YN, Yiniu Town; LD, Langduo Town; XL, Xinlong County; LH, Luhuo County; NQ, Ni Qu. CD, Chengduo County; YS, Yushu City; ZD, Zhengda Town; SQ, Shiqu County; EN, Enan Village; DG, Dege County; ZQ, Zang Qu; OQ, Ou Qu; JD, Jiangda County; ML, Milin
Table 3. Genetic diversity parameters among Ptychobarbus leptosomus,* P. kaznakovi*,* P. chungtienensis* and P. dipogonPopulationH_o_H_e_PiPICPL0.43180.28700.28830.2428PK0.40490.27340.28300.2254PCH0.23310.14460.18020.1128PD0.28120.18740.20060.1477He, expected heterozygosity; Ho, observed heterozygosity; PIC polymorphism information content, Pi nucleotide diversity, PL P. leptosomus, PK P. kaznakovi, PCH P. chungtienensis, PD P. dipogon
Population diversity and genetic divergence
On the basis of the analysis of population genetic structure, we observed the distribution of genetic structure under different K values (the K value represents the number of assumed ancestors) (Fig. 5A and B). The results showed that when K = 3, the analysis results were the most suitable as the basis for grouping. The four species of Ptychobarbus were divided into three groups at the level of population genetic structure analysis, which indicates that P. kaznakovi and P. chungtienensis may have originated from the same ancestral group. With increasing K content, P. leptosomus differentiated earlier and formed independent genetic components, indicating that there were significant genetic differences between the geographical populations of P. kaznakovi and P. leptosomus.
To further analyze the population genetic structure characteristics of the two species, we used PCA to reveal the relationships among those populations. The PCA results revealed that PC2 explained 12.21% of the variation and PC3 explained 7.34% of the variation (Fig. 5C). This result suggests that the samples of different species of Ptychobarbus present certain distribution characteristics in the principal component space composed of PC2 and PC3. Cluster analysis of the P. kaznakovi and P. chungtienensis samples and the P. dipogon and P. leptosomus samples presented geographically nonoverlapping ranges. Phylogenetic analyses confirmed that P. leptosomus, P. kaznakovi, P. chungtienensis, and P. dipogon constitute distinct species clusters.
Fig. 5. Population structure analysis for Ptychobarbus leptosomus, P. kaznakovi, P. chungtienensis, and P. dipogon. A, population structure from K = 1 to K = 10; B, error rates for the K values of the four Ptychobarbus fish admixtures by cross-validation; C, principal component analysis for the four Ptychobarbus fish. PL, P. leptosomus; PK, P. kaznakovi; PCH, P. chungtienensis; PD, P. dipogon. YN, Yiniu Town; LD, Langduo Town; XL, Xinlong County; LH, Luhuo County; NQ, Ni Qu. CD, Chengduo County; YS, Yushu City; ZD, Zhengda Town; SQ, Shiqu County; EN, Enan Village; DG, Dege County; ZQ, Zang Qu; OQ, Ou Qu; JD, Jiangda County; ML, Milin. PC, principal component
Historical population dynamics of P. leptosomus and P. kaznakovi
According to the analysis of historical population dynamics (Fig. 6A), the populations of P. leptosomus and P. kaznakovi experienced relatively similar population contractions and expansions. At approximately 10.0 Ma, the Ne values of the two fish species sharply decreased. The effective population sizes of four species subsequently remained relatively stable over approximately 6.0–1.0 Ma. However, at approximately 0.8–0.2 Ma, the effective population sizes of the PL and PK decreased again and then stabilized at approximately 1.5–0.5 Ka. Otherwise, the population sizes of PC and PD experienced a brief decline between 0.1 and 1 Ma, but began to increase after 1 Ma, and stabilized around 0.5 Ka. This dramatic change in the effective size of the recent population may imply that some recent ecological or environmental factors significantly impacted these two species.
Fig. 6. Analysis of historical population dynamics, gene flow, and environmental adaptability and genetic variation of four species in Ptychobarbus. A, estimation of historical effective population size; B, flow analysis; C, RDA of genetic variation and environmental variables. PL, P. leptosomus; PK, P. kaznakovi; PC,* P. chungtienensis*; PD, P. dipogon. Bio2, diurnal range; Bio3, isothermality; Bio12, annual precipitation; Bio13, precipitation of wettest month; Bio14, precipitation of driest month; Bio15, precipitation seasonality and altitude.
Gene flow
To clarify the direction of gene flow among the four species, we used TreeMix analysis to construct an ML tree (Fig. 6B). In the presence of gene flow, the four species exhibited lineage differentiation and simulated a migration event on different branches. The gene flow from P. kaznakovi and P. chungtienensis branches to P. dipogon is more obvious. In general, the results of the gene flow analysis were consistent with results from principal component analysis and population genetic structure analysis.
Environmental adaptability and genetic variation
Among the whole-genome SNPs distributed across 13 populations of P. leptosomus and P. kaznakovi, 35,654 were associated with the environmental factors Bio2 (average daily range), Bio3 (isothermal), Bio4 (seasonal temperature), Bio12 (annual precipitation), Bio13 (precipitation in the wettest month), Bio14 (precipitation in the driest month) and Bio15 (seasonal precipitation). The variance interpretation rates of the first two factors, rda1 and rda2, in the RDA were 17.14% and 4.77%, respectively, and Bio15 contributed the most to the genetic variation of the two species (Fig. 6C). The arrow of the Bio14 environmental factors pointed roughly from left to right, which also had a significant impact on the distribution of species and might be one of the important factors leading to the distribution difference between the two species in the horizontal direction.
Genes experiencing selective sweeps in P. leptosomus and P. kaznakovi
The Pi ratio and Fst information of the two populations were integrated. A window with a small or large Pi ratio and a large Fst value as the selection clearing area (the threshold is set to 5% this time) was selected and annotated. Through comparative analysis of P. leptosomus and P. kaznakovi, the selective sweep regions were identified, and GO and KEGG enrichment analyses were conducted for the candidate genes on the basis of SNP sites in these regions. The clearly selected regions shared by the two species were defined by pipk/pipl ≥ 2.43 and Fst ≥ 0.38. GO enrichment analysis revealed that the selected genes were annotated with 227 terms, 139, 38 and 50 of which belonged to the biological process, cellular component and molecular function subgroups, respectively. The biological process category was related mainly to protein localization to chromatin, cell redox homeostasis and pre-miRNA processing. The GO enrichment of the cell component categories was related mainly to the INO80 complex and ATPase complex. The enriched molecular functions were related mainly to ADP binding, ATP hydrolase activity, DNA helicase activity and other energy metabolism pathways (Fig. 7A). KEGG enrichment analysis (Fig. 7B and C) revealed that these genes (such as gldc, glycine decarboxylase; cyp51,* igf-1*, and tnf-α) were involved mainly in glycine, serine and threonine metabolism; glycan biosynthesis and metabolism; growth hormone synthesis, secretion and action; the TNF signaling pathway; and other related pathways.
Fig. 7GO and KEGG enrichment analyses of genes experiencing selective sweeps. A, the top 30 GO pathways significantly enriched in Ptychobarbus kaznakovi and P. leptosomus; B, the top 30 KEGG pathways significantly enriched; C, comparative analysis of KEGG level 2 pathway distributions between differentially expressed genes
Discussion
Cluster analysis of the morphological indexes
For many years, the classification of Ptychobarbus fish has been a contentious issue among taxonomists, especially regarding the species P. leptosomus, P. kaznakovi and P. chungtienensis. Zhang et al. described P. leptosomus on the basis of a single dissected specimen and noted that it is morphologically very similar to P. chungtienensis. However, they argued that it is a distinct and valid species separate from both P. kaznakovi and P. chungtienensis and identified it as a new species [6]. In 2020, Guo et al., in the “Atlas of Fishes of Sichuan”, suggested that P. leptosomus should be considered a synonym for P. chungtienensis [32].
This study compared the body color and lower lip characteristics of P. leptosomus and P. kaznakovi. The lower lip of P. kaznakovi is well developed and is divided into two lobes, with connection between the anterior parts of the two lateral lobes. In contrast, the lower lip of P. leptosomus exhibits different structural features, including two separate left and right lobes, a small middle lobe, and the left and right lobes are thick and not in contact with each other. These characteristics are consistent with the description of the lower lip morphology of 11 specimens of P. chungtienensis by Guo et al. [112]. Additionally, Chen et al. reported that the lower lip structure of P. kaznakovi also includes the above three morphological features. However, after 45 specimens of P. kaznakovi were observed in this study, it was found that their lower lip structure did not exhibit those three morphological features. Moreover, the analysis of countable traits revealed differences in the number of gill rakers on the outer side of the first gill arch between P. kaznakovi (11‒15) and P. leptosomus (14‒17). This differs from the results obtained by Guo et al., who reported that the number of gill rakers on the outer side of the first gill arch of P. chungtienensis was 13‒14 [32]. In summary, by comparing P. kaznakovi and P. leptosomus, this study revealed significant morphological differences between the two species and highlighted the similarities and differences compared with previous research findings, providing important morphological evidence for further distinguishing these two fish species.
The analysis of measurable traits revealed that P. leptosomus has an elongated body, with a body length that is 4.01‒5.70 times the body height and 6.13‒7.74 times the caudal peduncle length. P. kaznakovi has a body length that is 4.34‒6.53 times the body height and 5.98‒7.62 times the caudal peduncle length. These findings overlap with previous morphological descriptions. For instance, Zhang et al. [6] reported one P. leptosomus (body length/height = 5.94; body length/caudal peduncle length = 7.12) and 12 P. kaznakovi (4.2‒5.9; 6.0‒7.5). Guo et al. [32] described 11 P. leptosomus (4.61‒5.05; 5.68‒7.12) and 12 P. kaznakovi (4.90‒5.59; 4.85‒5.38), and Chen et al. [33] described 15 P. kaznakovi (4.30‒5.50; 6.00‒7.30). Ding et al. [34] described two samples of P. kaznakovi (5.20–5.30; 6.10–6.20), and Wu et al. [7] described 75 P. kaznakovi (4.39‒6.88; 5.16‒6.89) and 20 P. chungtienensis (body length/height = 4.42‒7.35; body length/caudal peduncle length = 5.71‒7.35) that were found in only specific locations in Yunnan Province, such as Napahai, Bitahai, and Xiao Zhongdian. These data overlap with previous findings, indicating that the ratios of body length to body height and caudal peduncle length are somewhat similar between the two fish species but also differ. For example, the range of the body length/body height ratio for P. kaznakovi across different studies is 4.2‒6.9, and the range of the body length/caudal peduncle length ratio is 5.0‒7.9. For P. leptosomus, the range of the body length/body height ratio is 4.6‒7.4, and the range of the body length/caudal peduncle length ratio is 5.7‒7.8. These differences may be related to factors such as sample size, geographical distribution, and individual age. The overlap and minor differences in measurable traits between P. leptosomus and P. kaznakovi may be closely related to their living environments and ecological habits. The slender body of P. leptosomus is suitable for rapid swimming, whereas the more diverse body shape of P. kaznakovi may be adapted to a wider range of ecological environments.
The multivariate morphological analysis revealed that the PCA based on 34 framework measurements yielded nine principal components with a cumulative contribution rate of 88.74%, which is higher than that of the traditional measurement traits (83.37%). The principal component results indicated that the samples of P. leptosomus and P. kaznakovi largely overlapped and could not be completely separated. The reason may be that the P. leptosomus and P. kaznakovi populations are geographically close, and the environmental and climatic conditions are similar, resulting in similar selective pressures. The morphological characteristics of fish are the result of their evolutionary adaptation to the environment. A typical example is the Mexican cavefish (Astyanax mexicanus), which has evolved several features related to cave life in response to food scarcity and the darkness of its environment; these traits include reduced pigmentation, smaller eye size, enlarged nonvisual sensory organs, increased body fatness, and reduced sleep duration [35]. A previous study revealed that the morphological differences between Xenophysogobio boulengeri and X. nudicorpa are related primarily to eye diameter, fin length, and barbel length [36]. Similarly, the long-finned snailfish (Rhinogobio ventralis) shows evolutionary adaptations to different water flow environments through features such as a robust caudal peduncle, smaller eye diameter, and shorter snout [37]. Therefore, the differences in caudal peduncle and fin length between P. leptosomus and P. kaznakovi are not significant, which may be due to the similar geographical environments they inhabit.
Characteristics of species differentiation and gene flow in P. leptosomus and P. kaznakovi
Orogeny since the Cenozoic Era and its accompanying environmental changes have shaped a broad and complex geomorphic pattern throughout the QTP [38–40]. In the Hengduan Mountains region, high mountains and deep valleys alternate within a very short straight-line distance, making it an “ecological island” isolated from the surrounding lower regions [41, 42]. Within the vast geographical range of the QTP, many endemic species with close relationships are distributed in diverse habitats along altitudinal gradients and with spatial heterogeneity [43, 44]. Therefore, strong geographical isolation has long been considered the main driving force of species differentiation in the region [45–48]. However, due to the extremely high habitat diversity in the region, ecological selection may play an important role by promoting reproductive isolation and potential “neighborhood species formation“ [49].
In this study, the PCA results revealed that P. kaznakovi, P. leptosomus and P. dipogon formed distinct clusters but that P. chungtienensis and P. kaznakovi clustered together. Through an analysis of genetic structure, it was found that when K = 3, there were three populations at the level of population genetic structure analysis. Among them, P. chungtienensis and P. kaznakovi were clustered, which was consistent with the PCA results. This phenomenon of population differentiation is influenced mainly by ancient climate fluctuations and changes in river systems. These factors hinder gene flow between populations, resulting in the differentiation of a single population into two or several populations. This phenomenon has also been reported in other freshwater fish [50, 51]. Spatial heterogeneity causes disproportionate selection pressure generated by heterogeneous habitats to become the main driving force of adaptive species formation by weakening gene flow [52, 53]. These findings not only reveal the primary mechanisms of population differentiation in leaf whisker catfish but also provide an important reference for understanding the speciation and evolution of other freshwater fish species.
TreeMix analysis revealed that gene exchange among P. chungtienensis, P. kaznakovi and P. leptosomus was weak. Introgression hybridization between different lineages may play an important role in the differentiation of Schizothorax species. Due to large-scale river restructuring and river seizing events triggered by the uplift of the QTP, Schizothorax has experienced many complex gene penetration events [54–56]. Located between the Jinsha River and the Yalong River in the southeast of the QTP, the Shaluli Mountains are the largest mountain range in the Hengduan Mountains. With the uplift of the QTP, the altitude continues to rise, which is an important factor affecting the adaptive differentiation of species in the southeastern QTP [3, 4]. The geological barrier between the Jinsha River and Yalong River water systems (the uplift of the Shaluli Mountains) played a key role in differentiating between the populations of P. kaznakovi and P. leptosomus distributed on both sides of the Shaluli Mountains. This phenomenon has also been reported in Ligularia tongolensis [57], Cyananthus delavayi [58], Batrachuperus pinchonii [59], Nivivanter superior [60], Tetraophasis obscurus and Schizopygopsis malacanthus [61]. The above studies indicate that topographic changes in these regions (such as the uplift of the QTP and the Shaluli Mountains) caused intraspecific and interspecific differentiation through allochthonous differentiation [57, 58, 62] and led to fish migration and introgressive hybridization between lineages, which indicates that the fish in these areas have responded to climate oscillations and geological events. Although the distribution range of P. leptosomus was limited, the species presented greater nucleotide diversity than P. kaznakovi, P. chungtienensis or P. dipogon. This high nucleotide diversity enables P. leptosomus to persist in its narrow distribution range and enhances its adaptability to the environments of the high mountains and valleys of the Shaluli Mountains. In conclusion, the geological activities of the Tibetan Plateau and its surrounding mountain ranges (such as the Shaluli Mountains), including uplift, reorganization of river systems, and river capture, have played crucial roles in the speciation and adaptive evolution of schizothoracine fishes.
Historical dynamics of the populations of P. leptosomus and P. kaznakovi
Plateau fish originated and evolved with the uplift of the plateau, and their distribution in various river systems is the result of the headwater capture of these river systems [63]. Most studies indicate that climate oscillations and geological events are important factors affecting the geographical distribution patterns and genetic differentiation of species on the QTP [64–66]. The climatic oscillations since the late Pliocene are believed to have promoted the speciation of polyploids, including allopolyploids and autopolyploids, in plants from the QTP. Moreover, polyploids are common not only in plants but also in fish on the QTP [67]. The uplift of the QTP facilitated the widespread dispersal and diversification of the diploid ancestors of Schizothorax fish. Subsequently, the climatic and environmental changes during the Pliocene–Pleistocene enabled the diploid ancestors of Schizothorax fish to adapt through autopolyploidization. With the ongoing climatic and environmental changes in the Pliocene–Pleistocene, polyploid Schizothorax fish gradually replaced their diploid ancestors, further driving the diversification of Schizothorax fish in the surrounding regions of the QTP [68, 69]. After a long period of evolution, these isolated populations may evolve into new subspecies or even new species.
This study provides an in-depth analysis of the associations between the historical population dynamics of P. kaznakovi and P. leptosomus and regional geological events. On the basis of the results of historical population dynamics, we observed that the two species experienced similar population contraction and expansion patterns. During the late stage of the second uplift of the QTP (10.0–4.0 Ma), climate change caused by the monsoon cycle led to rapid global cooling [70]. Concurrently, the effective population sizes of P. kaznakovi and P. leptosomus decreased sharply during this period. The Ne values of the two species subsequently remained relatively stable during the period of approximately 5.0–1.0 Ma, indicating that the populations may have experienced a period of adaptation or equilibrium. The Shaluli Mountain region [68] has experienced several periods of significant uplift since the Quaternary, of which the earliest glaciation occurred at approximately 0.6–0.5 Ma. Additionally, the Jinsha River and Yalong River tributaries strongly cut down the middle of the mountain, forming the initial canyon landform [71]. The effective population sizes of PK and PL showed a downward trend again (0.8–0.2 Ma). It is speculated that the historical dynamics of the populations of PK and PL are likely affected by the Shaluli Mountain ice age. The Ne values of the two species tended to be stable at approximately 1.5–0.5 Ka. The planation surface formed in the late Tertiary of the Shaluli Mountains disintegrated from the end of the Pliocene to the early Quaternary, and rift basins [4] appeared in some areas of the planation surface, which received fluvial lacustrine deposits. The plateau subsequently experienced continuous pulsating uplift, accompanied by tectonic faulting and the extension and cutting of several major tributaries of the Jinsha River and Yalong River, forming several faulted river valleys and earlier terraces. The above results show that tectonic events in the Shaluli Mountains and Quaternary climate oscillation have important impacts on the current distribution patterns of P. kaznakovi and P. leptosomus in the study area. Due to the uplift of the Shaluli Mountains, the ancestral population was dispersed between the Jinsha River and the Yalong River, resulting in a lack of connection between the phylogenetic structure and the water system. After this differentiation, the regional population was limited by geographical barriers and the species’ preference for high-altitude environments. The Shaluli Mountain area may have undergone four major glacial events, and experienced a significant uplift after the earliest glacial event (5.71 ka BP). Then, during the early and late periods of MIS3 (approximately 60–37.8 ka BP), the summer monsoon with abundant precipitati and high temperature was strong, and the water and heat balance conditions were conducive to the development of glaciers. In the middle period of MIS3, the temperature was lower, the summer monsoon was stronger, and the precipitation was more abundant. This cold and humid climate condition was favorable for the development of glaciers [72]. As the Quaternary period progressed into its later stages, it was accompanied by the accumulation of loess, especially in the northern Yalong River valley [73]. It can be inferred that the above factors may affect the extent of population contraction between the PK (Jinsha River) and PL (Yalong River) populations in this period. Though PL and PD, PC and PK were clustered in the same branch, respectively. However, PL and PK had the different patterns of historical dynamics after about 0.1 Ma. It may be due to the above factors. Thus, a long-term independent evolutionary history in the subsequent climate oscillation was experienced, and most of the population experienced expansion and bottleneck events during the climate oscillation. A previous study reported that S. malacanthus distributed in this flora also experienced similar expansion and bottleneck events [68]. Therefore, the uplift of mountains and the erosion of glaciers may lead to the isolation and fragmentation of habitats and subsequently affect the gene flow and genetic diversity of P. kaznakovi and P. leptosomus populations.
Characteristics of the environmental adaptability of P. leptosomus and P. kaznakovi
Due to differences in ecological environments, populations may experience selective pressures from specific environmental factors, leading to selective sweeps at key genetic loci, thus driving population differentiation [74, 75]. Subsequently, dominant mutations may be retained through selection, leading to their proliferation and expansion, which in turn continuously promotes genetic differentiation within populations. This is a common phenomenon in closely related species that are distributed adjacently but occupy different ecological niches [76, 77]. Understanding the genetic basis of plateau fish helps us understand their environmental adaptability [78–80].
In this study, selective elimination analysis was used to explore the genomic adaptation characteristics of P. kaznakovi and P. leptosomus. The results of GO and KEGG enrichment analyses revealed that the genes significantly enriched in genomic regions under selection for the two fish species were related to disease, the immune system and environmental adaptation (P < 0.05). The highly enriched GO terms included protein localization on chromosomes, ATPase complex, DNA helicase activity and ATP hydrolase activity, indicating key roles in gene expression regulation, DNA replication and repair, energy metabolism and other processes. These results suggest that the selective sweep of genes in the region may play a key role in the metabolic adaptability and physiological function of P. kaznakovi and P. leptosomus. In extreme plateau environments, both low temperature and ultraviolet radiation can cause DNA damage [81–85]. DNA repair is essential for maintaining the integrity and stability of the genome, which ensures the accurate transmission of genetic information and the normal function of cells. In studies of other plateau fishes, such as S. malacanthus and S. pylzovi, GO enrichment analysis revealed that the positively selected genes were related primarily to DNA repair. The positive selection of these genes helps them adapt to high-altitude areas and strong ultraviolet radiation [86]. The selected sites in S. oconnori are associated mainly with amino acid metabolism, the Fanconi anemia pathway and other pathways related to DNA repair and energy metabolism [87]. Homologous recombination and p53 signaling pathways were identified in Trilophysa bleekeri as forming an integrated DNA repair mechanism to cope with the extreme environment of the plateau [88]. In summary, both selective sweep analysis and functional enrichment revealed multiple key genes related to metabolic adaptation, physiological function, and DNA repair in the genomes of P. kaznakovi and P. leptosomus. Their adaptive characteristics are consistent with the DNA repair mechanisms of other plateau fish species in response to extreme environments such as low temperature and intense ultraviolet radiation. This research provides important evidence for elucidating the molecular evolutionary mechanisms of environmental adaptation in plateau fish species.
Fish usually adapt to abiotic conditions, such as temperature, through positive selection, which leaves signatures of selective sweeps in genes associated with the selected genes [89]. Plateau fish exhibit significant adaptive evolutionary characteristics in terms of energy metabolism in environments with low water temperatures and large diurnal temperature variations. Study has shown that, compared with the model organism zebrafish (Danio rerio), Gymnodiptychus pachycheilus evolves at a faster rate, with selected genes significantly enriched in energy metabolism-related pathways [90]. Compared with those of Ctenopharyngodon idella and other low-altitude fishes, the dN/dS ratio of Schizothorax fish was significantly greater. Additionally, multiple GO terms related to plateau adaptation, such as energy metabolism, also showed significantly increased evolutionary rates. These findings indicate that plateau fish have undergone a rapid evolutionary process in adapting to the plateau environment [91]. For example, Glyptosternum maculatum inhabits high altitudes and exhibits more selected genes that are related mainly to the hypoxia response and energy metabolism [92]. The selected genes of S. oconnori were enriched in amino acid metabolism, glucose metabolism, lipid metabolism and other pathways [87]. The Triplophysa fish presented results similar to those of Schizothorax, and the genes with positive selection and rapid evolution signs were also significantly enriched in the energy metabolism category [93]. Therefore, plateau fish species retain adaptive signatures in their genomes through positive selection and selective sweeps, and the selected genes are generally enriched in pathways closely related to environmental adaptation, such as energy metabolism, carbohydrate metabolism, and amino acid metabolism. This study further revealed that the selected genes in P. kaznakovi and P. leptosomus are enriched in carbohydrate metabolism, growth hormone synthesis and secretion, and the conserved Wnt signaling pathway. These findings suggest that these pathways may be the key molecular mechanisms by which these two species adapt to different aquatic environments on plateaus, providing a new perspective for understanding the ecological adaptive evolution of plateau fish species.
In this study, we found that the selected genes of the two fishes were enriched mainly in amino acid metabolism, glucose metabolism, growth hormone synthesis and secretion. Glucose metabolism is one of the key mechanisms by which the body obtains energy. Its main function is to maintain stable blood glucose concentrations, which are essential for the survival of aquatic organisms such as fish. Through the effective regulation of glucose metabolism, the body can ensure that the blood glucose level is within an appropriate range to provide continuous energy support for the physiological activities of fish and ensure their normal growth and survival [94]. The synthesis and secretion of growth hormone mainly regulate the individual growth rate and energy distribution [95], which may reflect the adaptation of the two species to different niche resource utilization strategies [96]. Mark et al. [96] proposed that fish adjust their energy allocation adaptively during their life cycle and/or respond to changes in environmental conditions through the coordinated regulation of various hormones. In addition, the enriched Wnt signaling pathway is a highly conserved signaling pathway maintained in the process of species adaptive differentiation and plays a key role in the formation of the primary somatic axis, cell differentiation and tissue homeostasis during development [97]. Wnt signaling pathway enrichment has been reported in studies of S. kozlovi [98] and D. rerio [99]. Therefore, we speculate that the selected genes of the two fishes are enriched in the pathways of glucose metabolism, amino acid metabolism and growth hormone synthesis and secretion to better adapt to the unique water environment of the plateau.
Conclusion
In summary, the results of this study emphasize the significant role of geological and environmental changes in shaping the population history and evolutionary processes of P. kaznakovi and P. leptosomus and provide data for understanding the adaptive differentiation and biodiversity of the two species on the QTP. To supplement the study of the effects of geological and environmental changes on the population history and evolutionary process of these two species from the perspective of gene expression, further research can be combined with transcriptomic and other data. Additionally, extensive ecological studies, such as investigations into the habitat preferences and feeding habits of the two species of Ptychobarbus, are needed to further explore the molecular mechanism underlying their adaptive differentiation and speciation.
Supplementary Information
Supplementary Material 1
The reference list from the paper itself. Each links out to its DOI / PubMed record.
- 1Dong WW. Study on morphological characteristics and population genetics of Xenophysogobio boulengeri and Xenophysogobionudicorpa. Chongqing: Southwest University; 2019.
- 2Yang YZ, Wang LZ, Han J, Tang XL, Ma M, Wang K, Zhang X, Ren Q, Chen Q, Qiu Q. Comparative transcriptomic analysis revealed adaptation mechanism of Phrynocephalus erythrurus, the highest altitude Lizard living in the Qinghai-Tibet Plateau. BMC Evol Biol. 2015;15(1):101.10.1186/s 12862-015-0371-8PMC 445082826031664 · doi ↗ · pubmed ↗