Malnutrition-related symptom clusters and quality of life in nasopharyngeal carcinoma patients during radiotherapy: a network analysis
Meng-Yu Hao, Feng-Yan Li, Su-Man Zhang, Yu-Xian Yang, Yu-Xi Xiong, Hang-Yu Wang, Yao Zhuang Chuah, Zi-Hang Chen, Ling-Xin Xu, Peng Sun, Jian Ji, Lecheng Jia, Hua Li, Yanfei Liu, Ying Sun, Jia-Wei Lv, Yan Li, Guan-Qun Zhou

TL;DR
This study identifies symptom clusters in nasopharyngeal cancer patients undergoing radiotherapy and finds that dysphagia and malnutrition strongly impact quality of life.
Contribution
The study introduces a network analysis approach to identify symptom clusters and their impact on quality of life in nasopharyngeal carcinoma patients.
Findings
Three symptom clusters were identified: general (anxiety), head-neck (dysphagia), and gastrointestinal (nausea).
Malnutrition acts as a bridge symptom across clusters and is strongly linked to poorer quality of life.
Symptom clusters remain stable during early and late phases of radiotherapy.
Abstract
To identify symptom clusters (SCs) of nasopharyngeal carcinoma (NPC) patients during radiotherapy and examine the relative importance of specific symptoms in relation to quality of life (QoL). This cross-sectional study recruited non-metastatic NPC patients undergoing radiotherapy at Sun Yat-sen University Cancer Center (August 23—24, 2023). Acute toxicities, malnutrition, and QoL were assessed using the patient-reported outcome version of the Common Terminology Criteria for Adverse Events (PRO-CTCAE), modified Patient-Generated Subjective Global Assessment (mPG-SGA), and European Organization for Research and Treatment of Cancer Quality of Life Questionnaire Head and Neck 35 (EORTC QLQ-H&N35), respectively. Exploratory factor analysis and network analysis were used to identify SCs and characterize central and bridge symptoms. Multivariable logistic regression was conducted to explore…
Genes, proteins, chemicals, diseases, species, mutations and cell lines named across the full text — each resolved to its canonical identifier and authoritative record.
Click any figure to enlarge with its caption.
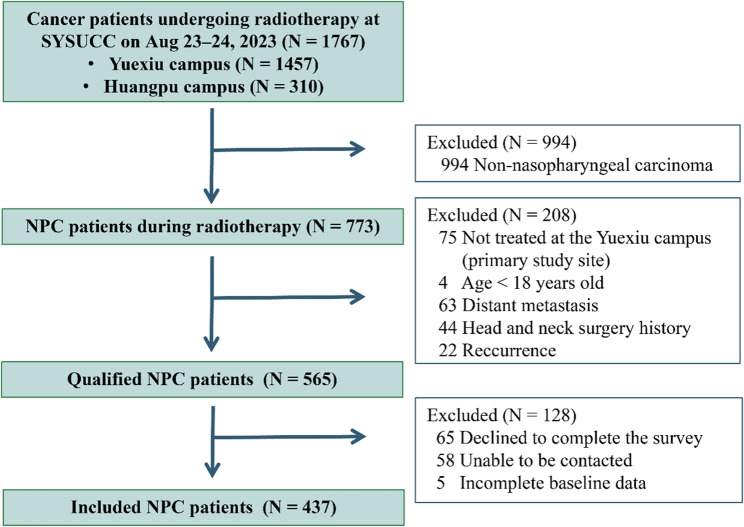 Figure 1
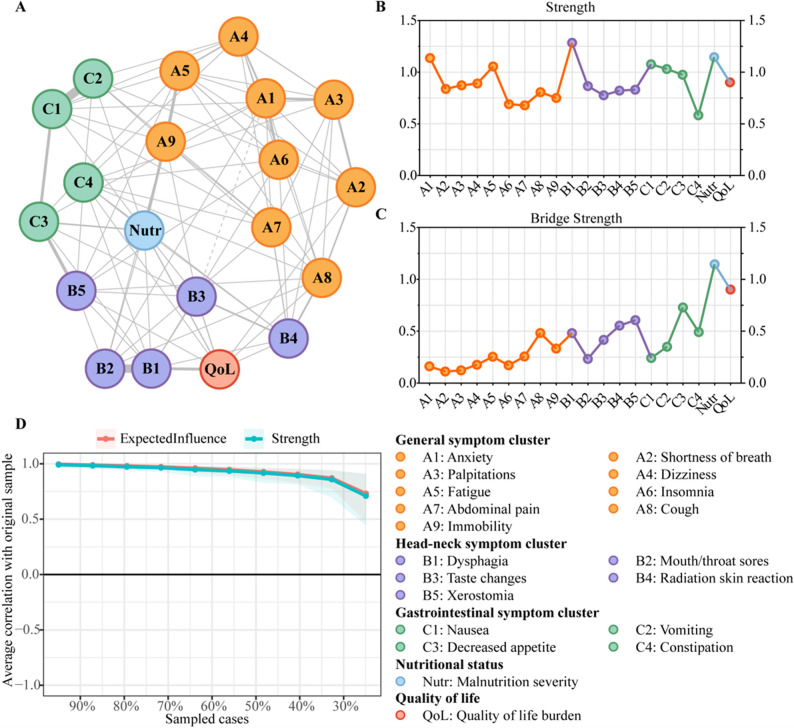 Figure 2
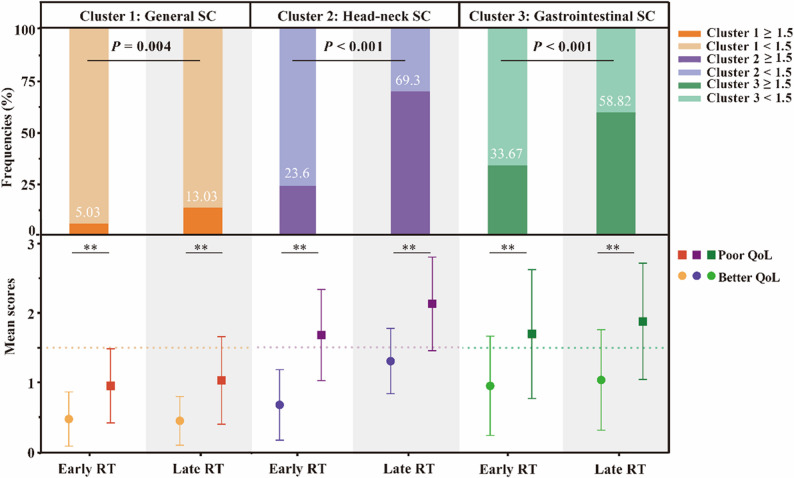 Figure 3
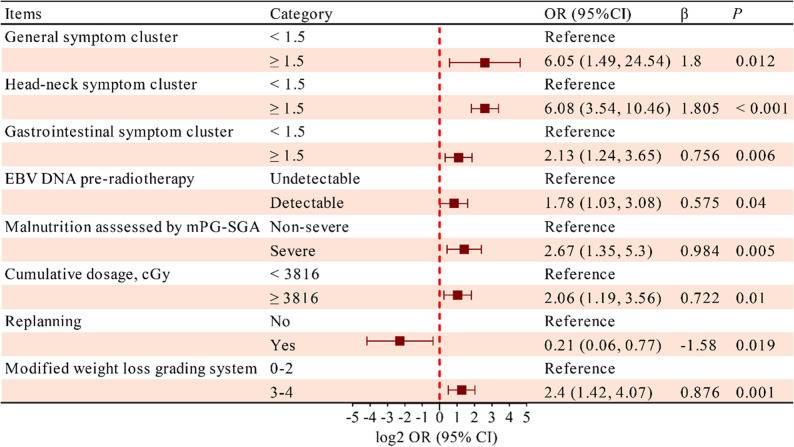 Figure 4
- —National Natural Science Foundation of China
- —Cancer Innovative Research Program of Sun Yat-sen University Cancer Center
- —Guangdong Basic and Applied Basic Research Foundation
Peer Reviews
No public reviews on file for this paper yet. If you reviewed it on a platform where reviews are public (OpenReview, ICLR, NeurIPS, ICML), you can paste yours below so the community can read it here.
Videos
No videos yet. Explain this paper in a talk, walkthrough, or lecture? Add one.
Taxonomy
TopicsHead and Neck Cancer Studies · Nutrition and Health in Aging · Cancer survivorship and care
Introduction
Nasopharyngeal carcinoma (NPC) is a specific type of head and neck carcinoma (HNC) particularly prevalent in East and Southeast Asia, accounting for over 70% of global cases [1]. Although advancements in imaging modalities and intensity-modulated radiotherapy (RT) have contributed to the 5-year locoregional control rate exceeding 90% [2], many NPC patients continue to experience multiple treatment-related toxicities, malnutrition, and poor quality of life (QoL) during RT [3]. Previous studies have predominantly focused on single symptoms assessed by physicians [4, 5], while patient-reported outcomes (PROs), which more comprehensively capture patients’ subjective symptom burden, have been relatively underutilized, potentially limiting personalized supportive care [6].
Treatment-related symptoms in cancer patients rarely occur in isolation. Instead, they tend to co-occur and interact dynamically, forming symptom clusters (SCs) that may reflect shared underlying biological mechanisms, treatment-related tissue injury, or psychosocial processes [7]. Growing evidence suggests that such synergistic interactions among co-occurring symptoms may exert a greater detrimental impact on patient outcomes than the sum of individual symptoms [8]. Common reported SCs include gastrointestinal SC (e.g., nausea-vomiting-anorexia), psychological SC (e.g., anxiety-depression), and cancer-specific SC (e.g., cough-expectoration-hemoptysis in lung cancer) [9–11], yet NPC research remains scarce. A seminal cross-sectional study in 2017 identified four SCs in the late RT phase (weeks 4–7) [12] and highlighted the nutrition impact SC was the most severe SC, but it omitted symptom interactions and potentially escalating toxicity in the early RT phase.
Compared with single-symptom analyses, cluster-based approaches more closely reflect patients’ real-world experiences and may reveal cumulative and synergistic effects that are not apparent when symptoms are considered independently [8]. Network analysis, originally developed in social and psychological sciences, has recently emerged in oncology research [13]. Rather than viewing symptoms as passive indicators of a latent construct, network analysis conceptualizes symptoms as mutually interacting components within a complex system. This framework enables the identification of highly connected or bridging symptoms through centrality metrics (e.g., strength and betweenness), thereby highlighting nodes that may exert disproportionate influence on the overall symptom structure. Early recognition of highly connected or bridging nodes [14] may help prioritize targets for clinical assessment and hypothesis generation regarding supportive interventions.
Notably, malnutrition is highly prevalent in NPC patients undergoing radiotherapy and is closely intertwined with symptom burden. Treatment-related symptoms such as dysphagia, mucositis, taste alterations, and diarrhea can directly impair oral intake and nutrient absorption, contributing to weight loss and sarcopenia [15]. Conversely, malnutrition and muscle wasting may aggravate symptoms like fatigue, weakness, and reduced treatment tolerance, potentially forming a self-reinforcing cycle. Yet, few studies have examined malnutrition as a bridge linking different SCs within the symptom network.
QoL is a multidimensional concept encompassing physical, psychological, and social domains. Different toxicities and other factors may ultimately affect QoL in distinct ways [16, 17]. To date, however, no prior NPC study has systematically integrated SCs, nutritional status, and QoL within a unified network framework.
To address these gaps, we conducted this comprehensive cross-sectional study in an endemic region of NPC, incorporating various PRO questionnaires. The aims of this study were to (1) depict the current real-world burdens of acute toxicities during all RT phases and (2) determine SCs and their network relationships with malnutrition and QoL.
Methods
Design and participants
This cross-sectional study was conducted at the Yue Xiu campus of Sun Yat-sen University Cancer Center (SYSUCC), equipped with 18 linear accelerators and 65 treatment planning systems (TPS) between August 23 and 24, 2023. Deep learning-based auto-contouring of organs at risk (OARs) was routinely implemented to optimize planning efficiency [18]. Inclusion criteria were the following: age ≥ 18 years; pathologically confirmed primary non-metastatic NPC; undergoing RT at the Yue Xiu campus; Karnofsky performance scale score ≥ 70; freedom from mental illness. Exclusion criteria included pregnancy or lactation, prior head and neck surgery or RT, and pre-treatment imaging performed more than three months before enrollment. Eligible patients were notified of the survey location and time by text message 24 h in advance and reminded if absent. This study was approved by the Institutional Review Board of SYSUCC (approval number B2023-482-01). Written informed consent was obtained from all participating patients.
Procedure and assessment
Demographic and clinical data were obtained from the big-data intelligence framework [19] of SYSUCC. Electronic questionnaires were administered via the Wenjuanxing online survey platform (wjx.cn) at the Radiation Center during patients’ RT waiting time. Physicians offered standardized face-to-face explanations as needed.
The patient-reported outcome version of the Common Terminology Criteria for Adverse Events (PRO-CTCAE), a validated instrument widely used in oncology [20, 21], was used to assess 18 pre-selected symptoms. These symptoms were chosen a priori based on their established clinical relevance [13] to NPC and radiotherapy-related toxicities, as well as sufficient prevalence [22] and variability during treatment to ensure analytical stability [23]. Importantly, symptom selection was predefined and not modified based on subsequent analytical results.
Exploratory factor analysis (EFA) was performed using principal axis factoring [23], which emphasizes shared variance among symptoms and is considered appropriate for identifying underlying symptom structures in exploratory settings. An oblique rotation (Oblimin) was applied to allow for correlations between symptom domains. The adequacy of factor analysis was confirmed by a Kaiser-Meyer-Olkin (KMO) index > 0.7 and a significant Bartlett’s sphericity test (P < 0.05) [22].
SCs were identified according to the following predefined criteria: a minimum of three symptoms per cluster [24], eigenvalues > 1, absolute factor loadings of items in SCs > 0.35, Cronbach’s α ≥ 0.70, and clinical relevance [11]. SC severity scores were calculated as the mean sum of all symptom scores within each cluster. No data-driven or post hoc modifications were applied to symptom selection, factor retention, loading thresholds, or clustering criteria based on analytical results.
Nutritional status was evaluated using the modified Patient-Generated Subjective Global Assessment (mPG-SGA), a validated and widely accepted nutritional screening tool for Chinese cancer populations [25]. Anthropometric data, including body weight and height in the preceding 6 months, were verified in the Hospital Information System. Percentage weight loss (WL), body mass index (BMI), and lean body mass (LBM) were calculated using established formulas [26, 27]. The modified weight loss grading system (WLGS) as reported previously [28] (Table S1) was used to precisely describe the WL. Body composition was assessed by measuring the skeletal muscle area (SMA) at the third cervical vertebral (C3) level on radiotherapy planning computed tomography images using ITK-SNAP software (version 4.0) [29]. C3-derived SMA values were converted to whole-body skeletal muscle estimates using validated conversion Eqs. [30, 31].
QoL was assessed using the European Organization for Research and Treatment of Cancer Quality of Life Questionnaire Head and Neck 35 (EORTC QLQ-H&N35) (Chinese version 1.0) [32, 33]. This questionnaire is specifically designed to evaluate symptom-specific QoL in HNC patients and is widely used in observational studies [34]. It comprises seven multi-item scales and 11 single-item symptom measures. Global QoL scores were linearly transformed as the mean sum of standardized scale scores [35]. Symptom severity and global QoL were categorized using established cutoff values: 0 (none), 1–33.33 (mild), 33.34–66.67 (moderate), and > 66.67 (severe) [16]. Moderate or severe global QoL was defined as “poor QoL”.
Network analysis
An undirected network was constructed based on the identified SCs using the R package “qgraph”. Nodes represented individual symptoms or clinical variables, and edges represented adjusted associations between nodes, with thicker edges representing stronger associations. Spearman correlation analysis was applied for ordinal questionnaire options. To reduce spurious associations and enhance interpretability, the least absolute shrinkage and selection operator regularization was applied, combined with extended Bayesian information criterion model selection. A force-directed spring layout was performed to position nodes with the strongest correlations at the center, weaker connected nodes at the periphery, and nodes with similar characteristics closer to each other.
Centrality and bridge centrality indices were estimated using the R packages “qgraph” and “networktools” [14]. “Strength” (the absolute sum of a node’s direct connections) and “expected influence” (the arithmetic sum of a node’s direct connections) were standardized using z-score normalization [36]. The other centrality indices (“closeness” and “betweenness”) were not included due to their instability [8]. “Bridge strength” (the absolute sum of inter-cluster edge weights of a node) [37] was widely used to identify symptoms linking different SCs.
The stability of the centrality indices was evaluated using the bootstrap method in the “bootnet” R package (nBoots = 1000). The case-dropping bootstrap approach was employed to quantify the expected influence stability, and a correlation stability coefficient (CS-coefficient) greater than 0.25 was regarded as robust stability [38]. A network comparison test (NCT) was conducted using the “Network Comparison Test” R package [39] to examine differences between subgroup networks in terms of network structure, edge strength, and global strength. Considering the clinical value and balanced sample sizes, we selected the RT phases using median fractions as the cutoff value for the NCT.
Statistical analysis
We used convenience sampling from the entire NPC population receiving RT at SYSUCC without a pre-calculated sample size. Given the low proportion of missing data and the assumption of a missing completely at random mechanism [40], complete-case analysis (listwise deletion) was applied. Patients with incomplete records were excluded (Fig. 1).
All statistical analyses were performed using the IBM SPSS Statistics version 25.0 and R version 4.4.1. Continuous data were represented as mean ± standard deviation (SD) if normally distributed or as median ± interquartile range (IQR) if skewed. Categorical variables were summarized as frequency and percentages. Group comparisons were conducted using Mann-Whitney U or Kruskal-Wallis tests for continuous or ordinal variables, and the Chi-square or Fisher’s exact tests for categorical variables. Spearman rank correlation coefficients (r) were calculated to assess the correlation.
Given the exploratory and hypothesis-generating nature of this study, no formal adjustment for multiple comparisons was applied. All P values are therefore reported as descriptive measures rather than confirmatory statistical inference. Factors that were significant in the univariate analysis or clinically valuable were selected for further multivariate logistic regression analysis of binary QoL using the forward selection method. A two-tailed P < 0.05 was considered to be statistically significant.
Results
Study workflow and patient characteristics
Between August 23 and 24, 2023, 1767 cancer patients underwent RT at SYSUCC (Table S2). Among them, 773 (43.75%) were NPC patients who were managed in the MOSAIQ integration platform [41]. Through decision tree screening in our NPC-specific database, 565 patients met the predefined inclusion criteria and were consecutively recruited via message alerts (Fig. 1). Following the two-day field investigation, 437 patients completed the questionnaires and were included in the final analysis (Table 1, S3). The cohort comprised predominantly males (73.46%) with a median age of 47 years (IQR: 38–55). All of them were receiving radical RT (76.4% prescribed a radiation dose of 6996 cGy in 33 fractions), and 78.95% had undergone induction chemotherapy before (Table S4).
Fig. 1. Flowchart of the cross-sectional study. SYSUCC, Sun Yat-sen University Cancer Center; NPC, nasopharyngeal carcinoma
Table 1. Scores of PRO-CTCAE and mPG-SGA items (n = 437)PRO-CTCAE itemsN (%)mPG-SGA itemsN (%)Xerostomia394 (90.16)Food intake Grade 3–4112 (25.63) Unchanged or more34 (7.78)Decreased appetite388 (88.79) Normal food but eating less95 (21.74) Grade 3–4130 (29.75) Little solid food196 (44.85)Taste alterations375 (85.81) Only liquids71 (16.25) Grade 3–4168 (38.44) Only nutritional supplements15 (3.43)Fatigue364 (83.30) Only tube feedings/nutrition by vein1 (0.23) Grade 3–455 (12.59) Very little of anything25 (5.72)Nausea359 (82.15)Nutrition impact symptoms (NIS) Grade 3–492 (21.05) Taste disorder (1 point)235 (53.78)Mouth/throat sores321 (73.46) Dry mouth (1 point)200 (45.77) Grade 3–488 (20.14) Nausea (1 point)192 (43.94)Dysphagia319 (73.00) No appetite (3 points)183 (41.88) Grade 3–485 (19.45) Swallowing problems (2 points)177 (40.5)Vomiting293 (67.05) Vomiting (3 points)98 (22.43) Grade 3–461 (13.96) Smell disorder (1 point)80 (18.31)Immobility275 (62.93) Constipation (1 point)74 (16.93) Grade 3–455 (12.59) Feel full quickly (1 point)70 (16.02)Constipation272 (62.24) Pain (3 points)57 (13.04) Grade 3–462 (14.19) Diarrhea (3 points)9 (2.06)Insomnia260 (59.5)Activities and function Grade 3–429 (6.64) Normal with no limitations162 (37.07)Anxiety244 (55.84) Fairly normal with mild limitations163 (37.3) Grade 3–420 (4.58) Abnormal with limitations < half day57 (13.04)Dizziness236 (54.00) Little activity and rarely out of bed55 (12.59) Grade 3–421 (4.81)Weight lossRadiation skin reaction227 (51.95) In the past six months, Mean (SD)7.22 (6.52) Grade 3–416 (3.66) In the recent two weeks, N (%)363 (83.06)Cough219 (50.11)Age Grade 3–416 (3.66) > 65 years25 (5.72)Palpitations172 (39.36) ≤ 65 years412 (94.28) Grade 3–46 (1.37)mPG-SGA total scores, Mean (SD)10.60 (5.48)Abdominal pain147 (33.64) Well-nourished (0 point)6 (1.37) Grade 3–410 (2.29) Mildly malnourished (1–2 points)24 (5.49)Shortness of breath129 (29.52) Moderately malnourished (3–6 points)79 (18.08) Grade 3–45 (1.14) Severely malnourished (≥ 7 points)328 (75.06)PRO-CTCAE, Patient-reported outcome version of the Common Terminology Criteria for Adverse Events; mPG-SGA, Modified Patient-Generated Subjective Global Assessment; N, number of patients; SD, Standard deviation
Symptom burdens and nutritional impact
Overall, 387 patients (88.56%) experienced at least five acute symptoms assessed by PRO-CTCAE concurrently during RT (Table 1). Xerostomia was the most prevalent (90.16%), while taste alterations showed the highest severity (38.44% Grade 3–4). According to mPG-SGA, only 8.24% of patients reported no nutritional impact symptoms, and 75.06% were classified as having severe malnutrition. Based on body composition analysis, sarcopenia was identified in 171 patients (39.13%).
Within the EORTC QLQ-H&N35 questionnaire, WL had the highest score, followed by the nutritional supplements scale (Table S3). In the past week preceding the survey, 356 patients (81.46%) experienced recent WL, while 15.79% stated no change. In the past six months, 278 patients (63.62%) experienced WL ≥ 5%, with 135 of them losing ≥ 10%. Additionally, patients exhibited a wide variation in BMI (13.2–33.5 kg/m^2^). After BMI adjustment, 56.29% of patients experienced grade 3–4 WL.
Symptom clusters and specific roles
Through the EFA (KMO index = 0.91, P < 0.001 in Bartlett’s test), three factors with eigenvalues > 1 were extracted, explaining 56.32% of the variance with a Cronbach’s alpha of 0.863. Based on symptom composition and clinical relevance, these three SCs were labelled as the general SC, head-neck SC, and gastrointestinal SC, with detailed compositions shown in Table 2.
Table 2. The results of exploratory factor analysisSymptom clusterSymptomsFactor loading123Cluster 1: General symptom cluster(M = 0.76, SD = 0.58)Anxiety0.7950.315-0.360Shortness of breath0.7580.294-0.284Palpitations0.7490.313-0.349Dizziness0.7110.299-0.464Fatigue0.6990.436-0.520Insomnia0.6160.364-0.192Abdominal pain0.6240.362-0.237Cough0.6190.502-0.173Immobility0.5410.435-0.441Cluster 2: Head-neck symptom cluster(M = 1.50, SD = 0.85)Dysphagia0.4820.853-0.259Mouth/throat sores0.4370.798*-0.217Taste changes0.2200.712*-0.228Radiation skin reaction0.5380.649*-0.031Xerostomia0.4130.687*-0.448Cluster 3: Gastrointestinal symptom cluster(M = 1.45, SD = 0.90)Nausea0.5250.380-0.893Vomiting0.5290.398-0.839Decreased appetite0.4610.638-0.669Constipation0.3990.512-0.411Initial Eigenvalues7.4121.5721.153Cumulative %41.17649.91256.32Cronbach’s α0.8630.8100.808Extraction method: principal axis factoring. Rotation method: oblimin with Kaiser normalizationM, Mean; SD, Standard deviation*Loadings for the factor indicated
Network visualization revealed substantial interactions among symptoms. The strongest positive pairwise association was observed between nausea and vomiting (edge weight = 0.60), followed by mouth/throat sores and dysphagia (edge weight = 0.57; Table S5). Head-neck SC was positioned closer to the QoL node than the general or gastrointestinal SCs (Fig. 2A).
Fig. 2. Network analysis of symptoms, malnutrition, and quality of life. A Network model with nodes corresponding to symptoms. Solid grey lines denote positive correlations, and dashed lines represent negative correlations. The length and thickness of the edges signify correlation strength. B-C Centrality indices and bridging indices of nodes in the network. The x-axis marks the nodes of the network. The y-axis shows the z-score normalized value of these indices. Dot colors align with network (A)’s scheme. D Centrality index stability evaluated by case-dropping subset bootstrap. The x-axis represents the percentage of original cases sampled per step. The y-axis represents the correlation between original and post-bootstrapping re-estimated networks’ centrality indices. Lines plot the estimated correlation coefficients at each step, with shaded areas denoting 95% confidence intervals
In the global network, dysphagia showed the highest strength, while malnutrition exhibited the strongest overall connectivity with other symptoms across different SCs (Fig. 2B-C). All PRO-CTCAE items were positively correlated with malnutrition scores (r = 0.31–0.57, P < 0.05; Table S6). At the subcluster level, anxiety, dysphagia, and nausea were central symptoms of general SC, head-neck SC, and gastrointestinal SC, respectively. The CS-coefficient was 0.673 in the bootstrap analysis (Fig. 2D). After adjustment for covariates associated with QoL in the univariate analysis (Table S4), the estimated network structure, strength indices (Fig. S1), and relative weight edges (Table S7) remained largely unchanged.
Dominant factors associated with overall QoL
The cohort exhibited marked overall QoL impairment (mean standardized score 35.7 ± 14.67). Univariate analysis revealed several vulnerable factors associated with poor QoL, including female gender, detectable EBV DNA before RT, high cumulative fraction and dosage, absence of replanning, severe modified WL in the past 6 months, and severe malnutrition (P < 0.05; Table S4). Patients with higher severity in all three SCs reported significantly poorer QoL scores (Fig. 3). Fig. 3. Prevalence and severity of symptom clusters of QoL subgroups in the early and late phases. SCs, symptom clusters; RT, radiotherapy; Early: < 18 fractions; Late: ≥ 18 fractions; QoL, quality of life; ** for P < 0.01; Data are expressed as mean ± standard deviation in the plotIn the multivariate logistic regression analysis, explanatory variables of binary overall QoL were identified. All three SCs, mPG-SGA grades, RT cumulative dosage, replanning, pre-RT EBV DNA detectable, and modified WL% (mWLGS) were retained as independent variables after adjustment for age, gender, TNM stage [42], and other covariates (R^2^ = 0.539, P = 0.04; Fig. 4). Significant positive correlations were observed among most single symptoms between EORTC QLQ-H&N35 and PRO-CTCAE (rmax = 0.77, P < 0.001; Fig. S2). Head-neck SC maintained the superior explanatory power over any individual symptom (β = 1.642, P < 0.001; Table S7).
Fig. 4. Multivariate logistic regression analysis of quality of life. EBV, Epstein-Barr virus; DNA, deoxyribonucleic acid; mPG-SGA, modified Patient-Generated Subjective Global Assessment; cGy, centiGray; OR, odds ratio; CI, confidence interval
Subgroup analysis of different RT phases
Across radiotherapy weeks 1 to 7, most symptom-specific QoL scores exhibited a progressive worsening trend (P < 0.05), except for the nutritional supplements and feeding tube scales, which did not show clear temporal patterns (P = 0.079, P = 0.071; Fig. S3). For subgroup analyses, patients were stratified into early and late radiotherapy phases using the median number of fractions as the cutoff.
From the early (< 18 Fr) to the late RT phase (≥ 18 Fr), head-neck SC worsened sharply, while general SC showed relatively minor changes. The most prevalent and severe symptom shifted from xerostomia to taste disturbances (Fig. S4). EAF indicated slight differences in the prominent factor loadings of specific RT phases compared with those derived from the entire RT course (Table S9). However, central and bridge symptoms remained consistent across phases (Fig. S5), and NCT confirmed there was no significant difference in network strength and structure between phase subgroups (Fig. S6).
For the multivariate logistic regression analysis, in the early RT phase, general SC and malnutrition showed the highest β to explain the QoL status (R^2^ = 0.595, P < 0.001; Fig. S7). Pre-RT EBV DNA and detailed RT fractions were also indicative, but both lost significance in the late phase after adjustments. Head-neck SC remained independently associated with poorer QoL across both the early and late RT phases (β_early_ = 1.445, β_late_ = 1.576, P < 0.001). Gastrointestinal SC and modified WL emerged as critical factors associated with QoL (β_SC_ = 1.439, β_WL_ = 1.054, R^2^ = 0.368, P < 0.001) only in the late RT phase.
Discussion
To the best of our knowledge, this cross-sectional study is the first to systematically analyze the relational network among SCs, malnutrition, and QoL based on NPC patient-reported outcomes across all RT phases in a high-incidence area. Malnutrition emerged as a prominent node and a bridge symptom linking other SCs. Head-neck SC, particularly dysphagia, showed high centrality and close associations with QoL impairment, highlighting potential priorities for symptom-focused supportive care.
Our findings add to the contemporary understanding of daily acute toxicity burdens in the era of precision RT. NPC patients experienced a wide spectrum of symptoms during RT in the real world. Although the overall severity of several symptoms appeared lower than previously reported, the symptom burden remained concerning (Table S10). WL, taste alterations and malnutrition were the most severe symptoms, whereas xerostomia exhibited the highest prevalence, pointing out unmet care needs. Notably, the symptom burden captured through PROs exceeded physician-assessed toxicities reported in prior clinical trials using CTCAE criteria [20, 43]. Given that PRO monitoring has been associated with improved QoL in prior studies [44], it deserves greater attention in daily clinical practice and research [45].
Malnutrition and symptoms were closely correlated and jointly associated with QoL. Unlike prior studies that uniformly grouped food-intake-related symptoms into nutritional impact SCs [46, 47], we evaluated malnutrition as an independent node using the modified Patient-Generated Subjective Global Assessment (mPG-SGA), the current gold standard for nutritional assessment [15]. The observed high bridge strength and central positioning of malnutrition across RT phases (Fig. S5) suggest its potential role in connecting multiple symptom clusters and its close association with poorer QoL. Multivariate analyses further demonstrated phase-dependent associations between malnutrition and QoL, with the strongest associations observed during the early RT phase (Fig. S5C, S7). These findings raise the hypothesis that early nutritional support may be an important component of supportive care, although causal relationships require confirmation in prospective and interventional studies.
Symptoms within SCs demonstrated heterogeneous but potentially synergistic associations with QoL. Head–neck SC as a whole explained a greater proportion of QoL variance than individual symptoms, suggesting potential synergistic interactions (Table S8). These patterns were reflected in the network structure, where dysphagia and mouth or throat sores exhibited the second strongest edge weights within the head–neck SC. Moreover, the head–neck SC showed the shortest path lengths and strongest connections to the QoL node (Fig. 2A). In contrast, the general SC exerted relatively weaker associations with QoL, compared with certain isolated symptoms, including shortness of breath and cough (Table S8), likely due to their lower node strengths (Fig. 2B) and looser internal connectivity (mean edge weight: 0.16 vs. 0.37 within the head-neck SC). Overall, these results provide a quantitative description of the associations between acute toxicity-related SCs and QoL in NPC and may help inform considerations for OAR sparing strategies [17].
QoL is a subjective and complex concept influenced by multiple factors beyond treatment-related toxicities. In our cohort, females reported more symptoms than males, which may relate to biological, hormonal, or sociocultural factors [48]. Detectable EBV DNA before RT also showed an independent association with poorer QoL. Copy numbers of EBV DNA released from NPC cells may reflect tumor burden and treatment response [49], thus potentially influencing QoL directly and indirectly [50]. Furthermore, worsening QoL correlates with increasing BMI-adjusted WL grades, especially in the late RT phase, suggesting that early identification of WL may be relevant for recognizing patients at risk of poorer QoL [51].
Different RT phases may require tailored supportive care strategies. Our phase-stratified analyses revealed potential dynamic symptom patterns over the course of treatment. In the early RT phase, gastrointestinal SC showed notable associations with QoL impairment, potentially related to induction chemotherapy exposure. Meanwhile, general SC, despite being the least severe, was also associated with QoL deterioration (β = 2.593, P = 0.01; Fig. S7A). Consistent with previous research [16], most QLQ-H&N35 domains worsened rapidly in weeks 2–3 and peaked at the end of RT, except for nutritional supplements use and feeding tube scales with low prevalence (Fig. S3). In the late RT phase, head-neck SC became the most severe and was strongly associated with damaged QoL, underscoring the need for intensified supportive care during this period.
Notably, replanning was associated with timely improvements in QoL during RT (β = -1.434, P = 0.03; Fig. S7B), extending previous observations regarding its long-term post-RT benefits [52, 53]. However, this observation should be interpreted cautiously, as only a small subset of patients underwent replanning, all during the late RT phase (Table S11). Whether earlier replanning may improve QoL warrants further investigation. In this context, our team has initiated recruitment for the first phase III clinical trial of artificial intelligence (AI)-assisted online adaptive RT for NPC (ChiCTR2400079473; NCT06516133), integrating longitudinal real-time PROs as one of the key endpoints. Our long-term goal is to explore more precise and intelligent strategies aimed at reducing treatment-related toxicities and improving QoL while maintaining oncologic outcomes.
This study has several notable strengths. First, it captured real-world PROs across the entire course of RT in a large endemic NPC cohort. Second, the integration of exploratory factor analysis and network analysis enabled simultaneous identification of SCs and their interaction patterns with malnutrition and QoL. Third, the findings are clinically interpretable and readily applicable to routine supportive care, enhancing their potential generalizability.
Several limitations should be acknowledged. First, patients with extremely severe toxicities may have been less likely to participate, potentially leading to the underestimation of symptom prevalence and severity. To minimize this bias, clinical staff reminded absent patients twice via text messages. Second, PROs may be subject to recall and reporting biases. Nevertheless, QoL is inherently subjective, and PROs remain an essential and validated approach for capturing patients’ symptom experiences. Third, symptom clustering was limited to a predefined subset of PRO-CTCAE items due to questionnaire compatibility and to minimize patient burden during active radiotherapy. Future studies may incorporate a broader range of physical, psychological, and social symptoms, or integrate complementary instruments, to further refine and expand symptom network analyses. Fourth, the cross-sectional design captures patients at different treatment trajectories rather than longitudinal symptom evolution, precluding causal inference. Finally, no formal correction for multiple testing was applied due to the exploratory nature of the analyses, which may increase the risk of type I error. Accordingly, the findings should be interpreted with appropriate statistical caution. Despite these limitations, the relatively large sample size allows depiction of average symptom distributions at specific RT phases and provides a foundation for future prospective studies.
Taken together, these findings should be interpreted within the exploratory scope of the study and primarily serve to generate hypotheses for future longitudinal and interventional research. Network centrality and bridge metrics indicate relative importance within the observed symptom structure rather than causal relationships. Nevertheless, this integrated cluster–network framework provides a complementary perspective on symptom assessment and may help inform more targeted and patient-centered supportive care strategies in NPC.
Conclusions
NPC patients experience diverse co-occurring symptoms that organize into distinct clusters associated with QoL during RT. Dysphagia within the head–neck SC and malnutrition appear to be prominent features within the network and may represent important considerations for symptom assessment and supportive care, warranting further longitudinal investigation.
Supplementary Information
Supplementary Material 1
The reference list from the paper itself. Each links out to its DOI / PubMed record.
- 1Sun X-S, Liu S-L, Luo M-J, Li X-Y, Chen Q-Y, Guo S-S, et al. The association between the development of radiation Therapy, image Technology, and Chemotherapy, and the survival of patients with nasopharyngeal carcinoma: A cohort study from 1990 to 2012. Int J Radiation Oncology*Biology*Physics. 2019;105(3):581–90.10.1016/j.ijrobp.2019.06.254931319091 · doi ↗ · pubmed ↗
- 2Chen YJ, Chen SC, Wang CP, Fang YY, Lee YH, Lou PJ, et al. Xerostomia and nutrition status in nasopharyngeal carcinoma survivors treated with radiation. Eur J Cancer Care. 2016;25(3):440–8.10.1111/ecc.1227025495287 · doi ↗ · pubmed ↗
- 3Li H, Li L, Huang X, Li Y, Zou T, Zhuo X, et al. Radiotherapy-induced dysphagia and its impact on quality of life in patients with nasopharyngeal carcinoma. Strahlentherapie Und Onkologie: Organ Der Deutschen Rontgengesellschaft [et al]. 2019;195(6):457–67.10.1007/s 00066-018-01421-630689027 · doi ↗ · pubmed ↗
- 4Cleeland CS, Zhao F, Chang VT, Sloan JA, O’Mara AM, Gilman PB, et al. The symptom burden of cancer: evidence for a core set of cancer-related and treatment-related symptoms from the Eastern cooperative oncology group symptom outcomes and practice patterns study. Cancer. 2013;119(24):4333–40.10.1002/cncr.28376 PMC 386026624114037 · doi ↗ · pubmed ↗
- 5Coomans MB, Dirven L, Aaronson NK, Baumert BG, Van Den Bent M, Bottomley A, et al. Symptom clusters in newly diagnosed glioma patients: which symptom clusters are independently associated with functioning and global health status? Neurooncology. 2019;21(11):1447–57.10.1093/neuonc/noz 118PMC 682782431682733 · doi ↗ · pubmed ↗
- 6Liang M, Zhong T, Knobf MT, Chen L, Xu M, Cheng B, et al. Sentinel and networked symptoms in patients with breast cancer undergoing chemotherapy. Eur J Oncol Nursing: Official J Eur Oncol Nurs Soc. 2024;70:102566.10.1016/j.ejon.2024.10256638513452 · doi ↗ · pubmed ↗
- 7Xiao W, Chan CWH, Fan Y, Leung DYP, Xia W, He Y, et al. Symptom clusters in patients with nasopharyngeal carcinoma during radiotherapy. Eur J Oncol Nursing: Official J Eur Oncol Nurs Soc. 2017;28:7–13.10.1016/j.ejon.2017.02.00428478859 · doi ↗ · pubmed ↗
- 8Zhan Z-J, Huang H-Y, Xiao Y-H, Zhao Y-P, Cao X, Cai Z-C, et al. Anxiety and depression in nasopharyngeal carcinoma patients and network analysis to identify central symptoms: A cross-sectional study from a high-incidence area. Radiother Oncol. 2024;197:110324.10.1016/j.radonc.2024.11032438735537 · doi ↗ · pubmed ↗