The Impact of Genotoxicity in Coke Oven Workers: Systematic Review With Meta‐Analysis
Thiago Guedes Pinto, Vinícius Fialho do Nascimento, Giovanna Abreu Holanda Guerra, Wilton Mitsunari Takeshita, Raquel Alves Sales, Andrea Cristina de Moraes Malinverni, Luciana Lopes Guimaraes, Daniel Araki Ribeiro

TL;DR
Coke oven workers are at high risk of genetic damage from exposure to harmful chemicals, highlighting the need for safety regulations.
Contribution
This study systematically reviews and meta-analyzes genotoxicity in coke oven workers, revealing significant DNA damage and calling for regulatory action.
Findings
21 studies found genotoxic effects in coke oven workers, with 20 showing micronucleus formation and chromosomal abnormalities.
Meta-analysis showed significant differences in genotoxicity markers between coke oven workers and controls.
All 21 studies were rated as Strong or Moderate quality, supporting the reliability of the findings.
Abstract
This systematic review (SR) with meta‐analysis investigates the genotoxicity potential of coke oven workers (COWs) exposed to polycyclic aromatic hydrocarbons (PAHs) through a comprehensive analysis of studies retrieved from PubMed, SCOPUS, and Web of Science. The comparisons were defined as standardized mean difference (SMD), and 95% confidence intervals (CIs) were established. A systematic search conducted in May 2025 identified 21 relevant studies, which employed different assays, such as the micronucleus assay (MA) and the comet assay (CA) in order to assess DNA damage. The outcomes suggested that 21 of the reviewed studies observed genotoxic effects related to this exposure, with 20 inducing micronucleus formation and chromosomal abnormalities. As for the quality assessment, a total of 18 studies were classified as Strong, and three (out of 21) were deemed as Moderate. No study was…
Genes, proteins, chemicals, diseases, species, mutations and cell lines named across the full text — each resolved to its canonical identifier and authoritative record.
Click any figure to enlarge with its caption.
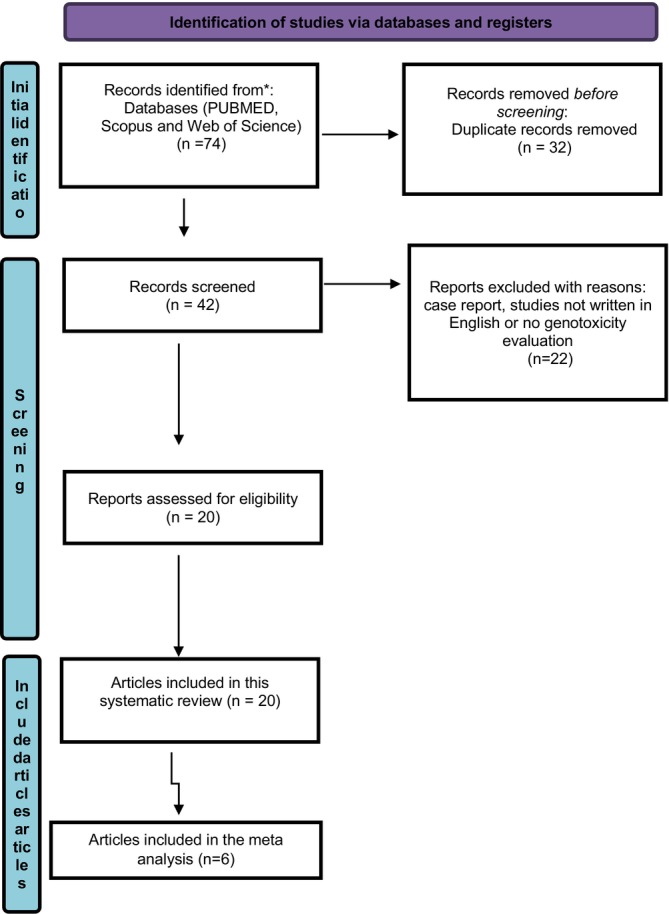 FIGURE 1
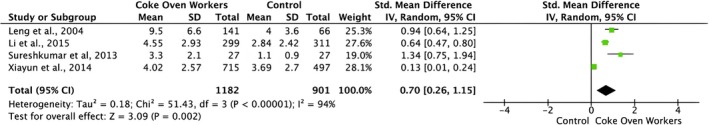 FIGURE 2
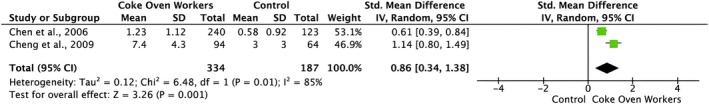 FIGURE 3
| Electronic databases used | Search strategy (August 2025) |
|---|---|
|
PubMed Scopus Web of Science | (polycyclic aromatic hydrocarbons) OR (coke oven emissions) AND (DNA Damages) OR (Damage, DNA) OR (Damages, DNA) OR (DNA Injury) OR (DNA Injuries) OR (Injuries, DNA) OR (Injury, DNA) OR (Genotoxic Stress) OR (Genotoxic Stresses) OR (Stresses, Genotoxic) OR (Genotoxicity) OR (Mutagenicity) OR (comet assay) OR (micronucleus assay) OR (sister chromatid exchange) OR (chromosomal aberration test) OR (Stresses, Genotoxic) (micronucleus) OR (micronucleated cell) OR (chromosome damage) OR (chromosomal injury) OR (chromosome breakage) OR (chromosome aberration test) OR (genetic polymorphism) OR (gene polymorphism) OR (polymorphism)) OR (polymorphic gene) OR (gene polymorphic) OR (gene, polymorphism) OR (gene, polymorphic).AND (mammalian) OR (occupational) OR (worker) OR (job). |
|
|
|
| Exposure period/time |
|---|---|---|---|
| Samir et al. | 2019 | Egypt | ≥ 1 year |
| Xiaoliang et al. | 2015 | China | > 1 year |
| Dai et al. | 2014 | China | > 1 year |
| Sureshkumar et al. | 2013 | India | 0–12 years |
| Ada et al. | 2013 | Turkey | ≥ 3 months |
| Huang et al. | 2012 | China | > 6.4 years |
| Chen et al. | 2011 | Taiwan | ≥ 1 year |
| Wang et al. | 2010 | China | > 1 year |
| Cheng et al. | 2009 | China | > 6 months |
| Yang et al. | 2009 | China | > 6 months |
| Yang et al. | 2008 | China | > 6 months |
| Qiu et al. | 2007 | China | Not reported |
| Cheng et al. | 2007 | China | > 1.5 months |
| Cheng et al. | 2007 | China | Not reported |
| Chen et al. | 2006 | China | > 6 months |
| Leng et al. | 2005 | China | > 1.5 months |
| Leng et al. | 2004 | China | > 6 months |
| Wu et al. | 2004 | Taiwan | ≥ 1 year |
| Marczynski et al. | 2002 | Germany | ≥ 1 year |
| van Delft et al. | 2001 | Netherlands | ≥ 1 year |
| Kalina et al. | 1998 | Slovakia | ≥ 5 years |
| Author | Cell type |
| Gender | Age | Assays |
| Stain | Evaluated parameters | Inclusion criteria | Cytotoxicity analysis | Blind analysis | Proper statistical description | Negative control | Positive control |
|---|---|---|---|---|---|---|---|---|---|---|---|---|---|---|
| Samir et al. | Peripheral blood lymphocytes | W: 85 C: 85 | Male |
W: 45.6 years C: 44.9 years |
HPLC qPCR ELISA Gas chromatography | Not specified | Not specified |
Urinary 1‐OHP 8‐OHdG urinary Gene expression CYP2E1 BPDE‐DNA adduct Genotyped for XRCC1 Arg/GIn Air sampling and analysis of airborne PAHs Demographic and lifestyle factors | Yes | No | Yes |
ANOVA Kruskal–Wallis Spearman correlation | Yes | No |
| Xiaoliang et al. | Peripheral blood |
W: 922 C1: 1.017 cancer + non‐cancer (2.034) C2: 617 cancer 661 non‐cancer (1.278) | Male |
W: 42.43 C1: 60.3; 59.7 C2: 60.3; 61.3 |
MN ELISA SNP | 1000 | Giemsa |
Cell count Plasma concentration of BPDE‐Alb Genotype frequencies of APEX1: rs1760944 | Yes | No | No |
Komogorov–Smirnov Kruskal–Wallis Poisson regression | Yes | Yes |
| Daiet al. |
Peripheral blood Morning urine |
W: 1.715 C: 497 | Male |
W: 41 C: 42.48 ± 8.04 |
MN SNP ELISA Gas chromatography–mass spectrometry HPLC |
1000 27 | Not reported |
Cell count Heparin anticoagulated plasma of BPDE‐Alb Urinary PAH metabolites Oxidative DNA‐damage levels (8‐OHdG) | Yes | No | No |
ANOVA Kruskal–Wallis χ2 tests | Yes | No |
| Sureshkumar et al. | Peripheral blood |
W: 27 C: 27 ** Both: G1: 12 G2: 15 | Male |
W: G1: 27.9 ± 3.9 G2: 44.4 ± 5.8 C: G1: 27.5 ± 4.4 G2: 43.5 ± 5.2 |
MN Comet assay RFLP‐PCR |
1000 100 metaphysis | Giemsa |
Cell count Cell count Genotypic analysis for XRCC1 399 Arg/Gln polymorphism. | Yes | No | Yes |
SPSS ANOVA | Yes | No |
| Ada et al. | Peripheral blood lymphocytes |
W: 50 C: 50 | Male |
W: 40.4 ± 6.6 years C: 38.7 ± 9.5 years |
MN Comet assay Genotyping for polymorphisms HPLC | 2000 cells |
May–Grünwald Giemsa |
CBMN frequency Chromatid breaks, acentric fragments, dicentrics and gaps Genotyped for CYP1A1, CYP1B1, EPHX1, GSTM1, GSTT1 and GSTP1 Urinary 1‐OHP | Yes | Yes | Yes |
Student's Mann–Whitney U Spearman correlation Shapiro–Wilk | Yes | No |
| Huang et al. ( | Peripheral blood |
W bottom: 67 W side: 57 W top: 78 Cl: 96 | Male |
W bottom: 38.5 ± 6.6 years W side: 37.4 ± 6.5 years W top: 37 ± 6.3 years C: 37 ± 5 years |
Comet assay HPLC Genotyping for polymorphisms | Not reported | Ethidium bromide |
Demographic and lifestyle factors TM Plasma BPDE‐Alb Genotyped for CYP1A1, CYP1B1, CYP2B6 and CYP2E1 Air sampling and analysis of airborne PAHs | Yes | No | No |
ANOVA χ2 tests Kruskal–Wallis | Yes | Yes |
| Chen et al. |
Peripheral blood lymphocytes Urine | W: 289 | Male |
W side: 44.8 ± 9.5 years W top: 44.5 ± 8.3 years |
HPLC Genotyping for polymorphisms (SNPs) | Not specified | Not specified |
1‐OHP 8‐OHdG Polymorphism for GNMT Air sampling and analysis of airborne PAHs Demographic and lifestyle factors | Yes | No | No |
Student ANOVA Regression model Mann–Whitney U Spearman correlation Chi‐square test | No | No |
| Wang et al. |
Peripheral blood Urine | W: 475 | Male | Workers: 38.74 ± 8.59 years |
Comet assay HPLC Genotyping for polymorphisms (SNPs) | 50 cells per slide on comet assay | Ethidium bromide |
Demographic and lifestyle factors 1‐OHP Olive TM Genotyped for ERCC1, CSA, CSB, XPA, XPB, XPC, XPD, XPF, XPG and DDB2 Air sampling and analysis of airborne PAHs | Yes | No | Yes |
ANOVA χ2 tests Student's | Yes | Yes |
| Cheng et al. |
Peripheral blood Urine |
W: 94 C: 64 | Male and female |
W: 41.2 ± 6.8 years C: 41.8 ± 4.7 years |
MN Comet assay SNP |
1000 100 |
Giemsa for MN Ethidium bromide for CA |
Cell count Olive TM Polymorphism analysis of the XRCC1 gene: Arg194Trp (C26304T, rs1799782), Arg280His (G27466A, rs25789), Arg399Gln (G28152A, rs25487) and Gln632Gln (G36189A, rs3547) Demographic and lifestyle factors | Yes | No | Yes |
χ2 tests Two‐sided two‐sample ANCOVA Logistic regression | Yes | Yes |
| Yang et al. |
Peripheral blood Lung tissue |
W: 303 C: 297 | Male and female |
Workers: 38.8 ± 3.8 years Control: 39.3 ± 8.6 years |
Come assay SNP | 50 | Ethidium bromide |
Demographic and lifestyle factors Olive TM Genotyped for FEN1 (c.‐69G>A and c.4150G>T) | Yes | No | Yes |
Student's Logistic regression χ2 tests Mann–Whitney U ANCOVA | Yes | Yes |
| Yang et al. | Peripheral blood |
Ws: 251 C: 130 | Male |
W: 37.1 ± 6.4 years C: 37.1 ± 5.1 years |
Come assay HPLC SNPs | 50 | Ethidium bromide |
Demographic and lifestyle factors TL Olive TM Genotyped for HSP70‐1, HSP70‐2, and HSP70‐hom Air sampling and analysis of airborne PAHs | Yes | No | No |
Shapiro–Wilk Mann–Whitney U Student's χ2 tests | Yes | No |
| Qiu et al. |
Peripheral blood Urine |
W: 166 C: 69 | Not reported | W: 35–44 |
MN Come assay SNPs |
1000 100 |
Giemsa for MN Ethidium bromide for Comet assay |
Cell count Olive TM 1‐OHP Polymorphism analysis of the XRCC1, ERCC‐2, mEH3, CYP1A1, and GSTP1 Demographic and lifestyle factors | Yes | No | Yes |
Path analysis Regression multivariate χ2 tests Student's | Yes | Yes |
| Cheng et al. |
Peripheral blood Urine |
W: 140 C: 66 | Not reported | W: 39.1 years |
MN SNP | 1000 | Giemsa |
Cell count 1‐OHP Genotyped for ERCC1, ERCC2, ERCC4, ERCC5, and ERCC6 Air sampling and analysis of airborne PAHs Demographic and lifestyle factors | Yes | No | Yes |
Mann–Whitney U Spearman χ2 tests | Yes | No |
| Chen et al. | Peripheral blood |
W: 240 C: 123 | Male |
Workers: 37.1 ± 4.9 years Control: 37.1 ± 6.2 years |
Comet assay HPLC RFLP‐PCR Multiplex PCR | 50 | Ethidium bromide |
Demographic and lifestyle factors Genotyped for AhR, CYP1A1, GSTM1, and GSTT1 Air sampling and analysis of airborne PAHs | Yes | No | Yes |
Student's χ2 tests Mann–Whitney U | Yes | No |
| Leng et al. |
Peripheral blood Urine |
W: 141 C: 66 | Male and female |
W: 39 C: 38.1 |
MN htSNPs | 1000 | Not reported |
Cell count Analyses of air concentrations of benzene‐soluble matter and particulate‐phase benzo[a]pyrene XRCC1 genotyping and haplotype modeling: Arg194Trp, Arg280His, Arg399Gln, and Gln632Gln Analysis of Tyr113His and His139Arg polymorphisms of mEH gene | Yes | No | Yes | Dunnett–Hsumethod | Yes | No |
| Leng et al. |
Peripheral blood Urine |
W: 141 C: 66 | Male and female |
W: 39 ± 7 years C: 38 ± 8 years |
MN HPLC | 1000 | Giemsa |
Demographic and lifestyle factors Urinary PAHs metabolites Cell count Genotyped for CYP1A1, CYP2E1, mEH, GSTM1, GSTT1, GSTP1, NQO1, and NAT2 Air sampling and analysis of airborne PAHs | Yes | No | Yes |
Student's Mann–Whitney U χ2 tests Spearman ANCOVA | Yes | No |
| Wu et al. | Peripheral blood | W: 183 | Male | 41.2 ± 9.0 years |
HPLC ELISA PCR‐RFLP | Not specified | Not specified |
1‐OHP 8‐OHdG urinary Polymorphism for GSTM1 and GSTT1 Demographic and lifestyle factors | Yes | No | No |
Multiple regression Spearman correlation Student's χ2 test | Yes | No |
| Marczynski et al. |
Peripheral blood Urine |
W:20 C: 47 | Male |
W: 37.4 ± 9.5 years C: 38.0 ± 8.9 years |
HPLC‐UV/EC HPLC‐DAD HPLC‐FD Comet assay PCR‐RFLP Genotyping for polymorphisms | 50 | Not specified |
Analysis of 8‐oxodGuo in WBC DNA Tail moment 1‐OHP Polymorphism for CYP1A1, GSTM1, GSTT1, and GSTP1 Air sampling and analysis of airborne PAHs Demographic and lifestyle factors | Yes | Yes | Yes |
ANOVA Mann–Whitney U Kruskal–Wallis | Yes | No |
| van Delft et al. |
Peripheral blood lymphocytes Urothelial cells |
W: 35 C: 37 | Male |
W: 37–39 years C: 37–40 years |
MN Comet assay HPLC‐FD DNA adducts Genotyping for polymorphisms |
500 MN 100 cells | Giemsa |
1‐OHpyr urine SCE frequency and DNA strand breaks PAH‐DNA adduct Polymorphism for GSTM1 and GSTT1 | Yes | No | Yes |
Student's Mann–Whitney | Yes | No |
| Kalina et al | Peripheral blood lymphocytes |
W:64 C:34 | Male |
W: 41 years 27–55) C: 40 years (27–58) |
CA SCE HPLC‐FD Cytogenetic monitoring Genotyping for polymorphisms | Not reported | Not reported |
Chromosomal aberrations SCE frequency HFC frequency SCE‐H Polymorphism for GSTM1 and NAT2 Air sampling and analysis of airborne PAHs | Yes | No | Yes |
Spearman Mann–Whitney U test | Yes | No |
| Authors | Cytotoxicity | Genotoxicity | Polymorphism results | Observations |
|---|---|---|---|---|
| Samir et al. | No results | ↑ BPDE‐DNA adducts and ↑ 8‐OHdG in exposed workers | XRCC1 polymorphism associated with DNA adduct levels | ↑ PAH exposure confirmed via urinary 1‐OHP; DNA adducts linked to XRCC1 genotype |
| Xiaoliang et al. | No results | ↑ MN in exposed workers | ↑ BPDE‐Alb in APEX 1 Glu genotypes; ↑ MN with +148Glu allele (mainly in males) | ↑ DNA damage association between APEX1 148Glu; ↑ lung cancer risk in smokers with 148Asp or Glu allele |
| Dai et al. | No results | ↑ MN ↑ 8‐OhdG in exposed workers | Association between ↓MN frequency and SNPs 9p21‐rs1333040, 10p14‐rs1663689, 15q25.1rs3813572, rs3813572, CCþ TC and TC genotype, homozygotes (GG) of rs1663689 | Exposure groups had higher levels of BPDE‐Alb adducts and most PAH metabolites except 4‐hydroxyphenanthrene; ↑ 8‐OHdG and MN frequency associated with increased environmental PAH levels, adjusting for age, gender, BMI, smoking, and drinking; ↑ BPDE‐Alb, ↑ MN with PAH exposure; ↑ MN in women and older individuals |
| Sureshkumar et al. | No results | ↑ MN and ↑ CA in exposed workers | XRCC1 399Gln: no significant result | ↑ MN frequency in smokers; XRCC1 is involved in the efficient repair of DNA single stand breaks |
| Ada et al. | No results | ↑ MN and ↑ CA in exposed workers | No polymorphism analysis | ↑ Cytogenetic damage after ≥ 3 months exposure |
| Huang et al. | No results | ↑ TM in exposed workers | ↑ BDPE‐Alb in plasm and ↑ TM in GG genotype; ↓ BDPE‐Alb in plasm and ↓TM in GA (CYP2B6) genotype | ↑ PAHs B(a)p air in bottom, side and top of oven (especially top of oven); No significant differences of smoking, cigarettes/day or alcohol use |
| Chen et al. | No results | ↑ TM in exposed workers | Association between ↑ TM and AhR Lys554 | ↑ PAHs B(a)p and BSM air in the coke‐oven working; No significant differences of smoking, cigarettes/day or alcohol use |
| Wang et al. | No results | ↑ TM in exposed workers | Association between ↑ TM and XPC rs2228001; ↓ TM: XPA rs1800975 and XPC rs3731055 | ↑ PAHs B(a)p air in bottom, side and top of oven (especially top of oven); ↑ 1‐OHP urine in coke‐oven workers; No significant differences of 1‐OHP urine in age, work duration, smoking, cigarettes/day or alcohol use |
| Cheng et al. | No results | ↑ MN in exposed workers | XRCC1 Arg399Gln possibly reduces DRC | ↑ 1‐OHP, ↑ basal DNA damage, ↓ DRC in coke‐oven workers; XRCC1399, InOHP, DRC, age indirectly affects MN frequency |
| Yang et al. | No results | ↑ TM in exposed workers | ↑ BDPE‐Alb and ↑ TM in ‐69GG abd ‐69GA genotype; FEN1 SNPs (c.‐69G, c4150G>T) associated with ↑ lung cancer risk | ↑ PAHs B(a)p and BSM air in the coke‐oven working; No significant differences of smoking, cigarettes/day or alcohol use |
| Yang et al. | No results | ↑ TM in exposed workers | ↑ TM associated with HSP70‐1 | ↑ PAHs B(a)p and BSM air in the coke‐oven working; No significant differences of smoking, cigarettes/day or alcohol use |
| Qiu et al. | No results | ↑ MN and ↑ CA | Association between ↑ MN and GSTP1 variant; ↑ TM: mEH3 variants | ↑ 1‐OHP in XRCC1, ERCC2, and XRCC1‐exon6 variant genotypes |
| Cheng et al. | No results | ↑ MN in exposed workers | XRCC1 Arg399Gln reduces DRC | ↑ 1‐OHP, ↑ DNA damage, ↓ DRC; MN frequency influenced by multiple factors in coke workers |
| Cheng et al. | No results | ↑ MN in exposed workers | Association between ↑ MN and ERCC1, ERCC6, ERCC2 polymorphisms | ↑ PAH in coke‐oven workers; MN ↑ in older workers |
| Leng et al. | No results | ↑ MN in exposed workers | Association between ↑ MN frequency and XRCC1 Arg194Trp polymorphism |
↑ 1‐OHP urine in coke‐oven workers; XRCC1 gene in linkage disequilibrium |
| Leng et al. | No results | ↑ MN in exposed workers | Association between ↑ MN and mEH exon 3 Tyr/Tyr, GSTP1 Val105 and GSTM1 null | ↑ PAHs B(a)p and BSM air in the coke‐oven working; ↑ Highest levels of both BSM and B(a)p at top of oven; ↑ 1‐OHP urine in coke‐oven workers, current smokers and male than in female workers; ↑ MN frequencies significantly associated, especially in workers ≥ 40 years |
| Wu et al. | No results | ↑ 8‐OHdG levels in workers from topside ovens | No polymorphism analysis | ↑ Oxidative damage in topside workers; exposure via 1‐OHP |
| Marczynski et al. | No results | ↑ DNA strand breaks and oxidative lesions in coke oven workers and ↑ 8‐OHdG | No polymorphism analysis | ↑ DNA migration; correlated with individual exposure levels (1‐OHP) |
| van Delft et al. | No results | ↑ SCE, ↑ DNA damage in exposed workers | No polymorphism analysis | ↑ DNA damage in workers; PAH exposure via urinary 1‐OHP |
| Kalina et al. | No results | ↑ CA, ↑ SCE, ↑ HFC index in exposed workers | GSTM1 and NAT2 genotyping done | ↑ Exposure via personal monitoring; ↑ Chromosomal damage |
| Author | Number of confounders | Detail | Rating |
|---|---|---|---|
| Samir et al. | 0 | — | Strong |
| Xiaoliang et al. | 1 | — | Strong |
| Dai et al. | 1 | — | Strong |
| Sureshkumar et al. | 0 | — | Strong |
| Ada et al. | 0 | — | Strong |
| Huang et al. | 2 | No reported CA number | Moderate |
| Chen et al. | 0 | — | Strong |
| Wang et al. | 0 | — | Strong |
| Cheng et al. | 0 | — | Strong |
| Yang et al. | 0 | — | Strong |
| Yang et al. | 1 | — | Strong |
| Qiu et al. | 0 | — | Strong |
| Cheng et al. | 0 | — | Strong |
| Cheng et al. | 1 | No control group | Moderate |
| Chen et al. | 0 | — | Strong |
| Leng et al. | 0 | — | Strong |
| Leng et al. | 0 | — | Strong |
| Wu et al. | 0 | — | Strong |
| Marczynski et al. | 2 | — | Strong |
| van Delft et al. | 0 | No minimum amount of evaluated cells | Moderate |
| Kalina et al. | 0 | — | Strong |
- —Conselho Nacional de Desenvolvimento Científico e Tecnológico10.13039/501100003593
Peer Reviews
No public reviews on file for this paper yet. If you reviewed it on a platform where reviews are public (OpenReview, ICLR, NeurIPS, ICML), you can paste yours below so the community can read it here.
Videos
No videos yet. Explain this paper in a talk, walkthrough, or lecture? Add one.
Taxonomy
TopicsCarcinogens and Genotoxicity Assessment · Toxic Organic Pollutants Impact · Genomics, phytochemicals, and oxidative stress
Introduction
1
Coke oven emissions (COEs) are complex mixtures of pollutants, prominently featuring polycyclic aromatic hydrocarbons (PAHs) and nitro‐PAHs, both known for their genotoxic and carcinogenic properties (Li et al. 2015; Vimercati et al. 2020). The chemical composition of these emissions varies with the coke production technology employed (IARC 2012). Long‐term occupational exposure to PAHs among coke oven workers (COWs) has been linked to elevated risks of cancers of the lung, bladder, stomach, and skin (Samir et al. 2019). In particular, a 30‐year follow‐up study confirmed increased mortality from respiratory system cancers and prostate cancer among COWs.
Genotoxicity plays a critical role in occupational exposure, since genetic damage is involved in the initial phase of chemical carcinogenesis. Particularly, cytogenetic analysis of peripheral blood lymphocytes by means of micronucleus assay is a well‐established method for assessing occupational exposure to clastogenic agents such as PAHs (Fenech 2000). Other cytogenetic endpoints include chromosomal aberrations (CAs), sister chromatid exchanges (SCEs), and DNA strand breaks, all of which serve as biomarkers of genotoxic effects (Bonassi et al. 2007). In fact, some authors have shown a correlation between increased genetic damage and higher cancer incidence (Bonassi et al. 2008). On the other hand, some biomarkers such as urinary 1‐hydroxypyrene (1‐OHP) and 8‐hydroxy‐2′‐deoxyguanosine (8‐OHdG) have also been utilized to monitor internal PAH exposure and subsequent oxidative DNA damage (Hong et al. 2000). The results have demonstrated a significant correlation between these two biomarkers among COWs, indicating a link between PAH exposure and DNA oxidation (Wu et al. 2004).
Given the great relevance of genotoxicity following occupational exposure under different contexts and paradigms, the current study aims to systematically review the literature to determine whether occupational exposure to PAHs among COWs is consistently associated with genotoxicity.
Material and Methods
2
Studies were included if they met all the following criteria: (1) original observational studies evaluating cytogenetic/genotoxic outcomes (e.g., CAs, SCE, micronuclei) in relation to occupational PAH exposure; (2) studies assessing different polymorphisms in modulating genotoxic effects; (3) studies conducted in human populations, specifically workers in coke oven or similar industrial settings; (4) manuscripts published in peer‐reviewed journals and written in English; (5) availability of sufficient methodological detail and extractable data on outcomes and exposures.
Exclusion criteria were (1) reviews, conference abstracts, editorials, case reports, or letters; (2) experimental studies in vitro or in non‐human models; (3) studies not reporting any genotoxic or cytogenetic outcomes; (4) lack of clear exposure characterization or absence of a comparator group; (5) full texts not accessible or not published in English; (6) insufficient data for extraction or quality assessment.
Search Strategy
3
A systematic search of the literature was performed in May 2025 across the databases PubMed, Scopus, and Web of Science. The search strategy included the combination of PubMed, SCOPUS, and Web of Science through the following Boolean operators: (“Polycyclic aromatic hydrocarbons” OR “PAHs” OR “coke oven emissions”) AND (“Genotoxicity” OR “Cytogenetic damage” OR “Chromosomal aberrations” OR “Sister chromatid exchange” OR “Micronuclei”) AND (“polymorphisms” OR “polymorphism”) AND (“Occupational exposure” OR “Workers”).
No restrictions were applied regarding the publication date to capture both historical and recent evidence. Additionally, the reference lists of all selected manuscripts were hand‐searched to identify potentially eligible studies not captured in the initial database queries.
Study Selection and Data Extraction
4
Five independent reviewers screened the titles and abstracts for eligibility. Full texts of potentially relevant studies were then assessed based on the inclusion criteria. Although no significant disagreement came up, divergences among reviewers were resolved through discussion and consensus. For each included study, the following data were extracted: study design, population characteristics, exposure assessment method, type of cytogenetic/genotoxic assay used, polymorphism genotypes, presence of a control group, blind analysis, proper statistical analysis, and main findings.
The detailed search strategy and screening process are summarized in Table 1.
Data Extraction and Quality Assessment
5
Data from the eligible studies were independently extracted by two reviewers using a standardized protocol tailored to the objectives of this review. The collected information included: authorship, publication year, country of study, characteristics of the study population (such as occupational role, age distribution, smoking habits), exposure parameters (e.g., environmental PAH levels, 1‐OHP concentrations), cytogenetic/genotoxicity endpoints assessed (including CAs, SCEs, and micronuclei), number of analyzed cells, type of assay performed, inclusion of genetic polymorphism data (including various detoxification, metabolic, and DNA repair gene variants), blinding status of outcome evaluation, statistical approaches employed, presence of negative or low‐exposure control groups, and main findings related to genotoxic outcomes and genetic susceptibility. This methodology has been broadly used by our research group (Guedes Pinto et al. 2024; Pinto et al. 2025).
In parallel with data extraction, a methodological quality and risk of bias assessment was carried out for each included study. This evaluation followed an adapted framework based on checklists used in prior systematic reviews in occupational and environmental toxicology. Key domains assessed included: clear definition of exposure and outcome measures, adjustment for relevant confounders (such as age, smoking, alcohol consumption), implementation of blinding during outcome assessment, sample size adequacy, completeness of genotyping data, and appropriateness of statistical analyses.
Based on these domains, each study was assigned a quality grade. Studies that met all criteria without critical limitations were rated as Strong. Studies that lacked control of more than one methodological factor were classified as Moderate. Studies with two or more uncontrolled confounding factors, poor exposure definition, or other significant biases were rated as Weak. Final classifications were reached by consensus among reviewers after independent assessment (Guedes Pinto et al. 2024; Pinto et al. 2025).
Meta‐Analysis
6
The meta‐analysis using a random‐effects model was performed to compare COWs and control. The random‐effects model with the Der Simonian‐Laird method was used to minimize the influence of heterogeneity on the articles included. The standardized mean difference (SMD) was used as the effect measure and it was calculated by the means and standard deviations (SDs) from COWs and control. The effect size was determined by calculating Cohen's d statistics. A value effect of 0.2, 0.5, and 0.8 was considered a small, medium, and large effect, respectively (Malacarne et al. 2023; Pinto et al. 2025).
Forest plots were used to display graphically the effect sizes and 95% confidence intervals (CIs). A two‐tailed p < 0.05 was used to determine the statistical significance. The heterogeneity among the studies included was analyzed with Cochran's Q test and quantified with I ^2^ statistics (Malacarne et al. 2023; Pinto et al. 2025). Indices lower than 25% indicated low heterogeneity among the studies, between 25% and 75% moderate, and above 75% high. The analyses were performed using the RevMan software Version 5.4.1 (The Cochrane Collaboration, Oxford, UK) (Malacarne et al. 2023; Pinto et al. 2025).
Results
7
Study Selection
7.1
Our initial search of relevant literature identified 74 studies related to COWs; however, 32 of these were duplicates and were excluded from further review. After evaluating the titles and abstracts, 21 studies were found to be unrelated to the focus of this review and were subsequently discarded. This exclusion criterion included reviews, case reports, commentaries, editorials, non‐English publications, and letters to the editor. The full texts of 21 studies were carefully reviewed by the authors (Figure 1).
The flow chart of the study.
General Characteristics of the Included Studies
7.2
The most important characteristics of the evaluated studies can be visualized in Table 2. A total of 21 studies were evaluated, 13 being conducted in China, two in Taiwan, and one in each of the following countries: Egypt, India, Turkey, Germany, Netherlands, and Slovakia. Different exposure times were reported and duly presented in Table 2.
Variables Related to Occupation Reported and PAHs
7.3
All included studies performed some verification of genotoxic outcomes induced by coke oven following occupational exposure. All studies (11 out of 21) performed the micronucleus assay using peripheral blood or buccal mucosa cells and some performed other analyses outside the scope of this review. Between the studies carried out, only 8 out of 21 performed comet assay to evaluate genotoxic damage. Among them, Marczynski et al. (2002), van Delft et al. (2001), Kalina et al. (1998), and Wang et al. (2010) used peripheral blood, while van Delft et al. (2001) also included urothelial cells in their analysis (Table 3).
Regarding the number of cells evaluated per individual in the micronucleus assays, eight studies evaluated 1000 cells, two evaluated 2000 cells, and one did not report the exact number. All studies used cell count to analyze data (11 out of 11). Moreover, each included study considered inclusion criteria and properly described the statistical tests used for data analysis (Table 3).
Main Results
7.4
All included studies reported adverse effects associated with occupational exposure to PAHs in COWs, with alterations detected at genotoxic, molecular, and clinical levels (Table 4). Elevated micronucleus frequency in peripheral blood lymphocytes was a common finding in several studies (Li et al. 2015; Dai et al. 2014; Sureshkumar et al. 2013; Ada et al. 2013; Cheng et al. 2009; Qiu et al. 2007; Cheng et al. 2007; Cheng et al. 2007; Leng et al. 2004; Leng et al. 2005). Additionally, increased CAs and SCEs were reported, indicating further chromosomal damage (Sureshkumar et al. 2013; Ada et al. 2013; Qiu et al. 2007; Marczynski et al. 2002; van Delft et al. 2001; Kalina et al. 1998). Increased tail moment, a marker of DNA strand breaks, was observed in exposed workers as described by (Huang et al. 2012; Chen et al. 2006; Wang et al. 2010; Yang et al. 2009; Yang et al. 2008). DNA adduct formation (BPDE‐DNA and BPDE‐albumin), an early marker of genotoxic exposure, was reported in several studies (Samir et al. 2019; Dai et al. 2014; Huang et al. 2012; Yang et al. 2009). Elevated levels of 8‐OHdG, an indicator of oxidative stress, were also found (Samir et al. 2019; Dai et al. 2014; Wu et al. 2004; Marczynski et al. 2002). Regarding genetic polymorphisms, variants in DNA repair genes (XRCC1, ERCC1, ERCC2, APEX1, XPC, XPA) (Samir et al. 2019; Li et al. 2015; Sureshkumar et al. 2013; Wang et al. 2010; Cheng et al. 2009; Cheng et al. 2007; Leng et al. 2004), xenobiotic metabolism genes (GSTP1, GSTM1, CYP2B6, mEH) (Huang et al. 2012; Qiu et al. 2007; Leng et al. 2004; Kalina et al. 1998), and cellular stress response genes (HSP70‐1, FEN1) (Yang et al. 2009, 2008) were evaluated and associated with genotoxic effects induced by PAHs.
Exposure biomarkers such as 1‐OHP and airborne PAHs (B[a]P, BSM) were frequently reported in exposed workers (Samir et al. 2019; Dai et al. 2014; Huang et al. 2012; Chen et al. 2006; Wang et al. 2010; Cheng et al. 2009; Yang et al. 2008; Qiu et al. 2007; Cheng et al. 2007; Leng et al. 2004; Leng et al. 2005; Wu et al. 2004; Marczynski et al. 2002; van Delft et al. 2001). Factors such as smoking, age, and exposure duration were also reported as relevant modulators of genotoxic effects (Li et al. 2015; Dai et al. 2014; Sureshkumar et al. 2013; Huang et al. 2012; Cheng et al. 2009; Yang et al. 2009; Yang et al. 2008; Cheng et al. 2007; Leng et al. 2004).
Quality Assessment
7.5
The quality assessment is described in Table 5. According to the adopted criteria, a total of 18 studies were classified as Strong, and three (out of 21) were deemed as Moderate. No study was categorized as Weak.
Data Synthesis
7.6
Meta‐analysis was performed in six studies. The other studies were removed from the meta‐analysis because the SD data were not shown and there was a need for more groups for proper comparison. The forest plot was used to graphically display effect sizes and 95% CIs. A two‐tailed p < 0.05 was used to determine the statistical significance. Heterogeneity was assessed with Cochran's Q test and quantified with the I ^2^ index.
A meta‐analysis was performed for MN and CA analyses, with different forest plots. The MN studies differed statistically significantly between COWs and Control (SMD = 0.70, 95% CI, 0.26–1.15, p = 0.002), with a Tau^2^ = 0.18, Chi^2^ = 51.43, p‐value < 0.001, and the I ^2^ = 94% (Figure 2).
Meta‐analysis from studies using the micronucleus assay.
The outcome of the CA studies differed statistically significantly between COWs and Control (SMD = 0.86, 95% CI, 0.34–1.38, p = 0.01), with a Tau^2^ = 0.18, Chi^2^ = 51.43, p = 0.001, and the I ^2^ = 85% (Figure 3).
Meta‐analysis from studies using the comet assay.
For both analyses, according to the meta‐analysis, the “diamond” of the forest graph is shifted to the right side of the null line expressed in the graph. Therefore, the control group differed statistically significantly from the COWs group (p < 0.001) and with an increase in micronuclei for the COWs group.
Discussion
8
This SR aimed to assess the genotoxic effects of occupational exposure to PAHs in COWs. A total of 21 studies were analyzed, most investigating genotoxic biomarkers such as micronucleus frequency, CAs, SCEs, comet assay tail moment, and oxidative DNA damage indicated by 8‐OHdG.
All studies consistently reported adverse effects associated with PAH exposure, confirming the high genotoxic potential of COEs. Micronuclei frequency was one of the most frequently reported biomarkers, elevated in multiple studies, including those by Leng et al. (2005) and Leng et al. (2004), highlighting chromosomal instability as a common consequence of occupational exposure. Similarly, increased CAs and SCEs were observed, demonstrating that PAHs not only induce DNA strand breaks but also affect the structural integrity of chromosomes. Tail moment analysis in comet assays further revealed extensive DNA strand breaks in peripheral blood lymphocytes, reinforcing the genotoxic profile of PAHs. Oxidative DNA damage, measured by 8‐OHdG, was consistently elevated, suggesting that oxidative stress is a central mechanism mediating PAH‐induced genotoxicity.
The results are in line with previous reports on occupational PAH exposure in other industrial settings. For instance, Baan et al. (2006) highlighted the carcinogenic potential of PAHs and emphasized their genotoxic properties in industrial workers. These studies suggest that the genotoxic effects observed are biologically consistent and likely reflect true occupational risks rather than artifacts of study design. Furthermore, a meta‐analysis was conducted, given that the data mining process was possible for studies with MN and CA. In both analyses, COWs showed genotoxic potential for large effect, despite the high heterogeneity.
Although all studies were able to induce genotoxicity in COWs, differences in exposure assessment methods, population genetics, or study design may interfere with data interpretation with accuracy. Importantly, genetic polymorphisms involved particularly in detoxification genes like glutathione S‐transferase M1 (GSTM1) and T1 (GSTT1) have been proposed as modifiers of individual susceptibility to PAH‐induced DNA damage (Rebbeck 1997). This is because genetic polymorphisms in genes involved in xenobiotic metabolism, DNA repair, and oxidative stress response can significantly influence individual susceptibility to the genotoxic effects of occupational exposure to PAHs (Bolt and Thier 2006). Variants that result in reduced or absent enzymatic activity may impair the body's ability to detoxify reactive metabolites, increasing the risk of DNA damage and cancer development (Kihara et al. 1993; Nazar‐Stewart et al. 1993). Epidemiological studies have suggested that such genetic differences may modulate the biological response to PAHs, particularly in occupational settings; however, findings remain inconsistent across different study populations and designs (Kalina et al. 1998; Pavanello et al. 1999). The observed effects were often modulated by genetic polymorphisms in genes involved in DNA repair, xenobiotic metabolism, and stress response pathways. For instance, variants in XRCC1, ERCC1, ERCC2, APEX1, and XPC were associated with differential susceptibility to DNA damage (Fenech 2007). Polymorphisms in xenobiotic‐metabolizing enzymes, such as GSTM1, GSTP1, mEH, and CYP2B6, were also shown to influence the formation of DNA adducts and the efficiency of detoxification, leading to inter‐individual variability in biomarker levels. Moreover, cellular stress response genes such as HSP70 and FEN1 appeared to play a role in modulating the extent of DNA damage and repair capacity in exposed workers. These findings underscore the importance of considering genetic susceptibility when assessing occupational risk and support the potential utility of personalized biomonitoring strategies in high‐risk environments. On the other hand, the role of genetic susceptibility in modulating this association remains underexplored and is complicated by heterogeneity across studies.
According to established guidelines for genotoxicity assays, the minimum number of cells to be analyzed is 1000 lymphocytes for the micronucleus assay in peripheral blood, while the comet assay requires at least 50 cells per individual (Collins and Dobson 2009). Ensuring compliance with these methodological thresholds is essential for consistent and comparable genotoxicity evaluation in occupational settings. Studies that did not adhere to these standards were flagged during quality assessment, contributing to lower scores, reflecting concerns about the reliability and reproducibility of genotoxicity measurements. Reviewing the included studies, most complied with the lymphocyte standard, and the comet assay was performed according to the minimum cell requirement in all studies which informed the amount of evaluated cells.
Regarding the quality assessment, we understand our findings can be considered reliable since all studies were deemed as either Strong or Moderate. No study was categorized as weak. This means that the information available in the literature within the field is robust and consistent, since all studies do not present relevant bias following the experimental design.
Despite the consistent evidence of genotoxicity, some limitations were identified. Some studies lacked proper cytotoxicity analyses, positive and negative controls, or blinded evaluations, which may introduce bias and affect the reliability of results. Differences in sample size, demographic characteristics, and exposure assessment methods complicate direct comparisons between studies. Furthermore, most studies were cross‐sectional, limiting the ability to infer causal relationships and long‐term health outcomes. Notably, lifestyle factors such as smoking, alcohol consumption, age, and duration of occupational exposure were frequently identified as modifiers of genotoxic outcomes, highlighting the need for comprehensive exposure and confounder assessment.
The evidence supports the role of both environmental exposure and genetic susceptibility in modulating these outcomes. In conclusion, occupational exposure to PAHs in COWs is consistently associated with genotoxic effects, including chromosomal instability, DNA strand breaks, oxidative DNA damage, and the formation of DNA adducts. To improve worker safety and the quality of research, future studies should employ longitudinal designs, standardized biomarker assessments, robust control groups, and blinded analyses. Routine biomonitoring using validated genotoxicity and exposure biomarkers, combined with assessment of genetic susceptibility, may enhance early detection of adverse effects. Employers and regulatory agencies should prioritize engineering controls, effective personal protective equipment, and periodic health surveillance to mitigate PAH exposure and reduce long‐term genotoxic risk among workers.
Author Contributions
Study design: T.G.P. and D.A.R. Data search: T.G.P., V.F.N., G.A.H.G., R.A.S., and D.A.R. Data analysis: T.G.P., V.F.N., G.A.H.G., R.A.S., and D.A.R. Meta‐analysis: W.M.T. Writing the paper: T.G.P., V.F.N., G.A.H.G., W.M.T., R.A.S., A.C.M.M., L.L.G., and D.A.R.
Funding
The authors acknowledge research grants received from CNPq (Conselho Nacional de Desenvolvimento Científico e Tecnológico, Grant Number #001) for a productivity fellowship (D.A.R.).
Ethics Statement
The authors have nothing to report.
Consent
The authors have nothing to report.
Conflicts of Interest
The authors declare no conflicts of interest.
The reference list from the paper itself. Each links out to its DOI / PubMed record.
- 1Ada, A. O. , C. Demiroglu , M. Yilmazer , et al. 2013. “Cytogenetic Damage in Turkish Coke Oven Workers Exposed to Polycyclic Aromatic Hydrocarbons: Association With CYP 1A 1, CYP 1B 1, EPHX 1, GSTM 1, GSTT 1, and GSTP 1 Gene Polymorphisms.” Archives of Industrial Hygiene and Toxicology 64, no. 3: 359–369. 10.2478/10004-1254-64-2013-2328.24084344 · doi ↗ · pubmed ↗
- 2Baan, R. , Y. Grosse , K. Straif , et al. 2006. “Carcinogenicity of Coal‐Tar Pitch, Benzene, and PA Hs in Occupational Settings.” Lancet Oncology 7, no. 12: 1019–1020. 10.1016/S 1470-2045(06)71008-2. · doi ↗
- 3Bolt, H. M. , and R. Thier . 2006. “Relevance of the Deletion Polymorphisms of the Glutathione S‐Transferases GSTT 1 and GSTM 1 in Pharmacology and Toxicology.” Current Drug Metabolism 7, no. 6: 613–628. 10.2174/138920006778226473.16918316 · doi ↗ · pubmed ↗
- 4Bonassi, S. , H. Norppa , M. Ceppi , et al. 2008. “Chromosomal Aberration Frequency in Lymphocytes Predicts the Risk of Cancer: Results From a Pooled Cohort Study of 22,358 Subjects in 11 Countries.” Carcinogenesis 29, no. 6: 1178–1183. 10.1093/carcin/bgn 119.18356148 PMC 2443275 · doi ↗ · pubmed ↗
- 5Bonassi, S. , A. Znaor , M. Ceppi , et al. 2007. “An Increased Micronucleus Frequency in Peripheral Blood Lymphocytes Predicts the Risk of Cancer in Humans.” Carcinogenesis 28, no. 3: 625–631. 10.1093/carcin/bgl 188.16973674 · doi ↗ · pubmed ↗
- 6Chen, Y. , Y. Bai , J. Yuan , et al. 2006. “Association of Polymorphisms in Ah R, CYP 1A 1, GSTM 1, and GSTT 1 Genes With Levels of DNA Damage in Peripheral Blood Lymphocytes Among Coke‐Oven Workers.” Cancer Epidemiology, Biomarkers & Prevention 15, no. 9: 1703–1707. 10.1158/1055-9965.16985033 · doi ↗ · pubmed ↗
- 7Cheng, J. , S. Leng , Y. Dai , et al. 2007. “Association Between Nucleotide Excision Repair Gene Polymorphisms and Chromosomal Damage in Coke‐Oven Workers.” Biomarkers 12, no. 1: 76–86. 10.1080/13547500600950168.17438655 · doi ↗ · pubmed ↗
- 8Cheng, J. , S. Leng , H. Li , et al. 2009. “Suboptimal DNA Repair Capacity Predisposes Coke‐Oven Workers to Accumulate More Chromosomal Damages in Peripheral Lymphocytes.” Cancer Epidemiology, Biomarkers & Prevention 18, no. 3: 987–993. 10.1158/1055-9965.19240242 · doi ↗ · pubmed ↗