Chromosomal instability as a predictive biomarker for recurrence risk following transurethral resection of NMIBC
Qi Ding, Hailiang Zhu, Bo Fan, Lisheng Wang, Xiaohua Jin, Cheng Cao, Ying Shi, Zhijiang Fan, Wenjian Tu, Feng Li

TL;DR
This study shows that chromosomal instability in bladder cancer tumors can predict the risk of cancer recurrence after surgery, especially within 2 to 5 years.
Contribution
The study demonstrates that chromosomal instability (CIN) is a novel independent predictor of bladder cancer recurrence after transurethral resection.
Findings
High CIN is significantly associated with tumor recurrence and worse prognosis (median RFS: 22 months vs. unreached in low-CIN group).
CIN values show good predictive performance for recurrence between the 2nd and 5th years post-surgery.
Single-chromosome copy number abnormalities are linked to worse outcomes (median RFS: 16–23 months).
Abstract
To investigate chromosomal instability (CIN) in tumor tissues from transurethral resection of bladder tumor (TURBT) and evaluate its feasibility as a molecular biomarker for prognostic stratification in non-muscle-invasive bladder cancer (NMIBC). In this retrospective single-center cohort study, DNA was extracted from formalin-fixed paraffin-embedded (FFPE) samples of 50 BC patients using the Qiagen nucleic acid extraction kit. The recurrence defined in this study refers to cystoscopically visible recurrence confirmed by biopsy or surgical pathology. All patients underwent follow-up until January 2025 in strict accordance with the protocol established by the EAU guidelines for NMIBC. Low-coverage whole-genome sequencing (LC-WGS) was performed to analyze CIN in bladder tumors. Time-dependent Receiver Operating Characteristic (ROC) analysis was performed to evaluate the predictive…
Genes, proteins, chemicals, diseases, species, mutations and cell lines named across the full text — each resolved to its canonical identifier and authoritative record.
Click any figure to enlarge with its caption.
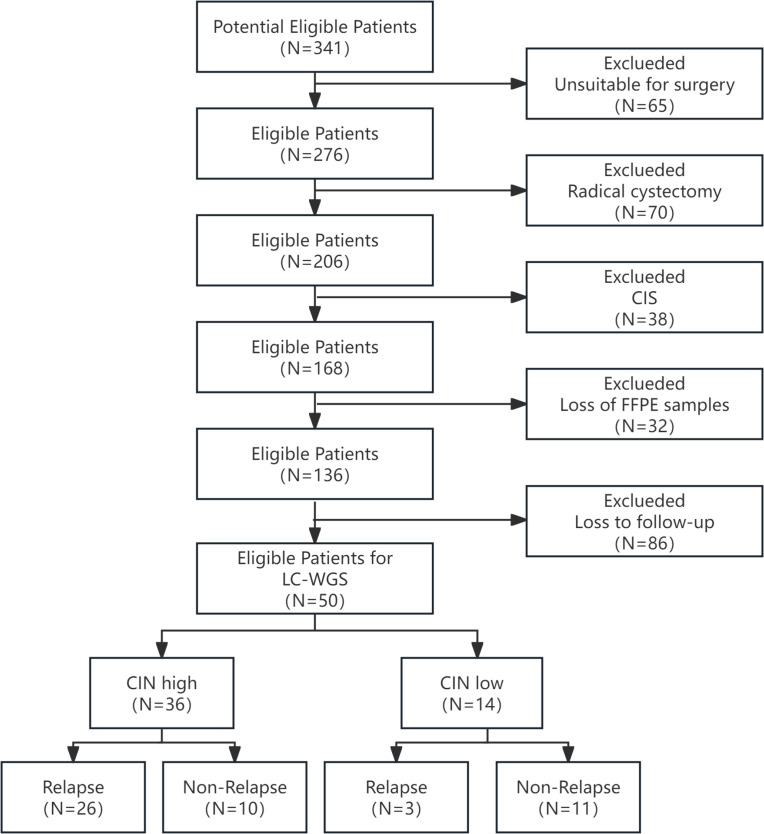 Figure 1
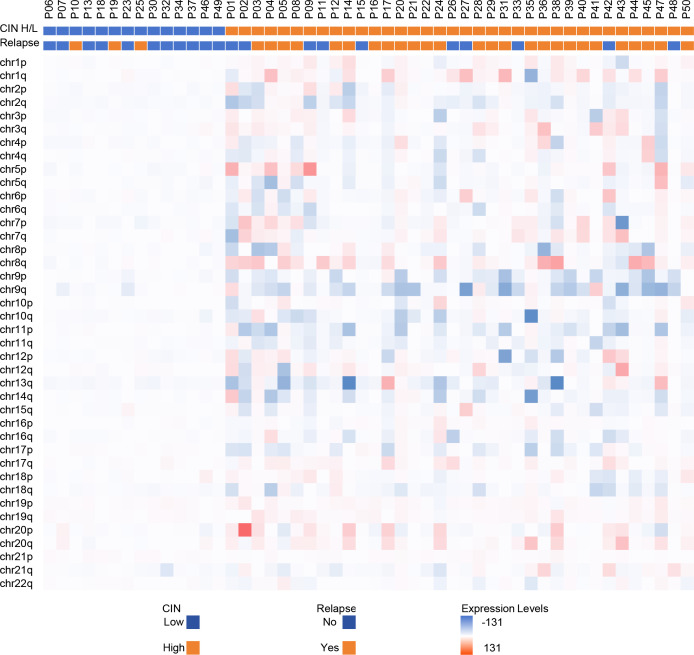 Figure 2
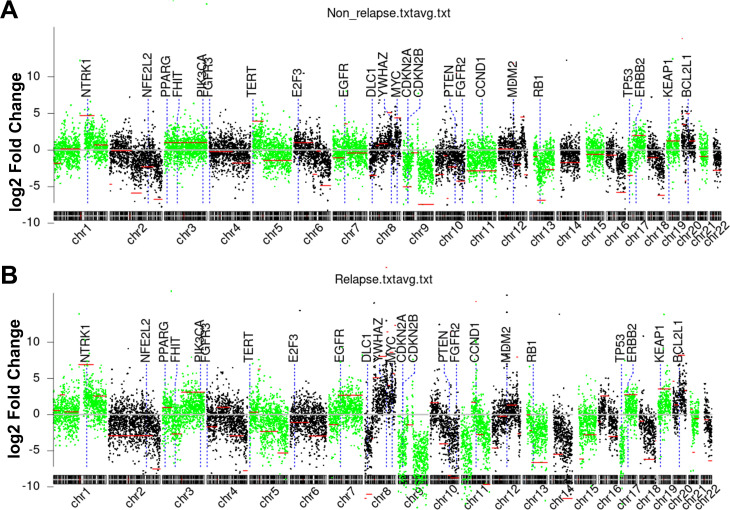 Figure 3
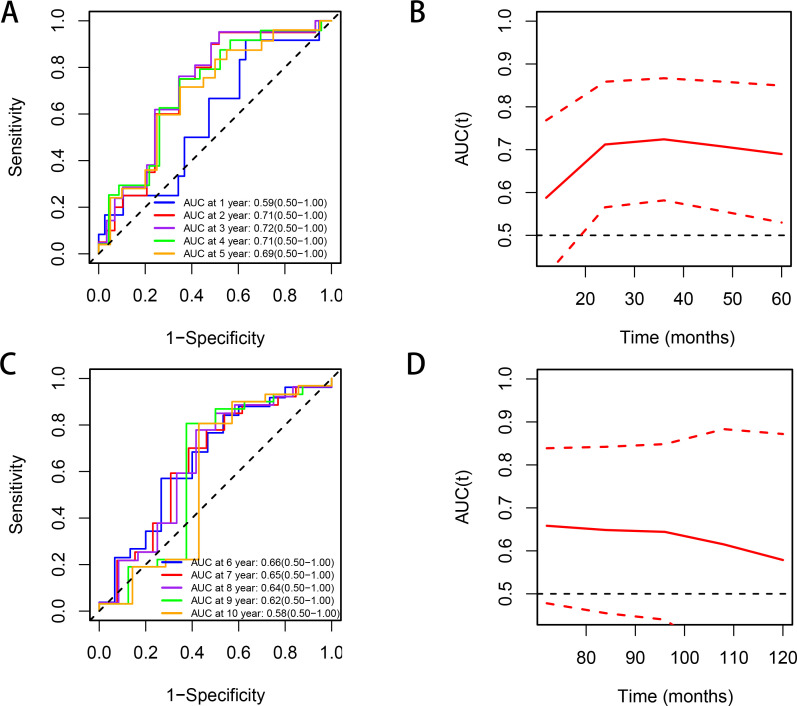 Figure 4
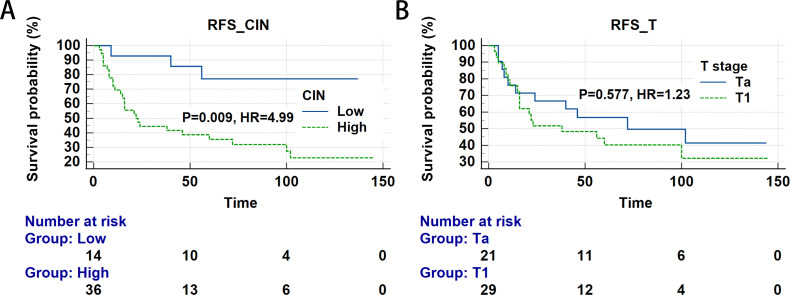 Figure 5
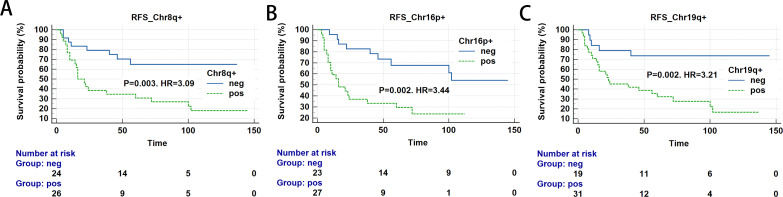 Figure 6
| Patients | |||
|---|---|---|---|
| Variables | Relapse | Non-relapse | P-value |
| (n=29) | (n=21) | ||
| Age | 69.24±11.43 | 66.33±10.11 | 0.357 |
| ≤68 years | 15(57.7%) | 11(42.3%) | 0.963 |
| >68 years | 14(58.3%) | 10(41.7%) | |
| Sex | 0.561 | ||
| Male | 23(56.10%) | 18(43.90%) | |
| Female | 6(66.67%) | 3(33.33%) | |
| Smoking History | |||
| No | 25(64.10%) | 14(35.90%) | 0.100 |
| Yes | 4(36.36%) | 7(63.64%) | |
| Tumor Size | 2.99±1.24 | 2.51±1.14 | 0.175 |
| <3 cm | 13(50.0%) | 13(50.0%) | 0.233 |
| ≥3 cm | 16(66.67%) | 8(33.33%) | |
| Tumor count | |||
| Single | 13(52.00%) | 12(48.00%) | 0.390 |
| Multiple | 16(64.00%) | 9(36.00%) | |
| Tumor Grade | 0.598 | ||
| Low | 13(54.17%) | 11(45.83%) | |
| High | 16(61.54%) | 10(38.46%) | |
| Tumor Stage | 0.493 | ||
| Ta | 11(52.38%) | 10(47.62%) | |
| T1 | 18(62.07%) | 11(37.93%) | |
| Intravesical drugs | 0.255 | ||
| BCG | 4(50.00%) | 4(50.00%) | |
| Gemcitabine | 18(58.06%) | 13(41.94%) | |
| Hydroxycamptothecin | 3(100%) | 0(0%) | |
| Mitomycin | 2(33.33%) | 4(66.67%) | |
| Pirarubicin | 2(100%) | 0(0%) | |
| Chromosome | Loc.Start | Loc.End | Seg.Mean | log10(P)a | Key Genes |
|---|---|---|---|---|---|
| chr9 | 71,000,000 | 141,000,000 | -4.58 | -175.2 | |
| chr11 | 0 | 47,800,000 | -3.70 | -141.7 | |
| chr14 | 61,800,000 | 107,000,000 | -2.95 | -131.3 | |
| chr9 | 0 | 39,000,000 | -3.61 | -103.6 |
|
| chr17 | 0 | 21,600,000 | -3.45 | -62.6 |
|
| chr11 | 103,400,000 | 134,800,000 | -2.52 | -60.9 | |
| chr8 | 8,200,000 | 33,200,000 | -2.90 | -58.2 |
|
| chr10 | 0 | 39,000,000 | 0.38 | -57.4 | |
| chr8 | 66,600,000 | 99,400,000 | 2.03 | -52.1 |
|
| chr20 | 24,800,000 | 55,000,000 | 2.20 | -50.7 | |
| chr7 | 44,800,000 | 158,800,000 | 0.62 | -41.2 |
|
| chr15 | 20,000,000 | 102,200,000 | -0.93 | -40.6 | |
| chr5 | 132,600,000 | 180,600,000 | -1.39 | -33.0 | |
| chr4 | 172,400,000 | 189,800,000 | -2.14 | -30.4 | |
| chr10 | 97,000,000 | 135,200,000 | -2.32 | -29.5 |
|
| chr8 | 103,800,000 | 109,200,000 | 2.69 | -29.3 | |
| chr3 | 44,000,000 | 89,600,000 | -0.77 | -28.5 |
|
| chr16 | 10,200,000 | 48,600,000 | 0.74 | -26.9 | |
| chr14 | 19,000,000 | 61,600,000 | -1.46 | -26.9 | |
| chr12 | 0 | 28,200,000 | -1.15 | -25.1 | |
| chr18 | 21,200,000 | 71,000,000 | -1.76 | -25.0 | |
| chr6 | 200,000 | 88,000,000 | -0.29 | -24.4 | |
| chr3 | 89,800,000 | 197,800,000 | 0.81 | -24.3 |
|
| chr8 | 38,800,000 | 66,400,000 | 1.30 | -23.0 | |
| chr10 | 83,800,000 | 96,200,000 | -2.28 | -22.3 |
|
| chr19 | 0 | 58,800,000 | 0.93 | -21.9 |
|
| chr5 | 0 | 40,200,000 | 0.03 | -19.7 |
|
| chr5 | 50,000,000 | 132,400,000 | -0.77 | -19.0 | |
| chr16 | 48,800,000 | 90,000,000 | -0.86 | -16.9 | |
| chr1 | 118,800,000 | 187,800,000 | 1.85 | -16.3 |
|
| chr1 | 200,000 | 29,600,000 | 0.12 | -15.2 | |
| chr20 | 55,200,000 | 62,800,000 | 1.17 | -14.0 |
|
| chr13 | 41,600,000 | 114,800,000 | -1.80 | -13.7 |
|
| chr8 | 140,800,000 | 146,000,000 | 3.18 | -12.1 | |
| chr8 | 99,600,000 | 103,600,000 | 5.03 | -11.9 | |
| chr1 | 188,000,000 | 249,000,000 | 0.75 | -11.9 | |
| chr8 | 109,400,000 | 118,000,000 | 0.94 | -11.3 | |
| chr4 | 108,000,000 | 172,200,000 | -0.77 | -9.3 | |
| chr11 | 68,200,000 | 70,400,000 | 4.38 | -8.9 |
|
| chr8 | 118,200,000 | 132,800,000 | 2.53 | -8.8 |
|
| chr11 | 48,000,000 | 68,000,000 | 0.43 | -7.8 | |
| chr10 | 42,800,000 | 83,600,000 | -1.09 | -7.7 | |
| chr8 | 200,000 | 6,800,000 | -3.12 | -7.7 | |
| chr12 | 71,000,000 | 114,800,000 | 0.36 | -7.2 | |
| chr21 | 19,400,000 | 28,400,000 | -1.43 | -7.1 | |
| chr2 | 0 | 207,600,000 | -0.78 | -6.2 |
|
| chr22 | 36,000,000 | 51,000,000 | -1.70 | -6.0 | |
| chr18 | 71,200,000 | 76,200,000 | -3.54 | -6.0 | |
| chr1 | 30,800,000 | 53,400,000 | 0.80 | -4.9 | |
| chr10 | 42,200,000 | 42,600,000 | 6.76 | -4.2 | |
| chr4 | 48,200,000 | 55,000,000 | 1.82 | -4.1 | |
| chr1 | 53,600,000 | 118,600,000 | 0.06 | -3.7 | |
| chr12 | 69,000,000 | 70,800,000 | 7.14 | -3.6 |
|
| chr8 | 133,000,000 | 140,600,000 | 1.05 | -3.6 | |
| chr4 | 0 | 48,000,000 | -0.52 | -3.5 |
|
| chr8 | 33,400,000 | 38,600,000 | -0.77 | -3.4 | |
| chr4 | 190,000,000 | 190,800,000 | 0.18 | -2.8 | |
| chr17 | 21,800,000 | 80,800,000 | 0.71 | -2.8 |
|
| chr13 | 19,000,000 | 41,400,000 | -0.32 | -2.4 | |
| chr7 | 0 | 44,600,000 | -0.41 | -2.1 | |
| chr9 | 40,000,000 | 70,800,000 | -0.11 | -1.8 | |
| chr12 | 115,000,000 | 120,400,000 | 2.09 | -1.7 | |
| chr22 | 16,000,000 | 35,800,000 | -0.18 | -1.7 | |
| chr21 | 9,400,000 | 19,200,000 | 0.06 | -1.5 | |
| chr16 | 0 | 10,000,000 | -0.32 | -1.5 | |
| chr11 | 70,600,000 | 103,200,000 | -0.70 | -1.4 | |
| chr12 | 28,400,000 | 68,800,000 | -0.05 | -1.3 |
| CIN | ||||
|---|---|---|---|---|
| Variables | High | Low | Total | P-value |
| (n=36) | (n=14) | |||
| CIN | 23672.44(13114.66,38664.64) | 3200.80(1737.12,3829.94) | 14973.90(4242.72,31184.90) |
|
| Age | 68.39±11.73 | 67.07±8.66 | 68.02±10.89 | 0.705 |
| ≤68 years | 20(76.92%) | 6(23.08%) | 26 | 0.420 |
| >68 years | 16(66.67%) | 8(33.33%) | 24 | |
| Gender | 1.000* | |||
| Female | 7(77.78%) | 2(22.22%) | 9 | |
| Male | 29(70.73%) | 12(29.27%) | 41 | |
| Smoking History | 0.476* | |||
| No | 29(74.36%) | 10(25.64%) | 39 | |
| Yes | 7(63.64%) | 4(36.36%) | 11 | |
| Tumor size (cm) | 0.086 | |||
| <3 | 16(61.54%) | 10(38.46%) | 26 | |
| ≥3 | 20(83.33%) | 4(16.67%) | 24 | |
| Tumor count | 1.000 | |||
| Single | 18(72.00%) | 7(28.00%) | 25 | |
| Multiple | 18(72.00%) | 7(28.00%) | 25 | |
| Tumor grade |
| |||
| Low | 14(58.33%) | 10(41.67%) | 24 | |
| High | 22(84.62%) | 4(15.38%) | 26 | |
| Tumor Stage | 0.939 | |||
| Ta | 15(71.43%) | 6(28.57%) | 21 | |
| T1 | 21(72.41%) | 8(27.59%) | 29 | |
| Relapse |
| |||
| Yes | 26(89.66%) | 3(10.34%) | 29 | |
| No | 10(47.62%) | 11(52.38%) | 21 | |
| Variables | Group | Relapse | Median | P-value | HR (95%CI) | ||
|---|---|---|---|---|---|---|---|
| Yes | No | RFS | |||||
| CIN | low | 3 | 11 | – | – | Reference | |
| high | 26 | 10 | 22 |
|
| ||
| Tumor stage | Ta | 11 | 10 | 72 | Reference | ||
| T1 | 18 | 11 | 38 | 0.577 | 1.23 (0.59-2.57) | ||
| Variables | Univariate | Multivariate | ||
|---|---|---|---|---|
| HR (95%CI) | P-value | HR (95%CI) | P-value | |
| Tumor grading | ||||
| Low | Reference | Reference | ||
| High | 1.23 (0.59-2.57) | 0.577 | 0.89 (0.42-1.91) | 0.766 |
| Intravesical drugs | ||||
| BCG | Reference | Reference | ||
| non-BCG drugs | 1.19 (0.83-1.70) | 0.336 | 1.19 (0.82-1.73) | 0.360 |
| CIN | ||||
| Low | Reference | Reference | ||
| High |
|
|
|
|
| Chromosome | AUC | P-value | Z score cutoff | 95% CI for AUC |
|---|---|---|---|---|
| chr16p | 0.691 |
| 1.568 |
|
| chr19q | 0.691 |
| 3.227 |
|
| chr8q | 0.666 |
| 2.371 |
|
| Chromosome | Status | Relapse | Median RFS | P-value | HR (95%CI) | |
|---|---|---|---|---|---|---|
| Yes | No | |||||
| 8q+ | negative | 8 | 16 | – | – | Reference |
| positive | 21 | 5 | 16 |
|
| |
| 16p+ | negative | 9 | 14 | – | Reference | |
| positive | 20 | 7 | 16 |
|
| |
| 19q+ | negative | 5 | 14 | – | – | Reference |
| positive | 24 | 7 | 23 |
|
| |
Peer Reviews
No public reviews on file for this paper yet. If you reviewed it on a platform where reviews are public (OpenReview, ICLR, NeurIPS, ICML), you can paste yours below so the community can read it here.
Videos
No videos yet. Explain this paper in a talk, walkthrough, or lecture? Add one.
Taxonomy
TopicsBladder and Urothelial Cancer Treatments · Urinary and Genital Oncology Studies · Genomic variations and chromosomal abnormalities
Introduction
Bladder cancer (BC) represents one of the most prevalent urological malignancies worldwide, with non-muscle-invasive bladder cancer (NMIBC) [including Ta, T1, and carcinoma in situ (CIS)] accounting for approximately 75% of newly diagnosed cases (1).
The primary treatment for NMIBC consists of transurethral resection of bladder tumor (TURBT), supplemented by postoperative intravesical chemotherapy or Bacillus Calmette-Guérin (BCG) immunotherapy. However, the five-year recurrence rate remains alarmingly high (31%–78%) (2). Current risk stratification relies predominantly on clinicopathological parameters including tumor stage, WHO 2004/2016 grade, tumor size, and multifocality (3), yet these exhibit limited predictive accuracy. There is an urgent need for novel biomarkers to optimize prognostic prediction.
Chromosomal instability (CIN) refers to the persistent gain or loss of large genomic segments, manifesting in two distinct forms: structural CIN and numerical CIN (4). Compared to general genetic biomarkers, CIN—characterized by chromosomal arm-level gains/losses or arm-level copy number variations—encompasses multiple oncogenes or tumor suppressor genes, offering a more macroscopic perspective on the entire genome. It reflects extensive dysregulation within tumor signaling pathways that disrupts chromosome segregation during mitosis (5). Multiple mechanisms can induce CIN, including oncogenic signaling, centrosome duplication defects, defective spindle assembly checkpoint signaling, and impaired microtubule-kinetochore attachments (4). As a hallmark feature of cancer genomes, CIN drives intratumoral heterogeneity and accelerates adaptive evolution under therapeutic pressure (6).
Recent studies demonstrate that CIN correlates with poor clinical outcomes in multiple malignancies, including colorectal (7), breast (8), pancreatic (9), and liver cancers (10). Chromosomal abnormalities involving chromosomes 3, 8, 9, 11, 13, and 17 have been identified in BC (11). Recent advances in low-coverage whole genome sequencing (LC-WGS) have enabled high-resolution, cost-effective analysis of CIN in tumor tissues (12). These technological breakthroughs provide new opportunities to dynamically monitor CIN and evaluate its clinical relevance in real time. Our earlier work identified CIN as a clinically significant prognostic biomarker in patients underwent radical cystectomy (13). However, the predictive value of CIN for post-TURBT recurrence remains insufficiently explored. Elucidating the role of CIN in predicting recurrence after TURBT may help identify candidates for intensified surveillance. Such risk stratification could enable earlier detection and timely intervention, thereby improving clinical outcomes and highlighting its clinical utility.
Studies demonstrate that LC-WGS is equally applicable to formalin-fixed paraffin-embedded (FFPE) specimens, achieving accuracy comparable to matched blood samples and yielding reliable results (14). Numerous studies employing LC-WGS for copy number analysis of DNA from FEEP specimens have been published (15, 16). This study aims to investigate the association between CIN burden derived from FFPE tissue samples and the risk of recurrence following TURBT. By integrating LC-WGS data from postoperative tumor tissues of 50 TURBT patients, we seek to establish CIN as a clinically actionable biomarker.
Materials and methods
Patient characteristics and ethical statement
This retrospective single-center cohort study enrolled FFPE tissue samples from 50 BC patients who underwent TURBT at the Department of Urology, Changshu Hospital Affiliated to Soochow University between December 2012 and January 2024. The inclusion criteria for this study were patients with NMIBC (Ta or T1), excluding CIS. Exclusion criteria included prior history of BC, previous intravesical therapy, non-urothelial carcinoma, incomplete follow-up, inadequate tissue/DNA samples, and low sequencing quality. Based on the EAU guidelines for NMIBC management, the post-TURBT instillation protocol is established as follows: For low-risk patients, administer a single immediate postoperative instillation of chemotherapeutic agents. For intermediate-risk patients, implement maintenance instillation with either chemotherapeutic agents or BCG for one year. For high-risk patients, employ BCG maintenance instillation for one year. The regimen for intravesical instillation of chemotherapeutic agents is once weekly for 8 doses, followed by once monthly for 10 doses. The BCG regimen comprises: Induction phase: Weekly instillation for 6 weeks. Consolidation phase: Biweekly instillation for 3 doses. Maintenance phase: Monthly instillation for 10 doses (17). All patients underwent follow-up in strict accordance with the protocol established by the EAU guidelines for NMIBC (1). The recurrence defined in this study refers to cystoscopically visible recurrence confirmed by biopsy or surgical pathology. All suspicious lesions underwent cystoscopic biopsy to determine the presence of recurrence. Follow-up data were collected until January 1, 2025. After obtaining informed consent, control samples, consisting of DNA extracted from urine sediment cells, were concurrently obtained from 11 healthy volunteers. The study protocol received approval from the Ethics Committee of Changshu Hospital Affiliated to Soochow University (Approval No. 2021-58), and all procedures complied with ethical standards. Based on Article 32 of the Declaration of Helsinki, this retrospective study utilizing FFPE tissue samples was granted an ethics waiver exempting the requirement for obtaining individual informed consent (18).
BC pathology
Histopathological examination was performed on samples from 50 BC patients to characterize tumors. Pathological grading followed the WHO 2004/2016 classification system, with all histopathological examinations performed by a single pathologist.
DNA extraction
Genomic DNA was isolated from FFPE tissue samples using the QIAamp DNA FFPE Tissue Kit (Qiagen; catalog no. 56404) according to the manufacturer’s instructions. The concentration of purified amplification products was quantified using a Qubit fluorometer with its corresponding kit. The calculated total library yield must meet or exceed 100.0 ng; otherwise, the library construction is invalid and requires repetition. Fragment size distribution was assessed using the Qsep series automated nucleic acid/protein analysis system. A qualified library must exhibit a primary peak between 180 bp and 1800 bp, with an average fragment size of 300.0 bp to 550.0 bp, where the primary peak constitutes ≥90.0% of the distribution. For sequencing data, each sample must yield ≥10 million reads (M = 10^6^), with ≥85% of bases achieving Q30 quality scores and ≥70% uniquely mapped reads. Failure to meet any sequencing metric necessitates re-sequencing.
Low−coverage whole−genome sequencing
Libraries for LC-WGS were prepared from DNA inputs (50–1000 ng) using Kappa Hyper kits (Roche, California, USA) combined with custom adapters (IDT, California, USA). Library concentration and fragment size distribution were assessed via fluorescence quantification and capillary electrophoresis, respectively. Purified libraries underwent high-throughput sequencing on the Illumina HiSeq XTen platform using 150-base paired-end reads per lane. Segmental copy number alterations (CNAs) were identified using the ultrasensitive chromosomal aneuploidy detector (UCAD), a bespoke bioinformatics pipeline enabling precise detection of CNAs. The specific parameter configuration and calculation methods for UCAD were based on previously published literature (19, 20). Samples with a median absolute deviation (MAD) of the genomic log copy ratio exceeding 0.38—indicating suboptimal sequencing quality—were excluded from analysis.
Statistical analyses
DNA was analyzed using the Illumina X10 system. Approximately 10 million paired-end reads per sample were aligned to the human reference genome (hg19) with BWA v0.7.17-r1188. Genomic coverage, assessed via the mpileup package, enabled precise read depth quantification. The average coverage for each 200-kb bin was calculated, and Z-scores normalized using the formula below.
Z_bin_: Standardized Z-score for a specific genomic bin; coverage_raw_: Raw coverage value of the bin under investigation; coverage_controls, raw_: Raw coverage values from control samples; mean(coverage_controls, raw_): Mean raw coverage value across control samples; stdev(coverage_controls, raw_): Standard deviation of raw coverage values in control samples.
Significant genomic breakpoints and copy number segments were identified using the Circular Binary Segmentation (CBS) algorithm (DNAcopy R package) (21). Categorical variables were analyzed using chi-square or Wilcoxon tests, as appropriate. The CIN score was calculated as CIN = sum(Lchr × Zchr), where Lchr is the chromosome segment length and Zchr is its Z-score. Time-dependent Receiver Operating Characteristic (ROC) analysis was performed to evaluate the predictive efficacy of CIN values for post-TURBT outcomes. The optimal cutoff value for CIN was determined using maximally selected rank statistics. Statistical significance was defined as P< 0.05.
Continuous variables conforming to a normal distribution are presented as mean ± standard deviation. Continuous variables with a skewed distribution are described using median (interquartile range). Categorical variables are expressed as frequency (percentage). Between-group comparisons for continuous variables were performed using the independent samples t-test or Mann-Whitney U test, based on their distribution characteristics. Categorical data were compared using the χ² test or Fisher’s exact test. The significance level (α) was set at 0.05 for all tests, which were two-sided. Survival analysis was conducted using Kaplan-Meier curves with log-rank testing. The proportional hazards assumption test was employed to evaluate the stability of the model. Lasso regression was used for variable selection. Cox proportional hazards regression models were used for multivariable analysis to assess the independent influence of variables on recurrence-free survival (RFS) time. The index date (“time zero”) for RFS is the date of TURBT. The concordance index (C-index) quantifies the predictive accuracy of survival models by calculating the probability that, for a randomly selected pair of subjects, the model’s predicted risk order aligns with the observed outcome order. The likelihood ratio test evaluates the goodness-of-fit between nested models by comparing the ratio of their maximized likelihood functions. Net Reclassification Improvement (NRI) assesses the incremental predictive utility of a new model versus a reference model by quantifying the net proportion of subjects reclassified correctly across risk strata.
Statistical analyses were performed using R (version 3.4.3; R Foundation for Statistical Computing), SPSS 17.0 (IBM, Foster City, CA, USA), and MedCalc (version 20.0; MedCalc Software, Mariakerke, Belgium).
Results
Patient characteristics
A total of 50 FFPE BC samples were included in this study, all of which passed quality control. Figure 1 presents the flowchart. The mean age of the relapse group was 69.24 ± 11.43, while that of the non-relapse group was 66.33 ± 10.11, with no statistically significant difference between the two groups. Furthermore, the relapse and non-relapse groups showed no statistically significant differences in gender, smoking history, tumor size, tumor number, tumor grade, tumor stage, or composition of intravesical drugs, as detailed in Table 1. Most baseline covariates had standardized differences below 0.20, confirming good group comparability. Notwithstanding a standardized difference of 0.296 for intravesical drugs, this covariate was included in subsequent multivariable regression models to adjust for its potential impact on the results.
The flowchart for participant recruitment.
Cancer genome of BC
The median coverage for all samples was 0.497 (interquartile range: Q1 = 0.422, Q3 = 0.558)(Supplementary Table 1). Comparative analysis revealed statistically significant CNAs in 67 gene segments of BC patients with recurrence relative to non-recurrence cases (Table 2). Hierarchical clustering of sample-level CNAs demonstrated distinct genomic patterns in the heatmap (Figure 2). Relapse group samples (orange) exhibited intensified red-blue signals, indicating marked CIN, whereas non-relapse counterparts (blue) showed attenuated variations, consistent with enhanced genomic stability.
Heatmap of chromosomal instability (CIN) profiles across bladder cancer patients stratified by relapse and CIN status. The color of each row indicates changes in chromosomal segments (red, copy gains; blue, copy losses).
Supplementary Table 2 details CIN scores and chromosome-specific abnormalities across tumors. In this study, a CIN cutoff value of 6486.722 was established, with samples above this threshold classified as high CIN and those below classified as low CIN. Among the 50 BC samples, 36 (72.0%) demonstrated high CIN and 14 (28.0%) exhibited low CIN (Table 3). Genome-wide CNA landscapes are summarized in Figure 3. Relapse patients (Figure 3B) displayed significantly broader CIN dispersion across chromosomal regions, indicating pervasive genomic instability. Notably, relapse cohorts harbored prominent CIN outliers at loci of key oncogenes [e.g., Tumor Protein p53 (TP53), Cyclin dependent kinase inhibitor 2 A (CDKN2A), Epidermal growth factor receptor (EGFR)], suggesting their mechanistic involvement in recurrence. Amplification (green) and deletion (negative value) events also occurred more frequently in this group genome-wide. Conversely, non-relapse cases (Figure 3A) manifested constrained CIN distributions with minimal fluctuations, reflecting structural stability.
Chromosomal instability (CIN) in bladder tumor tissue. (A) Non-relapsed patients; (B) Relapsed patients.
Association of molecular subtypes with tumor stage and survival outcome
Time-dependent receiver operating characteristic (ROC) analysis demonstrates that CIN values exhibit good predictive performance between the 2nd and 5th years, with AUC values around 0.7. Beyond the 6th year, the AUC gradually declines to approximately 0.6 (Figure 4).
Time-dependent ROC curves and AUC values (with 95% confidence bands) of the CIN score for predicting relapse. (A, B) years 1–5; (C, D) years 6–10.
As detailed in Table 3, molecular classification of tumor tissue was based on CIN levels. High CIN was associated with higher tumor grade and increased recurrence rate (P = 0.039 and P = 0.001, respectively), but showed no significant associations with age, gender, smoking history, tumor size, tumor stage or tumor count (all P > 0.05).
Association of CIN and tumor stage with RFS
Our analysis examined RFS across molecular subtypes. Figure 5A illustrates significantly distinct survival outcomes among these subtypes (Logrank test, P = 0.009). Specifically, the high CIN group exhibited a reduced RFS rate, with a median survival of 22 months, while low CIN patients demonstrated improved RFS. Patients with high CIN faced a significantly elevated relapse risk compared to the low CIN group (HR = 4.99, 95% CI: 1.51-16.54, P = 0.009; Table 4; Figure 5A). No significant difference in RFS was detected between Ta and T1 stages (HR = 1.23, 95% CI: 0.59-2.57, P = 0.577; Table 4; Figure 5B).
Relationship between chromosomal instability (CIN), T stage and survival of patients with bladder cancer (Time measured in months). (A) recurrence-free survival (RFS) for CIN; (B) RFS for T staging.
Utilizing Lasso regression analysis, we identified CIN as the sole covariate. Consequently, we excluded covariates such as age, gender, tumor size, and tumor number. Multivariate Cox regression analysis, incorporating tumor grade, intravesical drugs, and CIN level (high/low) as covariates, revealed that high CIN was an independent prognostic factor for RFS (HR = 5.22, 95% CI: 1.52-17.93, P = 0.009)(Table 5). We used the proportional hazards assumption test to evaluate the stability of the model. The results showed that the p-values for the covariates tumor grade, intravesical drugs, and CIN level (high/low) were 0.433, 0.635, and 0.908, respectively, and the global test p-value was 0.797, indicating that the model is stable and reliable.
We further compared the predictive performance of the EAU risk stratification for NMIBC and CIN for recurrence. The prognostic model based on the new European Association of Urology prognostic-factor risk groups for non–muscle-invasive BC using either the WHO 2004/2016 or WHO 1973 grading classification system achieved a C-index of 0.573. In contrast, the prognostic prediction model constructed using the CIN classification yielded a superior C-index of 0.635. The likelihood ratio test demonstrated that incorporating the CIN grouping variable into the EAU prognostic risk model significantly improved model fit (chi-square value=9.503, df=1, P = 0.002). With a NRI of 0.704, the CIN grouping variable substantially enhanced the predictive capability of the model.
Prognostic value of the Z chromosome score for survival outcomes
To assess the prognostic value of Z chromosome score in BC survival, we calculated their predictive performance. Chromosome arms 16p, 19q, and 8q demonstrated the highest predictive accuracy, with AUCs of 0.691, 0.691, and 0.666, respectively (Table 6). We subsequently evaluated RFS in patients exhibiting amplification or deletion of single chromosome arms. Patients harboring specific CNAs—gains in 8q+, 16p+, 19q+ experienced significantly poorer outcomes, evidenced by a median RFS of 16 to 23 months. In contrast, patients without these specific alterations exhibited markedly longer RFS (Table 7; Figure 6).
Single chromosomal arm copy number variations (CNVs) associated with worse recurrence-free survival (RFS)(Time measured in months). (A) RFS for chr8q+; (B) RFS for chr16p+; (C) RFS for chr19q+.
Discussion
The study found that high CIN was significantly associated with tumor recurrence and higher tumor grade, correlating with poorer RFS. Multivariate analysis identified high CIN as an independent predictor of recurrence. Patients exhibiting single-chromosome copy number abnormalities also showed worse outcomes compared to those without such abnormalities. No significant difference in RFS was observed between Ta stage and T1 stage. These findings suggest that CIN may serve as a prognostic biomarker for predicting post-TURBT recurrence. Based on our research findings, we propose conducting LC-WGS on tumor tissues obtained through TURBT to determine the degree of CIN. Using the calculated cut-off value, patients can be categorized into high-CIN or low-CIN groups. As patients with high CIN face significantly higher recurrence risks, they require close monitoring and more aggressive treatment strategies.
Time-dependent ROC analysis demonstrated that the CIN score achieved optimal predictive performance for relapse between years 2 and 5 (AUC ≈ 0.7), but declined thereafter to approximately 0.6 beyond year 6. This decline may be attributed to tumor clonal evolution over time, where late recurrences are driven by acquired mutations rather than baseline CIN; a potential “cured” population in whom baseline features no longer dictate outcome; and statistical attrition due to censoring. Clinically, CIN is most useful as a medium-term prognostic indicator (years 2–5) to guide early surveillance intensity, but is unsuitable for ultra-long-term prediction, where risk assessment should be updated with contemporary findings. External validation in larger cohorts is warranted to confirm these temporal patterns.
CIN reflects the dysregulation of multiple tumor-related pathways affecting chromosome distribution during mitosis (5). The manifestations of CIN are diverse, including lagging chromosomes, chromosome bridges, micronuclei, aneuploidy, and polyploidy (22–24). The root causes of CIN are errors during DNA replication, resulting in the formation of cells with incomplete or excessive genetic material; or errors in chromosome segregation during cell division, leading to the formation of cells with an aberrant chromosome number (24). The presence of chromosomal aberrations in over 90% of human tumors suggests widespread CIN in cancer (25). Multiple studies have demonstrated an association between CIN and higher tumor grade, with CIN being significantly elevated in patients experiencing tumor recurrence and metastasis (26–28). Consistent with these reports, the findings of this study also show that patients with high CIN have higher tumor grade and significantly increased tumor recurrence.
A significantly higher prevalence of CIN was observed in recurrent BC cases. The selection of treatment regimens for patients adheres to the EAU risk stratification groups. In our region, due to the high cost of BCG and lack of insurance coverage, some patients diagnosed with high-grade urothelial carcinoma opted for chemotherapeutic instillation therapy instead due to economic constraints. Subsequently, regression analysis incorporated tumor grade, intravesical drugs, and CIN level (high/low) as covariates and revealed that high CIN significantly increased the risk of tumor recurrence.
In this study, we identified specific CNAs in BC, encompassing chromosomal aberrations such as1q+, 7p+, 8p-, 9p-, 9q-, 17p-, and 17q+. These aberrations involve genomic regions harboring genes with established roles in BC pathogenesis, including CDKN2A (9p), TP53 (17p), and EGFR (7p). Deletion of chromosome 9, frequently observed in low-grade and early-stage BC, has been linked to higher recurrence rates, particularly involving loss at 9q22.3, 9q33, and 9q34 (29, 30). Loss of 8p, often affecting the secreted frizzled-related protein 1 (SFRP1) gene at 8p12–11.1, is associated with invasive tumor behavior, higher stage and grade, and shorter overall survival (31). Conversely, gain of 1q, including upregulation of proline rich coiled-coil 2C (PRRC2C) in the 1q23–24 region, correlates with increased invasiveness (32). Polysomy of chromosomes 7 and 17 is associated with high p53 expression, which may promote tumor proliferation and progression (33), and has been shown to confer a 3.62-fold higher risk of recurrence in NMIBC (34). Notably, copy number loss of CDKN2A—one of the most frequent CNAs in BC—correlates with reduced gene expression (35) and has been associated with adverse prognosis in NMIBC (36). Likewise, EGFR amplification or overexpression participates in signaling pathways linked to tumor progression and metastasis (37, 38). TP53 missense mutations, for instance, have been implicated as early drivers in bladder carcinogenesis (39). Collectively, these findings suggest that the genomic instability captured by our CIN metric reflects underlying disruptions in key oncogenic pathways, thereby providing a biological basis for its notable association with tumor recurrence following TURBT.
While the prognostic model based on the EAU risk stratification for NMIBC demonstrated limited predictive ability (C-index: 0.573), the CIN-based classification showed superior performance (C-index: 0.635). Likelihood ratio test confirmed that incorporating CIN significantly improved model fit (χ²=9.503, df=1, P = 0.002), with a substantial net reclassification improvement (NRI = 0.704), underscoring its incremental prognostic value. Although the predictive efficacy of CIN alone was modest (C-index = 0.635), it remained an independent risk factor in multivariable analysis and contributed significantly to NRI of the combined model, indicating that it provides incremental information in the integrated model. CIN possesses potential prognostic value and warrants further validation in larger cohorts.
Multiple studies have demonstrated a correlation between CIN and prognosis in cancer patients. In a study of 354 patients with hormone receptor-positive and human epidermal growth factor receptor 2-negative breast cancer, those with high CIN exhibited shorter invasive disease-free survival and overall survival (OS). High CIN was identified as an independent prognostic predictor (8). Li et al. investigated 91 patients with initially resectable colorectal cancer liver metastases who underwent curative liver resection and found that high CIN was associated with poorer 3-year RFS and lower 3-year OS (40). In another study, Chen et al. analyzed FFPE tumor tissue samples from 91 pancreatic cancer patients and demonstrated that high CIN, along with the presence of human herpesvirus (HHV)-7 and HHV-5 DNA, was correlated with worse prognosis (9). Consistent with the aforementioned studies, our findings revealed that patients with high CIN exhibited higher recurrence rates. Notably, these patients demonstrated significantly shorter RFS. Multivariate regression analysis identified high CIN as an independent risk factor for predicting RFS. No statistically significant differences in recurrence rates or RFS were observed between Ta and T1 stage patients, though this finding may reflect limitations due to the relatively small cohort size, potentially introducing selection bias. However, in a study of 40 gastric cancer patients, Ye et al. reported that patients with high CIN had a poorer prognosis, while no statistically significant survival difference was observed across different traditional Borrmann types (21). Their findings, together with our results, suggest that CIN may be, to some extent, superior to conventional pathological classification in prognostic assessment. This warrants further validation through multicenter studies with larger sample sizes.
Current studies have consistently demonstrated that individual chromosomal abnormalities are associated with unfavorable prognosis in various cancers. Alshalalfa et al. reported that in prostate cancer patients, CNAs in Chr8q and overexpression of related genes correlate with higher Gleason scores, increased metastatic risk, and elevated prostate cancer-specific mortality (41). Multi-omics analyses of Pan-Cancer datasets from The Cancer Genome Atlas (TCGA) and the Genomic Data Commons (GDC) revealed that segmental copy number loss and somatic mutations at chromosome 1p36.13 are linked to poorer prognosis in primary tumors (42). In stage III colorectal cancer, loss of chromosome 4q leads to downregulated expression of phosphoribosylaminoimidazole succinocarboxamide synthetase and is associated with worse RFS (43). Similarly, our study confirms the correlation between individual chromosomal abnormalities and tumor recurrence, with chr16p+, chr19q+, and chr8q+ demonstrating certain prognostic value. This study revealed that chr16p+, chr19q+, and chr8q+ are associated with worse RFS, as detailed in Tables 6 and 7. Tyrosine 3-monooxygenase/tryptophan 5-monooxygenase activation protein zeta (YWHAZ), located at 8q22.3, has been shown to be closely associated with BC development (44) and correlates with higher tumor stage, lymphovascular invasion, and mitotic activity (45). Kelch-like ECH-associated protein 1 (KEAP1) is situated on chromosome 19q. The KEAP1 and NRF2 (nuclear factor-E2-related factor 2) signaling pathway can be activated by p62, protecting BC cells from oxidative stress damage and thereby promoting tumor growth (46). GWAS studies indicate that a polymorphism in the cyclin E1 protein (CCNE1) gene locus at 19q12 correlates with elevated cyclin E protein expression, which accelerates the cell cycle and enhances BC invasiveness (47). However, no cancer-related genes located specifically on 16p have yet been identified in the context of BC pathogenesis. Further mechanistic studies are required to elucidate potential drivers in this region. The identification of key driver chromosomal abnormalities in tumor pathogenesis enables more precise assessment of recurrence risk at reduced costs.
This study has the following strengths. First, it is the first to investigate the predictive value of CIN and individual chromosomal abnormalities for recurrence in BC patients following TURBT. Second, no significant differences were observed in baseline characteristics (age, sex, tumor size, tumor number, tumor stage) between the recurrence and non-recurrence groups, ensuring comparability. Several limitations should be noted. First, the relatively small sample size and single-center design limit the statistical power and may introduce bias. Second, the specific mechanisms underlying the influence of individual chromosomal abnormalities on BC prognosis were not elucidated. Future studies are needed to investigate these underlying biological mechanisms. Third, the cutoff value is data-driven and requires validation through subsequent multi-center studies with larger sample sizes to confirm our findings. Fourth, it should be acknowledged that there was considerable heterogeneity between the two groups regarding the intravesical agents administered. Although logistic regression was employed to adjust for this potential confounder, the non-randomized nature of the study means that residual confounding from treatment selection bias may persist. Lastly, the study characterized by its prolonged enrollment period, inherently carries the biases and confounding issues typical of retrospective research. Furthermore, temporal changes in clinical practice have compounded data heterogeneity and complicated causal inference, potentially compromising the robustness and temporal validity of the conclusions.
Conclusions
CIN was significantly associated with tumor recurrence and higher tumor grade of BC. Patients with high CIN or specific single-chromosome copy number abnormalities demonstrated poorer RFS. High CIN was identified as an independent predictor of recurrence and may serve as a prognostic biomarker for predicting recurrence following TURBT, particularly between the 2nd and 5th years post-surgery.
The reference list from the paper itself. Each links out to its DOI / PubMed record.
- 1Babjuk M Burger M Capoun O Cohen D Comperat EM Dominguez Escrig JL . European association of urology guidelines on non-muscle-invasive bladder cancer (Ta, T 1, and carcinoma in situ). Eur Urol. (2022) 81:75–94. doi: 10.1016/j.eururo.2021.08.010, PMID: 34511303 · doi ↗ · pubmed ↗
- 2Lopez-Beltran A Cookson MS Guercio BJ Cheng L . Advances in diagnosis and treatment of bladder cancer. BMJ. (2024) 384:e 076743. doi: 10.1136/bmj-2023-076743, PMID: 38346808 · doi ↗ · pubmed ↗
- 3Sylvester RJ Rodriguez O Hernandez V Turturica D Bauerova L Bruins HM . European association of urology (EAU) prognostic factor risk groups for non-muscle-invasive bladder cancer (NMIBC) incorporating the WHO 2004/2016 and WHO 1973 classification systems for grade: an update from the EAU NMIBC guidelines panel. Eur Urol. (2021) 79:480–8. doi: 10.1016/j.eururo.2020.12.033, PMID: 33419683 · doi ↗ · pubmed ↗
- 4Bakhoum SF Cantley LC . The multifaceted role of chromosomal instability in cancer and its microenvironment. Cell. (2018) 174:1347–60. doi: 10.1016/j.cell.2018.08.027, PMID: 30193109 PMC 6136429 · doi ↗ · pubmed ↗
- 5Thompson SL Bakhoum SF Compton DA . Mechanisms of chromosomal instability. Curr Biol. (2010) 20:R 285–295. doi: 10.1016/j.cub.2010.01.034, PMID: 20334839 PMC 3781365 · doi ↗ · pubmed ↗
- 6Hosea R Hillary S Naqvi S Wu S Kasim V . The two sides of chromosomal instability: drivers and brakes in cancer. Signal Transduct Target Ther. (2024) 9:75. doi: 10.1038/s 41392-024-01767-7, PMID: 38553459 PMC 10980778 · doi ↗ · pubmed ↗
- 7Vuaroqueaux V Musch A Kobelt D Risch T Herrmann P Burock S . Elevated MACC 1 expression in colorectal cancer is driven by chromosomal instability and is associated with molecular subtype and worse patient survival. Cancers (Basel). (2022) 14:1749. doi: 10.3390/cancers 14071749, PMID: 35406521 PMC 8997143 · doi ↗ · pubmed ↗
- 8Liao YY Fu J Lu X Qian Z Yu Y Zhu L . High chromosomal instability is associated with higher 10-year risks of recurrence for hormone receptor-positive, human epidermal growth factor receptor 2-negative breast cancer patients: clinical evidence from a large-scale, multiple-site, retrospective study. J Pathol Clin Res. (2024) 10:e 70011. doi: 10.1002/2056-4538.70011, PMID: 39545625 PMC 11565440 · doi ↗ · pubmed ↗