Biomarker use in predicting transcranial direct-current stimulation (tDCS) response: a systematic scoping review
Leonidas Constantinides, Anastasia Constantinidou, Andreas Chatzittofis

TL;DR
This paper reviews biomarkers that could predict how well people respond to tDCS, a brain stimulation treatment for neuropsychiatric conditions.
Contribution
The study systematically identifies candidate biomarkers for tDCS response prediction across multiple neuropsychiatric disorders.
Findings
Functional connectivity was the most common biomarker across 7 of 10 disorder categories.
EEG features and cortical activation were also frequently reported as predictive biomarkers.
Biomarkers with strong evidence had plausible mechanisms and prior research support.
Abstract
Trans-cranial Direct Current Stimulation (tDCS) is a non-invasive neuromodulation technique with increasing evidence of efficacy in treating neuropsychiatric conditions. There is a need for biomarkers to predict and monitor tDCS efficacy. We aimed to conduct a systematic scoping review to assess the evidence regarding the ability of biomarkers to predict response to tDCS and identify promising candidate biomarkers in neuropsychiatric patient populations. Comprehensive searches were conducted in the MEDLINE and EMBASE databases on 24/09/2023. Articles were screened at the title and abstract level and then at full text, and inclusion/exclusion criteria applies. Data was extracted and the quality of the studies assessed with the JADAD, MINORS and Ottawa rating scales. 154 including 154 studies in the review. Disorders studied weredivided into 10 categories, Stroke/Aphasia, Psychotic…
Genes, proteins, chemicals, diseases, species, mutations and cell lines named across the full text — each resolved to its canonical identifier and authoritative record.
Click any figure to enlarge with its caption.
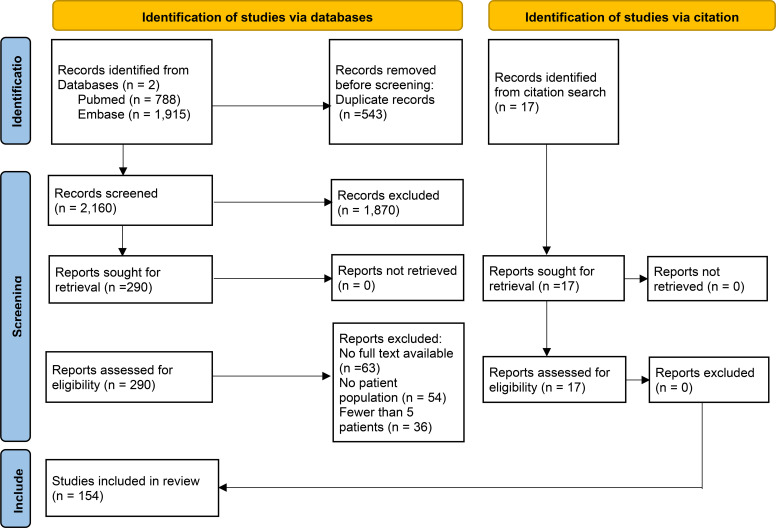 Figure 1
| Condition studied | Studies | Predictive biomarkers identified in 2+ studies (Number of studies in parentheses) | Clinically reflective biomarkers identified in 2+ Studies (Number of studies in parentheses) |
|---|---|---|---|
| Stroke/Aphasia | 45 | Functional Connectivity (4), Cortical Activity (3), White Matter Features (3), Baseline Damage (3) | Functional Connectivity (5), Cortical Activity (5) Brain GABA levels (2) |
| Psychotic Disorders | 18 | None | Functional Connectivity (3), Cortical Activity (2) |
| Affective Disorders | 16 | None | None |
| Neurocognitive Disorders | 17 | None | Functional Connectivity (3) |
| Pain Disorders | 13 | None | Functional Connectivity (3), Glutamate/Glutamine levels in the ACC (2) |
| Addiction Disorders | 11 | None | Functional Connectivity (2) |
| Disorders of Consciousness | 7 | None | None |
| Multiple Sclerosis | 5 | None | None |
| Neurodevelopmental Disorders | 5 | None | EEG features |
| Traumatic Brain Injury | 5 | None | None |
| Other | 12 | ||
| All Studies | 154 |
| Authors | Date | Study | Quality score | Condition | N | Age mean (SD) | tDCS current | tDCS minutes/sessions | ≥10 sessions | Target area | Biomarker type | Biomarker result |
|---|---|---|---|---|---|---|---|---|---|---|---|---|
| Fridriksson et al. ( | 2018 | RCT | 5/5 | Stroke - Aphasia | 74 | 60 (10) | 1mA | 20mins x 15 | Y | Left Temporoparietal region | 1a | BDNF variant predicted response to tDCS |
| Marangolo et al. ( | 2014 | RCT | 3/5 | Stroke - Aphasia | 7 | 57.57 (6.80) | 2mA | 20mins x 10 | Y | Ipsilesional IFG | 2 | tDCS resulted in BDNF level changes, related to response level |
| Marangolo et al. ( | 2016 | RCT | 3/5 | Stroke - Aphasia | 9 | 58.22 (7.10) | 2mA | 20mins x 15 | Y | Ipsilesional IFG | 2 | tDCS treatment determined FC changes in lesioned hemisphere and symptom improvement |
| Richard et al. ( | 2020 | RCT | 4/5 | Stroke - Cognitive Deficits | 54 | 69.72 (7.46) | 1mA | 20mins x 6 | N | LDLPFC | 4 | Brain age prediction not related to tDCS response |
| de Aguiar et al. ( | 2020 | RCT | 3/5 | Primary Progressive Aphasia | 30 | 66.4(6.72) | 2mA | 20mins x 10-15 | Y | Left IFG | 1b | Brain area volumes predicted tDCS response |
| Rosso et al. ( | 2014 | RCT | 2/5 | Stroke - Aphasia | 25 | 57(18) | 1mA | 15mins x 1 | N | IFG | 1 | Broca’s Area damage predicted tDCS response |
| Carlson et al. ( | 2018 | RCT | 5/5 | Stroke - Motor Deficits | 15 | 12.1 (3.0) | 1mA | 20mins x 10 | Y | Contralesional M1 | 1b | Baseline creatine/choline levels predicted tDCS response |
| Cipollari et al. ( | 2015 | RCT | 3/5 | Stroke - Aphasia | 6 | 59.17(11.09) | 2mA | 20mins x 10 | Y | Ipsilesional IFG | 2 | tDCS treatment related to changes in cortical excitability, reflecting symptom improvement |
| Campana et al. ( | 2015 | RCT | 2/5 | Stroke - Aphasia | 20 | range=37-75 | 2mA | 20mins x 16 | Y | Right IFG | 1a | Left hemisphere damage predicted lower tDCS response |
| Bradnam et al. ( | 2011 | RCT | 3/5 | Stroke - Motor Deficits | 12 | 64(3.4) | 1mA | 20mins x 1 | N | M1 | 1/4 | FA asymmetry predicted tDCS respose, lesion size did not. |
| Stagg et al. ( | 2012 | NRCT | 01/09 | Stroke - Behavioural Deficits | 11 | mean 64 | 1mA | 10mins x 1 | N | Ipsilesional M1 | 1 | Cortical activity predicted tDCS response |
| Lee et al. ( | 2019 | NRCT | 17/24 | Stroke - Motor Deficits | 21 | 59.6(11.5) | 2mA | 20mins x 10 | Y | Ipsilesional M1 | 1 | Intrahemispheric connectivity imbalance predicted tDCS response |
| Hsu et al. ( | 2023 | RCT | 5/5 | Stroke - Motor Deficits | 27 | 59.2 (11.4) | 2mA | 20mins x 20 | Y | Ipsilesional M1 | 1b | FC strength predicted response |
| Soliman et al. ( | 2021 | RCT | 3/5 | Stroke - Aphasia | 21 | 52.96(1.58) | 2mA | 20mins x 10 | Y | Left Broca’s Area | 1b | White matter changes predicted response |
| Cherney et al. ( | 2021 | RCT | 5/5 | Stroke - Aphasia | 12 | 55.54 (4.17) | 1mA | 13mins x 30 | Y | Perilesional | 2 | tDCS treatment altered cortical activation reflecting clinical improvement |
| Cotelli et al. ( | 2016 | NRCT | 14/16 | Primary Progressive Aphasia | 18 | 66.5(9.5) | 2mA | 25mins x 10 | Y | LDLPFC | 1 | Grey matter features predicted tDCS response |
| Shah-Basak et al. ( | 2020 | RCT | 4/5 | Stroke - Aphasia | 11 | 61.1 (12.3) | 2mA | 20mins x 1 | N | Perilesional | 2 | tDCS treatment resulted in RsMEG changes, reflecting reversal of pathological abnormalities |
| Yang et al. ( | 2022 | NRCT | 18/24 | Stroke - Cognitive Deficits | 22 | 60.91(8.79) | 2mA | 30mins x 14 | Y | LDLPFC | 2 | tDCS treatment altered cortical activation and FC, related to improved cognitive function scores |
| Lefebvre et al. ( | 2017 | RCT | 4/5 | Stroke - Motor Deficits | 22 | 64.7(9.8) | 1mA | 30mins x 1 | N | Bilateral M1 | 2 | tDCS treatment altered FC strength,related to enhancement of motor skill retention |
| Cheng and Schlaug ( | 2016 | NRT | 12/16 | Stroke - Motor Deficits | 5 | 57.4(12.9) | 1.5mA | 30mins x 10 | Y | Motor Cortex | 2 | tDCS treatment resulted in resting-state FC increase, related to motor improvement |
| Wilmskoetter et al. ( | 2021 | RCT | 5/5 | Stroke - Aphasia | 69 | 59.54(10.26) | 1mA | 20mins x 15 | Y | Temporal Lobe | 1a | White matter connectivity predicted tDCS response |
| Yuan et al. ( | 2023 | NRCT | 18/24 | Stroke - Sensorimotor Deficits | 25 | 61.3(8.4) | 1mA | 20mins x1 | N | Ipsilesional M1 | 1/2 | tDCS treatment altered FC strength,and electric field predicted functional outcomes |
| Allman et al. ( | 2016 | RCT | 5/5 | Stroke - Motor Deficits | 24 | 62.85(11.71) | 1mA | 20mins x 9 | N | Ipsilesional M1 | 2 | tDCS treatment resulted in cortical activation/grey matter volume increases, reflecting clinical outcome improvement |
| Takeuchi et al. ( | 2012 | RCT | 4/5 | Stroke - Motor Deficits | 27 | 61.47(8.16) | 1mA | 20mins x 1 | N | Ipsilesional M1 | 2 | tDCS treatment resulted in MEP changes and improved task performance |
| Lee et al. ( | 2018 | RCT | 2/5 | Stroke - Motor Deficits | 24 | 55.4(14.8) | 2mA | 20mins x 10 | Y | Ipsilesional M1 | 2 | tDCS treatment altered FC strength and improved global efficiency |
| Lefebvre et al. ( | 2015 | RCT | 3/5 | Stroke - Motor Deficits | 19 | 65(10) | 1mA | 30mins x 1 | N | Ipsilesional M1 | 1b | Decreased activation predicted tDCS response |
| Hordacre et al. ( | 2018 | RCT | 3/5 | Stroke - Motor Deficits | 10 | 63.8(17.9) | 1mA | 20mins x 2 | N | Ipsilesional M1 | 1b | FC and lesion volume predicted tDCS response |
| Nair et al. ( | 2011 | RCT | 3/5 | Stroke - Motor Deficits | 14 | 58.5 (13.3) | 1mA | 30mins x 5 | N | Contralesional Motor Cortex | 1b | Decreased activation predicted tDCS response |
| O’Shea et al. ( | 2014 | NRCT | 16/24 | Stroke - Motor Deficits | 13 | 66.38 (13.08) | 1mA | 20mins x 1 | N | Left M1 | 1 | GABA levels and clinical features predicted tDCS response |
| Mane et al. ( | 2019 | RCT | 4/5 | Stroke - Motor Deficits | 19 | 34.52(19.4572) | 1mA | 20mins x 10 | Y | Ipsilesional M1 | 1b | EEG features predicted poor tDCS response |
| Harris et al. ( | 2019 | RCT | 4/5 | Primary Progressive Aphasia | 22 | 66.9 (7.5) | 2mA | 20mins x 15 | Y | LEft IFG | 2 | tDCS treatment resulted in decreased GABA levels and symptom improvement up to 2 months |
| Kolskår et al. ( | 2021 | RCT | 5/5 | Stroke - Cognitive Deficits | 54 | 69.13(7.37) | 1mA | 20mins x 6 | N | LDLPFC | 4 | Cortical activation not related to tDCS treatment |
| McCambridge et al. ( | 2018 | RCT | 4/5 | Stroke - Motor Deficits | 10 | 69.8(6.78) | 1mA | 15mins x 1 | N | Contralesional M1 | 2 | tDCS treatment resulted in cortical excitability, and GABA concentration changes negatively associated with tDCS treatment response |
| Tao et al. ( | 2021 | RCT | 4/5 | Primary Progressive Aphasia | 32 | 67(6.73) | 2mA | 20mins x 1 | N | Left IFG | 3a | tDCS treatment resulted in reduced global connectivity |
| Licata et al. ( | 2023 | RCT | 3/5 | Primary Progressive Aphasia | 36 | 68.53(4.89) | 2mA | 20mins x 1 | N | Left IFG | 3a | tDCS treatment resulted in FC increase |
| Unger et al. ( | 2023 | RCT | 5/5 | Stroke - Motor Deficits | 17 | 62.58(9.77) | 1mA | 30mins x 30 | Y | Ipsilesional M1 | 2 | tDCS resulted in FC increase which was correlated to impairment reduction |
| Cunningham et al. ( | 2015 | RCT | 3/5 | Stroke - Motor Deficits | 12 | 61(9) | 1mA | 30mins x 15 | Y | Ipsilesional M1 | 1b | Contralesional hemisphere excitability increase predicted tDCS response |
| Zheng and Schlaug ( | 2015 | NRCT | 17/24 | Stroke - Motor Deficits | 20 | 57.5(12.9) | 1.5mA | 30mins x 10 | Y | Motor Cortex | 1 | FA changes predicted tDCS response |
| Cheng et al. ( | 2021 | RCT | 5/5 | Stroke - Motor Deficits | 18 | 52.89 (10.32) | 1mA | 20mins x 11 | Y | Ipsilesional M1 | 1a | Baseline FC strength predicted tDCS response |
| Ficek et al. ( | 2018 | RCT | 3/5 | Primary Progressive Aphasia | 24 | 67.2 (6.5) | 2mA | 20mins x 15 | Y | Left IFG | 1b | FC changes predicted tDCS response |
| Lu et al. ( | 2021 | RCT | 1/5 | Stroke - Dysphagia | 60 | 63.39(1.75) | 2mA | 20mins x 30 | Y | LDLPFC | 1b | Brain activation volume predicted tDCS response |
| Nissim et al. ( | 2022 | RCT | 3/5 | Primary Progressive Aphasia | 12 | 66.92(6.37) | 1.5mA | 20mins x 1 | N | Left frontotemporal region | 1b | Cortical thickness and volume predicted tDCS response |
| Darkow et al. ( | 2017 | RCT | 1/5 | Stroke - Aphasia | 16 | 56.7(10.1) | 1mA | 20mins x 2 | N | Left M1 | 3a | tDCS treatment resulted in functional network activity normalisation |
| Larcombe et al. ( | 2018 | RCT | 2/5 | Stroke - Hemianopia | 7 | 55.86(17.00) | 1mA | 20mins x 5 | N | Ipsilesional Visual Cortex | 3a | tDCS treatment resulted in cortical activity changes in the healthy part of the brain |
| Zhao et al. ( | 2021 | RCT | 4/5 | Primary Progressive Aphasia | 39 | 65.5(7.69) | 2mA | 20mins x 15 | Y | Left frontal lobe | 1b | White matter integrity predicted tDCS response |
| Authors | Date | Study | Quality score | Condition - symptom target | N | Mean age (SD) | tDCS current | tDCS mins/sessions | ≥10 sessions | Target area | Biomarker type | Biomarker result |
|---|---|---|---|---|---|---|---|---|---|---|---|---|
| Mondino et al. ( | 2021 | Retrospective | 6/9 | Schizophrenia - Auditory Hallucinations | 17 | 35.39 (8.85) | 2mA | 20mins x 10 | Y | LDLPFC | 1 | Higher electric field strength predicted tDCS treatment response |
| Gordon et al. ( | 2019 | RCT | 4/5 | Schizophrenia - Motor Cortical Excitability | 48 | 34.5(8.8) | 2mA | 20mins x 1 | N | LDLPFC | 2 | tDCS treatment resulted in increased intracortical inhibition as well as symptom improvement |
| Xu et al. ( | 2023 | RCT | 4/5 | Schizophrenia - Cognitive function | 56 | 40.34(9.87) | 2mA | 20mins x 11 | Y | LDLPFC | 2 | HD-tDCS treatment resulted in enhanced white matter integrity, related to improvement in symptoms |
| Yoon et al. ( | 2019 | NRT | 7/16 | Schizophrenia - Psychotic Symptoms | 7 | 27.7(9) | 2mA | 20mins x 10 | Y | LDLPFC | 3a | tDCS treatment resulted in an increase in previously decreased FC |
| Mondino et al. ( | 2016 | RCT | 3/5 | Schizophrenia - Auditory Verbal Hallucinations | 23 | 37 (9.48) | 2mA | 20mins x 10 | Y | LDLPFC | 2 | tDCS treatment reduced resting-state FC, related to improvement in symptoms |
| Impey et al. ( | 2017 | RCT | 5/5 | Schizophrenia - Working Memory Performance | 12 | 47.5 (12.37) | 2mA | 20 mins x 1 | N | LDLPFC | 2 | tDCS treatment resulted in increased Mismatch Negativity, correlated with working memory improvement |
| Zhuo et al. ( | 2020 | NRT | 9/16 | Bipolar Disorder - Auditory Hallucinations | 40 | 40.5(11.0) | 2mA | 20mins x 50 | Y | Left prefrontal area | 2 | tDCS treatments resulted in altered global FC density, reflecting a decrease in hallucination symptom severity |
| Kim et al. ( | 2019 | RCT | 5/5 | Schizophrenia - Impaired Illness Awareness | 11 | 45 (12.1) | 2mA | 20mins x 1 | N | Biparietal/Bifrontal | 3b | tDCS reduced hemispheric imbalance,increased regional cerebral blood flow, but did not change illness awareness |
| Dunn et al. ( | 2016 | RCT | 2/5 | Schizophrenia - Auditory Processing Measures | 36 | 45.07(9.86) | 1mA | 20mins x 1 | N | LDLPFC | 3a | tDCS treatment decreased Mis-Match Negativity amplitute |
| Marquardt et al. ( | 2022 | RCT | 5/5 | Schizophrenia - Auditory Hallucination Neuronal Network Modulation | 21 | 35.61(11.66) | 2mA | 20mins x 10 | Y | LDLPFC | 4 | tDCS treatment had no effect in brain activation, structure or Glx/GABA levels, but small reduction in symptom severity |
| Palm et al. ( | 2016 | RCT | 4/5 | Schizophrenia - Predominantly Negative Symptoms | 20 | 36.1 (11.4) | 2mA | 20mins x 10 | Y | LDLPFC | 2 | tDCS treatment resulted in FC changes and an improvement in symptom scores. |
| Kantrowitz et al. ( | 2019 | RCT | 5/5 | Schizophrenia/Schizoaffective - Auditory Hallucinations | 89 | 39.1(9.3) | 2mA | 20mins x 10 | Y | LDLPFC | 1b | Lower cognitive scores predicted better tDCS response |
| Orlov et al. ( | 2022 | RCT | 5/5 | Schizophrenia - Stochastic Learning | 25 | 36.3(9.45) | 2mA | 30mins x 2 | N | Left medial prefrontal cortex | 2 | tDCS treatment resulted in altered brain activation and symptom improvement |
| Orlov et al. ( | 2017 | RCT | 5/5 | Schizophrenia.- Working Memory/Executive Functions | 49 | 35.15(7.41) | 2mA | 30mins x 1 | N | LDLPFC | 2 | tDCS resulted in altered brain activation, reflected in improved symptoms |
| Paul et al. ( | 2022 | NRT | 8/16 | Schizophrenia - Auditory Verbal Hallucinations | 34 | 31.15(7.65) | 2mA | 20mins x 10 | Y | Left TPJ | 1 | FC predicted responders to tDCS treatment |
| Kim et al. ( | 2018 | NRT | 12/16 | Schizophrenia - Auditory Hallucinations | 10 | 29.8 (8.4) | 2mA | 20mins x 1 | N | LDLPFC | 4 | tDCS treatment did not improve P50 sensory gating to a statistically significant degree |
| Narita et al. ( | 2018 | NRT | 8/16 | Schizophrenia - Psychotic Symptoms | 26 | 40.5(10) | 2mA | 20mins x 10 | Y | LDLPFC | 2 | tDCS resulted in altered oxyhaemoglobin concentrations, negatively correlated with symptom score improvement |
| Chang et al. ( | 2021 | RCT | 5/5 | Schizophrenia - Insight Levels | 60 | 44.87(10.71) | 2mA | 20mins x 10 | Y | Prefrontal Cortex | 4 | tDCS treatment resulted in symptom improvement, which were not correlated to heart-rate variability |
| Authors | Date | Study | Quality score | Condition | N | Mean age (SD) | tDCS current | tDCS mins/sessions | ≥10 sessions | Target area | Biomarker type | Biomarker result |
|---|---|---|---|---|---|---|---|---|---|---|---|---|
| Bulubas et al. ( | 2019 | RCT | 5/5 | Major Depressive Disorder - Depressive Symptoms | 52 | 40.26 (12.03) | 2mA | 30mins x 22 | Y | LDLPFC | 1b | Gray matter volume predicted tDCS antidepressant effects |
| Brunoni et al. ( | 2015 | RCT | 5/5 | Major Depressive Disorder - Depressive Symptoms | 73 | 42 (12) | 2mA | 30mins x 12 | Y | LDLPFC | 4 | NT-3, NT-4, NGF and GDNF plasma levels did not significantly change with tDCS. |
| Brunoni et al. ( | 2014 | RCT | 5/5 | Major Depressive Disorder - Depressive Symptoms | 73 | 42 (12) | 2mA | 30mins x 13 | Y | LDLPFC | 4 | tDCS did not significantly change BDNF levels |
| Zhang et al. ( | 2023 | RCT | 5/5 | Bipolar Depression - Depressive Symptoms | 50 | 33.06(9.00) | 2mA | 20mins x 14 | Y | LDLPFC | 2 | tDCS altered Regional Homogeneity values which were correlated to improvement of symptoms |
| Goerigk et al. ( | 2021 | RCT | 5/5 | Bipolar Depression - Depressive Symptoms | 52 | 46.1 (11.06) | 2mA | 30mins x 10 | Y | LDLPFC | 1/3a | Higher plasma IL-6 predicted tDCS response and tDCS resulted in reduced IL-8 |
| van Dam and Chrysikou. ( | 2021 | RCT | 2/5 | Major Depressive Disorder - Emotion Regulation | 19 | 24.11 (5.53) | 1.5mA | 20mins x 2 | N | LDLPFC | 4 | tDCS did not elicit significant changes in FC |
| Lin et al. ( | 2021 | NRT | 14/16 | Major Depressive Disorder/Bipolar Depression - Depressive Symptoms | 80 | 43.27 (12.37) | 2mA | 20mins x 10 | Y | LDLPFC | 1 | HR deceleration in the 1st session predicted tDCS treatment response only in unipolar depression patients |
| Jog et al. ( | 2021 | RCT | 5/5 | Major Depressive Disorder - Depressive Symptoms | 59 | 31.1(8.34) | 2mA | 20mins x 12 | Y | LDLPFC | 2 | tDCS increased cerebral blood flow and improved anhedonia symptom scores |
| Player et al. ( | 2014 | NRCT | 12/24 | Major Depressive Disorder - Depressive Symptoms | 18 | data not available | 2mA | 20-30mins x 1 | N | LDLPFC | 4 | Serum BDNF levels did not change after tDCS, or correlate with change in neuroplasticity after treatment |
| eNord et al. ( | 2019 | RCT | 5/5 | Major Depressive Disorder - Depressive Symptoms | 39 | 3.38(19.97) | 1mA | 20mins x 8 | N | Left PFC | 1b | High left PFC activation predicted tDCS response |
| Brunoni et al. ( | 2018 | RCT | 4/5 | Major Depressive Disorder - Depressive Symptoms | 236 | 42.45(12.48) | 2mA | 30mins x 22 | Y | LDLPFC | 1b | NGF baseline levels predicted tDCS treatment response |
| Al-Kaysi et al. ( | 2017 | NRT | 11/16 | Major Depressive Disorder - Depressive and Cognitive Symptoms | 10 | 41.8(13.3) | 2mA | 20min x 15 | Y | LDLPFC | 1 | Machine-learning EEG classification predicted tDCS response |
| Bulubas et al. ( | 2021 | RCT | 5/5 | Major Depressive Disorder - Depressive Symptoms | 51 | 40.49(11.88) | 2mA | 30mins x 22 | Y | LDLPFC | 4 | Baseline rsFC did not predict tDCS response |
| Bersani et al. ( | 2015 | NRT | 9/16 | Bipolar Disorder - Neurocognitive Impairments | 25 | 45.9(12.8) | 2mA | 20mins x 15 | Y | Right Cerebellar Cortex | 3a | tDCS treatment resulted in higher amplitude and shorter latency of the P3b component |
| Chrysikou et al. ( | 2022 | RCT | 2/5 | Major Depressive Disorder - Emotion Regulation | 20 | 24.20(6.31) | 1.5mA | 20mins x 2 | N | LDLPFC | 2 | tDCS treatment upregulated ventromedial PFC activity, related to performance improvement |
| Zanao et al. ( | 2022 | RCT | 5/5 | Major Depressive Disorder - Depressive Symptoms | 49 | 40.04(12.23) | 2mA | 30mins x 22 | Y | LDLPFC | 1b | Abnormalities in white matter MDD-related areas predicted tDCS antidepressant effects |
| Authors | Date | Study | Quality score | Condition | N | Mean age (SD) | tDCS current | tDCS mins/sessions | ≥10 sessions | Target area | Biomarker type | Biomarker result |
|---|---|---|---|---|---|---|---|---|---|---|---|---|
| Pini et al. ( | 2022 | RCT | 5/5 | AD and FTD - Cognitive Function/Behavioural Symptoms | 45 | 71.25(8.36) | 1.5mA | 25mins x 10 | Y | Right IPL | 4 | No effect of tDCS on FC or cerebral perfusion |
| Turnbull et al. ( | 2023 | RCT | 3/5 | Mild Cognitive Impairment - Behavioural Symptoms | 40 | 71 (7.0) | 1.5mA | 20mins x 14 | Y | Left SMC | 2 | tDCS altered rs-FC, related to symptom improvement |
| Im et al. ( | 2019 | RCT | 4/5 | Alzheimer’s Disease - Cognitive Function | 18 | 73(7.8) | 2mA | 20mins x 180 | Y | LDLPFC | 2 | Treatment preserved Cerebral Glucose metabolism and improved symptoms |
| Lengu et al. ( | 2021 | RCT | 3/5 | Mild Cognitive Impairment - Neurometabolic measures | 13 | 71.15 (5.26) | 2mA | 20mins x 1 | N | Right SPC | 3a | Treatment increased GABA and decreased the ratio of glutamate to GABA |
| Andrade et al. ( | 2022 | RCT | 5/5 | Alzheimer’s Disease - Cognitive Function | 36 | 76.3 (3.2) | 2mA | 30mins x 24 | Y | DLPFC | 2 | tDCS improved symptom scores which were predictive for EEG interhemispheric coherence |
| Rasmussen et al. ( | 2021 | RCT | 5/5 | Alzheimer’s Disease - Cognitive Function | 19 | 72.58 ± 7.19 | 2mA | 20mins x 6 | N | DLPFC | 2 | Treatment improved symptoms scores which were correlated to fractional anisotropy |
| Kang et al. ( | 2021 | NRT | 14/16 | Mild Cognitive Impairment - Cognitive Function | 32 | 73.92(7.14) | 2mA | 20mins x 10 | Y | Left M1 | 1 | APOE gene, Aβ retention predicted tDCS treatment response |
| Emonson et al. ( | 2019 | NRCT | 17/24 | Mild Cognitive Impairment - Cognitive Function | 9 | 72.11(5.75) | 1mA | 20mins x 1 | N | LDLPFC | 4 | tDCS did no change TMS-Evoked Potentials or Event Related Potentials in MCI patients. |
| Ladenbauer et al. ( | 2017 | RCT | 4/5 | Mild Cognitive Impairment - Cognitive Function | 16 | 71(9) | slow oscillatory-tDCS | 15–25 mins x 1 | N | PFC | 2 | so-tDCS altered EEG features, related to symptom improvement |
| Zhang et al. ( | 2022 | RCT | 2/5 | Mild Cognitive Impairment - Cognitive Function | 30 | 57.03(2.92) | 1mA | 20mins x 10 | Y | LDLPFC | 2 | tDCS treatment altered brain functional network regional homogeneity (ReHo), related to clinical improvement |
| Vaqué-Alcázar et al. ( | 2021 | RCT | 5/5 | Subjective Cognitive Decline - Cognitive Function | 38 | 62.29(1.56) | 1.5mA | 15mins x 1 | N | LDLPFC | 1b | Baseline anatomical features and FC predicted treatment response |
| Meinzer et al. ( | 2015 | RCT | 2/5 | Mild Cognitive Impairment - Cognitive Function | 18 | 67.44(7.27) | 1mA | 20mins x 1 | N | Left IFG | 2 | tDCS resulted in normalisation of network configuration related to improved performance |
| Schoellmann et al. ( | 2019 | RCT | 3/5 | Parkinson’s Disease - Motor Symptoms | 10 | 64.3 (11.4) | 1mA | 20mins x 1 | N | Left SMC | 2 | tDCS modulated cortical activity, related to improved symptoms |
| Hadoush et al. ( | 2021 | NRT | 12/16 | Parkinson’s Disease - Sleep Disturbance/Depression | 25 | 61.48(9.19) | 1mA | 20mins x 10 | Y | Bilateral Motor Cortex | 2 | tDCS resulted in reduced melatonin serum levels correlated to symptom improvement. |
| Pereira et al. ( | 2013 | RCT | 2/5 | Parkinson’s Disease - Verbal Fluency network modulation | 16 | 61.5 (9.9) | 2mA | 20mins x 1 | N | LDLPFC/Left Parietal Cortex | 2 | tDCS treatment to DLPFC enhanced FC and improved performance |
| Conti et al. ( | 2014 | RCT | 4/5 | HIV-associated neurocognitive disorders - Cognitive Function | 11 | 57.9(4.5) | 1.5mA | 20mins x 10 | Y | Cingulate cortex | 2 | tDCS increased FC, related to improved performance scores |
| Cummiford et al. ( | 2016 | RCT | 3/5 | Mild Cognitive Impairment - Cognitive Function | 22 | 62.91 (7.79) | 2mA | 20 x 8 | N | Left IFG | 3b | tDCS treatment increased regional resting cerebral blood flow, this was not related to clinical response |
| Authors | Date | Study | Quality score | Condition | N | Mean age (SD) | tDCS current | tDCS mins x sessions | ≥10 sessions | Target area | Biomarker type | Biomarker result |
|---|---|---|---|---|---|---|---|---|---|---|---|---|
| Foerster et al. ( | 2015 | NRCT | 12/16 | Fibromyalgia - Pain | 12 | 47.6 (10.6) | 2mA | 20 x 5 | N | Left Motor Cortex | 1/2 | Baseline Glx levels in the anterior cingulate predicted response to treatment and were lower after treatment. |
| Cummiford et al. ( | 2016 | NRCT | 13/16 | Fibromyalgia - Pain | 12 | 47.6 (10.6) | 2mA | 20 x 5 | N | Left Motor Cortex | 1/2 | Stronger baseline FC predicted tDCS response, and treatment resulted in FC alterations correlated with pain reduction |
| Khedr et al. ( | 2017 | RCT | 5/5 | Fibromyalgia - Pain | 36 | 32.6 (10.99) | 2mA | 20 x 10 | Y | Ipsilateral M1 | 2 | Treatment resulted in changes in serum beta-endorphin levels which were correlated with symptom scale improvement |
| Lim et al. ( | 2021 | NRCT | 16/24 | Fibromyalgia - Pain | 12 | 49.3 (9.0) | 2mA | 20 x 5 | N | Left M1 | 2 | tDCS altered blood oxygen level dependent signals, which were correlated to pain reduction |
| Kikkert et al. ( | 2019 | RCT | 3/5 | Phantom Limb - Pain | 17 | 47 (3) | 1mA | 20 x 1 | N | Ipsilateral S1/M1 | 2 | Increased FC during treatment predicted phantom pain relief |
| Volz et al. ( | 2016 | RCT | 5/5 | Inflammatory Bowel Disease - Pain | 20 | 37.5 (12.9098) | 2mA | 20 x 5 | N | Ipsilateral M1 | 4 | Inflammatory biomarkers did not predict tDCS response |
| Auvichayapat et al. ( | 2018 | NRT | 14/16 | Neuropathic Pain | 10 | 32.7(6.88) | 2mA | 20 x 5 | N | Left M1 | 2 | tDCS treatment increased Glx/Cr and NAA/Cr in the ACC and improved pain |
| Kumru et al. ( | 2013 | NRCT | 20/24 | Neuropathic Pain | 18 | 49.4 (12.4) | 2mA | 20 x 10 | Y | Contralateral M1 | 2 | tDCS treatment reduced contact heat evoked potential amplitude, and pain perception |
| Pohl et al. ( | 2023 | RCT | 5/2 | Migraine - Migraine Frequency | 22 | 37 (13) | 1mA | 20 x 28 | Y | Occipital Lobe | 3b | tDCS resulted in reduced concentrations of GABA but not GLX or the migraine frequency |
| Schading et al. ( | 2021 | RCT | 5/2 | Migraine - Migraine Frequency | 24 | 37.80 (12.38) | 1mA | 20 x 28 | Y | Occipital Lobe | 2 | tDCS application led to a reduction of migraine frequency, paralleled by grey matter volume decreases in the left lingual gyrus |
| Neeb et al. ( | 2019 | RCT | 5/5 | inflammatory bowel disease - Pain | 36 | 35.36 (12.86) | 2mA | 20 x 5 | N | Ipsilateral M1 | 2 | tDCS treatment increased FC and improved pain symptoms |
| Yoon et al. ( | 2014 | NRCT | 19/24 | Neuropathic Pain | 16 | 44.1 (8.6) | 2mA | 20 x 20 | Y | Left M1 | 2 | tDCS treatment altered cerebral glucose metabolism, related to reduced pain ratings |
| Suchting et al. ( | 2020 | RCT | 2/5 | Osteoarthritis - Inflammation | 40 | 40 (59.95) | 2mA | 20 x 5 | N | Contralateral M1 | 3a | tDCS treatment resulted in lower levels of IL-6, IL-10, TNF-α, and β-endorphin |
| Authors | Date | Study | Quality score | Condition | N | Mean age (SD) | tDCS current | tDCS mins x sessions | ≥10 sessions | Target area | Biomarker type | Biomarker result |
|---|---|---|---|---|---|---|---|---|---|---|---|---|
| Kumar et al. ( | 2022 | RCT | 5/5 | Opioid Use Disorder -Withdrawal/Craving | 28 | 23.93(6.11) | 2mA | 20 x 10 | Y | LDLPFC | 4 | Glx, GABA were not affected by HD-tDCS and were not correlated with reduction in withdrawal/craving |
| Conti et al. ( | 2014 | NRCT | 14/24 | Cocaine Use Disorder - Drug-Cued Reactivity | 13 | 30(7) | 2mA | 20 x 1 | N | RDLPFC | 3a | Prefrontal tDCS modulated the ACC response during exposure to visual drug cues in crack-cocaine users. |
| Holla et al. ( | 2020 | RCT | 5/5 | Alchohol Use Disorder - Impulsivity/Time to first Lapse | 21 | 39.00(7.31) | 2mA | 20 x 5 | N | LDLPFC | 2 | tDCS resulted increased the global efficiency of brain networks, which predicted a reduced likelihood of relapse. |
| Mondino et al. ( | 2018 | RCT | 5/5 | Tobacco Use Disorder - Cigarette Consumption/Craving | 29 | 41(9.05) | 2mA | 20 x 10 | Y | RDLPFC | 2 | tDCS reduced smoking craving and increased brain reactivity to smoking cues in the right posterior cingulate |
| Yang et al. ( | 2017 | RCT | 3/5 | Tobacco Use Disorder - Cigarette Craving | 32 | 26.68(6.28) | 1mA | 30 x 1 | N | LDLPFC | 2 | tDCS treatment resulted in altered FC which predicted reduced craving during cue-reactivity task |
| Den Uyl et al. ( | 2016 | RCT | 4/5 | Alchohol Use Disorder -Cognitive Bias | 78 | 21.85(0.36) | 1mA | 15 x 3 | N | LDLPFC | 4 | tDCS did not affect the P300 event-related potential |
| Dickler et al. ( | 2018 | RCT | 4/5 | Gambling Disorder -Risk taking/Impulsivity/Craving | 16 | 37.8(16.8) | 1mA | 30 x 1 | N | RDLPFC | 2 | tDCS elevated prefrontal GABA levels, and brain metabolite levels were correlated to symptom ratings |
| Shahbabaie. ( | 2018 | RCT | 2/5 | Methamphetamine use disorder - Drug Craving | 15 | 31.33(1.40) | 2mA | 20 x 1 | N | LDLPFC | 2 | tDCS modified resting-state FC which correlated to reduction of craving scores. |
| Sergiou et al. ( | 2022 | RCT | 3/5 | Substance Use Disorder -Reactive Aggression | 50 | 37.40(9.19) | 2mA | 20 x 10 | Y | vmPFC | 3b | tDCS altered some EEG features, but had no effect on trait empathy |
| Ekhtiari et al. ( | 2022 | RCT | 5/5 | Methamphetamine use disorder - Drug Craving | 60 | 35.86(8.47) | 2mA | 20 x 1 | N | LDLPFC | 3b | tDCS treatment altered FC but had no effect on craving symptoms |
| Nakamura - Palacios et al. ( | 2016 | RCT | 4/5 | Substance Use Disorder - Drug Craving/Relapse | 45 | 24.96(14.88) | 2mA | 20/26 x 5 | N | LDLPFC | 2 | tDCS altered white matter parameters correlated with craving decrease, and altered ERP features on EEG |
| Authors | Date | Study | Quality score | Condition | N | Mean age (SD) | tDCS current | tDCS mins x sessions | ≥10 sessions | Target area | Biomarker type | Biomarker result |
|---|---|---|---|---|---|---|---|---|---|---|---|---|
| Thibaut et al. ( | 2015 | retrospective | 6/9 | Disorders of Consciousness - Consciousness level | 24 | 36.76 (15.65) | 2mA | 20 x 1 | N | LDLPFC | 1 | Grey matter atrophy and brain hypometabolism predicted non-response to tDCS treatment. |
| Mensen et al. ( | 2020 | NRT | 7/16 | Disorders of consciousness - Neural Response | 7 | 34.7 (10.5) | 2mA | 20 x 1 | N | LDLPFC | 3b | tDCS treatment affected EEG features but did not improve outcomes. |
| Peng et al. ( | 2022 | NRCT | 19/24 | Disorders of Consciousness - Consciousness level | 11 | 43 (7.08) | 2mA | 20 x 10 | Y | LDLPFC | 2 | tDCS treatment enhanced FC and clinical scores |
| Cavaliere et al. ( | 2016 | retrospective | 4/5 | Disorders of Consciousness - Consciousness level | 16 | 37.63 (14.49) | 2mA | 20 x 1 | N | LDLPFC | 1 | FC features predicted response to tDCS treatment |
| Cai et al. ( | 2019 | NRT | 10/16 | Disorders of Consciousness - Consciousness level | 28 | no data | 2mA | 20 x 14 | Y | Parietal Region | 2 | tDCS treatment improved consciousness state, and in responders altered resting state EEG features |
| Carrière et al. ( | 2020 | RCT | 4/5 | Disorders of Consciousness - Consciousness level | 9 | 43.78 (13.16) | 2mA | 20 x 1 | N | LDLPFC | 3b | tDCS treatment altered hd-EEG features but did not result in symptom improvement |
| Zhang et al. ( | 2022 | NRT | 13/16 | Disorders of Consciousness - Consciousness level | 31 | 61.54(10.15) | 2mA | 20 x 20 | Y | LDLPFC | 1 | The P300 ERP component predicted tDCS treatment response |
| Authors | Date | Study | Quality score | Condition | N | Mean age (SD) | tDCS current | tDCS mins x sessions | ≥10 sessions | Target area | Biomarker type | Biomarker result |
|---|---|---|---|---|---|---|---|---|---|---|---|---|
| Tecchio et al. ( | 2015 | RCT | 3/5 | Multiple Sclerosis - Fatigue | 21 | 42.87 (9.11) | 1.5mA | 15 x 5 | N | Nasion-Inion line | 3b | tDCS resulted in changes in S1 and M1 excitability, which did not correlate with symptom amelioration |
| Porcaro et al. ( | 2019 | RCT | 5/5 | Multiple Sclerosis - Fatigue | 18 | 44.5 (10.5) | 1.5mA | 15 x 5 | N | S1 | 2 | tDCS treatment normalised network connectivity and neuronal activity dynamics of S1 and M1, partly accounting for the resulting fatigue amelioration |
| Bertoli et al. ( | 2023 | RCT | 4/5 | Multiple Sclerosis - Fatigue | 10 | 35.3 (9.3) | 1.5mA | 15 x 5 | N | S1 | 2 | tDCS treatment induced a change in the physiological direction of the homology between the two corticospinal tracts, related to fatigue amelioration |
| Padalino et al. ( | 2021 | NRT | 11/16 | Multiple Sclerosis - Fatigue | 11 | 36 (8) | 1.5mA | 15 x 6 | N | S1 | 2 | tDCS treatment resulted in decrease cortico-muscular coherence, related to fatigue amelioration |
| Saiote et al. ( | 2014 | RCT | 5/5 | Multiple Sclerosis - Fatigue | 13 | 46.8 (6.8) | 1mA | 20 x 5 | N | LDLPFC | 1a | Higher lesion load predicted positive tDCS treatment response |
| Authors | Date | Study | Quality score | Condition | N | Mean Age (SD) | tDCS current | tDCS mins x sessions | ≥10 sessions | Target area | Biomarker type | Biomarker result |
|---|---|---|---|---|---|---|---|---|---|---|---|---|
| Auvichayapat et al. ( | 2020 | NRT | 12/16 | Autism - Behavior | 10 | 6.60 (0.84) | 1mA | 20 x 5 | N | LDLPFC | 2 | tDCS treatment altered metabolite levels in the brain, concentration level changes of NAA/Cr, Cho/Cr, and mI/Cr were associated with improved symptom scores |
| Robinson - Agramonte et al. ( | 2021 | NRT | 12/16 | Autism - Behavior | 11 | 7.91 (1.58) | 1mA | 20 x 20 | Y | LDLPFC | 2/4 | tDCS treatment resulted in reduced BDNF, no change in IGF-1, as well as improvement in clinical symptom scales |
| Rahimi et al. ( | 2019 | RCT | 3/5 | Dyslexia - Temporal Resolution | 17 | 10.35 (1.36) | 1mA | 20 x 1 | N | Left SDG | 2 | tDCS treatment resulted in reduced latency and increased amplitude of auditory-evoked potentials, related to symptom score improvements. |
| Garnett et al. ( | 2019 | RCT | 4/5 | Stuttering - Speech Fluency | 14 | 22.6 (18–46) | 1.5mA | 20 x 1 | N | SMA | 3b | Stuttering severity predicted the effects of treatment on network activity, but tDCS treatment did not result in clinical improvement |
| Dubreuil-Vall. ( | 2021 | RCT | 4/5 | Attention Deficit Hyperactivity Disorder - Cognitive Control | 40 | 37.53(14.79) | 2mA | 30 x 1 | N | LDLPFC | 2 | tDCS treatment modulated the P300 event-related potential as well as cognitive measures |
| Authors | Date | Study | Quality score | Condition | N | Mean age (SD) | tDCS current | tDCS mins x sessions | ≥10 sessions | Target area | Biomarker type | Biomarker result |
|---|---|---|---|---|---|---|---|---|---|---|---|---|
| Quinn et al. ( | 2020 | RCT | 4/5 | Traumatic Brain Injury - Persistent Post-Traumatic Symptoms | 24 | 33.72 | 2mA | 30 x 10 | Y | LDLPFC | 3b | tDCS treatment altered cerebral blood flow, but this was not associated with neuropsychological performance and behavioural symptoms |
| Kurtin et al. ( | 2021 | NRCT | 17/24 | Traumatic Brain Injury - Brain Network Activity | 34 | 39.4(10.1) | 1.8mA | 18 x 3 | N | Right premotor/IFG | 3a | Fractional Anisotropy is correlated with brain activity changes after tDCS treatment |
| Wilke et al. ( | 2017 | RCT | 3/5 | Traumatic Brain Injury - Cognition/Post-Traumatic Symptoms | 17 | 24.2(2.8) | 1mA | 20 x 3 | N | Left M1 | 4 | tDCS treatment did not modulate GABA concentration and receptor activity |
| Quinn et al. ( | 2022 | RCT | 5/5 | Traumatic Brain Injury - Working Memory | 34 | 34.75(12.81) | 2mA | 30 x 10 | Y | LDLPFC | 2 | tDCS treatment resulted in connectivity changes between the right DLPFC and the left anterior insula, correlated with reaction time improvement |
| Li et al. ( | 2019 | RCT | 2/5 | Traumatic Brain Injury - Cognition | 35 | 39.6(10.1) | 2mA | Variable | N | Right IFG | 1b | Greater post-traumatic Axonal Injury predicted worse response to tDCS treatment |
Peer Reviews
No public reviews on file for this paper yet. If you reviewed it on a platform where reviews are public (OpenReview, ICLR, NeurIPS, ICML), you can paste yours below so the community can read it here.
Videos
No videos yet. Explain this paper in a talk, walkthrough, or lecture? Add one.
Taxonomy
TopicsTranscranial Magnetic Stimulation Studies · Electroconvulsive Therapy Studies · Pain Management and Treatment
Introduction
1
Transcranial Direct Current Stimulation (tDCS) is a non-invasive neuromodulation method that applies low-intensity, persistent direct electric currents to specific cortical regions via scalp electrodes with the electrical current passing between a positively charged anode and a negatively charged cathode. It is used to modulate neuronal activity and increase synaptic plasticity with minimal side effects (1). TDCS changes the rate of baseline neuronal spontaneous depolarisation. With anodal tDCS, the depolarisation of resting membrane potential is facilitated, and neurons fire more easily. With cathodal stimulation, by hyperpolarising the resting membrane potential and the spontaneous combustion rate is lowered (2, 3). tDCS has been shown to be capable of inducing longer lasting neuroplastic changes that are clinically beneficial in the treatment of various neuropsychiatric disorders including Stroke, Traumatic Brain Injury and Depression (4–6). A recent paper using secondary meta-analysis to create evidence-based guidelines, concluded that tDCS is definitely effective (level A evidence) in treating depression, and probably effective (level B evidence) in treating a multitude of neuropsychiatric conditions such as neuropathic pain, Parkinson’s disease, stroke, schizophrenia, and alcohol addiction (7). It has potential to augment current best pharmacological treatment, but it also can be used in lieu of medications in situations where pharmacological treatment is not preferred, such as patient preference or high risk of medication side-effects (8).
Downstream effects of tDCS include neurotransmitter level changes, such as GABA changes, related to motor learning (9), and changes in the levels of monoamines, such as dopamine, which have been shown to play a role in inducing neuroplasticity (10). The effect is a change in functional connectivity in the human brain, in networks dependent on the areas targeted by tDCS treatment (11, 12). It has been shown that tDCS can induce structural plasticity, causing neurostructural changes in the brain (5).
A biomarker is defined by the European Medicines Agency as “An objective and quantifiable measure of a physiological process, pathological process or response to a treatment” (13). Biomarkers are increasingly used both in clinical practice as well as in research, where they commonly serve as endpoints in studies (14). Psychiatric and Neurological disorders are among the disorders with the highest burden of disease worldwide. In 2021, neurological disorders ranked as the leading cause of DALYs, with the largest contributors being stroke, migraine, and Alzheimer’s disease and other dementias (15). However, despite the obvious need for biomarkers in these disorders, and even though we do have a few clinically relevant biomarkers for rarer diseases, such as for fragile X syndrome, there are at present none available for common neuropsychiatric disorders like schizophrenia, bipolar disorder, and major depressive disorder (16, 17).
In the case of tDCS, the hypothesis that certain biomarkers can predict or monitor patient response has been tested by numerous studies. However, the literature has not been assessed in a systematic review. To identify the most promising patients for tDCS, to be able to predict and monitor their progress, the identification of biomarkers is a priority. Candidate biomarkers are needed if novel treatments such as TDCS are to deliver on their promise and on the promise of Precision Medicine.
There is a growing dataset of diverse studies investigating tDCS for a variety of disorders and symptoms. The heterogeneity of the literature is further compounded by the fact that tDCS is used not only for a variable number of sessions, but the sessions also themselves vary in length, and the current applied varies. Lastly, there are different forms of tDCS emerging, such as HD-tDCS. The studies themselves vary in protocol design, the use of a control group and their overall quality. Given this lack of standardization, a traditional systematic review would not be able to best highlight the output of this body of evidence. A scoping review is the most structured and systematic way to reach our objective.
Thus, the aim of this study was to examine the literature in a systematic way, assess the evidence regarding the ability of biomarkers to predict response to tDCS and identify promising candidate biomarkers in neuropsychiatric patient populations.
Methods
2
Database search terms were chosen to give us a wide range of useful results. We included the ‘Human’ filter in our search as we were looking for studies involving human patients. Our intervention was transcranial Direct-Current Stimulation (tDCs) and so search terms included both “transcranial direct current stimulation” and its commonly used abbreviation “tDCS”. “Biomarker” as well as related terms were searched for. Given that data from imaging, specifically MRI, is very often used as a biomarker is such studies, we also searched for MRI and related terms.
The review was registered on the Open Science Framework (osf.io) on 24/09/2023. It may be accessed at https://osf.io/r6mkp/?view_only=64ec4811e21f43ba84fe31496f403ec2.
Searches were carried out on PubMed and Embase on 24/09/2023.
Pubmed search term: “(((tdcs) OR (transcranial direct current stimulation)) OR (Transcranial Direct Current Stimulation[MeSH Terms])) AND (((((((MRI) OR (Magnetic Resonance Imaging)) OR (Magnetic Resonance Imaging[MeSH Terms])) OR (biomarkers[MeSH Terms])) OR (biomarkers)) OR (biomarker)) OR (biological marker))”. Embase search term: “Query(‘mri’/de OR mri OR ‘nuclear magnetic resonance imaging’/exp OR ‘nuclear magnetic resonance imaging’ OR ‘magnetic resonance imaging’/exp OR ‘magnetic resonance imaging’ OR ‘biomarker’/exp OR biomarker OR ‘biomarkers’/exp OR biomarkers OR ‘biological markers’/exp OR ‘biological markers’) AND (tcds OR ‘transcranial direct current stimulation’/exp OR ‘transcranial direct current stimulation’) AND ‘human’/de”. No time limits were set.
Studies were included if they were human clinical trials, if they included biomarker measurements and recorded a response to tDCS, and if they included a patient population. Studies were excluded if they did not have full text available, if they were not in English, if the clinical endpoint was not measured, if the hypothesis of the paper was not clinically relevant, if the population of the study did not include patients, and if the study included fewer than 5 patients. The review conforms to the PRISMA 2020 statement (18).
From the included articles, the following data were extracted: study title, author, year published, study type, condition studied and symptom targeted, patient number, number of male patients, patient age mean (+SD), number that underwent active tDCS, number that underwent sham tDCS, number of healthy controls, primary outcome, primary result, type of tDCS applied, duration and number of tDCS sessions, biomarker studied, biomarker results, type of biomarker. Biomarkers were classified into 4 categories: 1) Baseline, prediction of response/non-response, a biomarker measured at baseline that predicts a predefined clinical response. (In randomized clinical trials, this was further classified as 1a- general prognostic marker or 1b-a treatment-modifying biomarker, when a control arm was present). 2) Biomarkers reflecting clinical effect, 3a) Biomarkers correlated with treatment but clinical effect/change unclear/not established, 3b) Biomarkers correlated with treatment but clinical effect not achieved and 4) Biomarkers not correlated with treatment. Studies were also classified according to the characteristics of the applied tDCS protocol.
The quality of each study was assessed using structured quality assessment tools, according to the type of study. Randomised Controlled Trials were assessed using the Jadad Scale, Cohort Trials using the Newcastle-Ottawa Scale and Non-Randomised trials using the MINORS scale.
Results
3
Search in Pubmed resulted in 788 results and Embase resulted in 1915 results respectively. After combining the results and automatically excluding duplicated results, 2196 studies were left. Meta-analyses were manually reviewed, and 17 results were added from citation searching from meta-analyses. The results were first screened for full-text review by reading the Title and Abstract. Studies that were not excluded by Title/Abstract review underwent a full-text review and the inclusion/exclusion criteria applied. 219 studies were selected for full-text review. Finally, 154 studies were included in the analysis and data extracted. The process of review can be seen in Figure 1.
PRISMA flowchart describing the study selection process.
Quality assessment of studies
3.1
Most studies in our review were randomized controlled trials (RCTs), which occupies the highest rank available to single studies in the hierarchy of evidence (19). 113 out of a total of 154 studies were RCTs and were graded on the Jadad scale (20) out of 5. 94 out of 113 (83%) of RCTs were graded at least 3/5, indicating a high quality of study. Non-randomized trials were assessed with the MINORS scale (21). 25 studies were non-randomized, non-controlled trials, graded out of 16 points, and 14 studies were non-randomized, controlled trials, graded out of 24 points. We designated high quality studies as achieving at least 12/16 or 18/24 on the MINORS scale. 14 out of 25 (56%) of non-controlled trials achieved at least 12/16, but only 5 out of 14 controlled trials (36%) received an assessment of at least 18/24.
2 Retrospective Studies were also identified, and their quality assessed by the Ottawa Scale (22). Both ranked 6/9, which would indicate a low-quality study.
Data grouping
3.2
There were 10 condition/symptom groups identified, as well as a group containing various conditions that could not be grouped with any other. The studies were divided into subgroups by condition group studied. Conditions were grouped by overall symptom similarity and the mechanisms involved in symptom production. Each study was only included in one group. The biomarkers that were found be predictive in each subgroup were found and grouped by frequency. In this way, we were able to identify the most commonly identified biomarkers that might have clinical utility in each condition group. We chose to highlight biomarkers that were identified as predictive (biomarker category 1) in at least two studies per condition group. Although an arbitrary cut-off point, this threshold was chosen in order to apply the replication criterium and be also inclusive enough to identify potential predictive biomarkers for future study. In addition, a more broadly comparable operationalization was applied for replication, and by category rather than consistent directionality and identical metric. The groups of conditions studied, the number of biomarker candidates identified and the biomarkers with positive results in two or more studies per group can be seen in Table 1.
Stroke/aphasia biomarkers
3.2.1
Table 2 shows the data from the Stroke/Aphasia group. This group included 45 studies, 37 of them RCTs. 1045 patients were included in total. 14 biomarkers were identified as potential candidates, 4 of these were identified as being predictive biomarkers (Biomarker Type 1) in at least two different studies. These were: Functional Connectivity, Cortical activity, White matter features, Baseline Damage. Two of those biomarkers, Functional Connectivity and Cortical Activity, along with GABA concentration changes were identified as biomarkers reflecting clinical changes in at least two studies. 24 studies utilized 1mA for the tDCS protocol, 18 studies used 2mA and 3 of them 1.5mA. 31 studies set the session time at 20 minutes. 21 studies only delivered 1 session of tDCS treatment, while 24 studies delivered 10 or more sessions. The most common targets for tDCS were the inferior frontal gyrus for Aphasia studies and the primary motor cortex for motor deficit studies.
Psychotic disorders biomarkers
3.2.2
Table 3 shows the data from the Psychotic Disorders group. This group included 18 studies, 12 of them RCTs. 584 patients were included in total. 8 biomarkers were identified as potential candidates. However, only 3 studies identified predictive biomarkers, and none of these appeared more than once. 9 studies found that biomarker change was reflective of clinical change, and of these studies 3 identified Functional Connectivity and 2 identified Cortical Activation as potential reflective biomarkers. All but one of the studies utilized 2mA for the tDCS protocol current. 16 studies set the session time at 20 minutes, the other two at 30 minutes. 7 studies only delivered 1 or sessions of tDCS treatment, 10 studies delivered 10 sessions, and one delivered 50. The most common target for tDCS was the left dorsolateral prefrontal cortex, being a target in 13 studies.
Affective disorders biomarkers
3.2.3
Table 4 shows the data from the Affective Disorders group. This group included 16studies, 12 of them RCTs. 782 patients were included in total. 11 biomarkers were identified as potential candidates. None of them emerged as predictive (type 1) or reflective (type 2) in two or more studies. 13 studies utilized 2mA for the tDCS protocol, making it by far the most popular current used for this group. 2 studies used 1.5mA and one used 1mA.15 studies set the session time at 20 or 30 minutes. Most studies delivered multiple sessions, with 14 studies delivery 10 or more. The most common target for tDCS, with 14 studies, was the left dorsolateral prefrontal cortex.
Neurocognitive disorders biomarkers
3.2.4
Table 5 shows the data from the Neurocognitive Disorders group. This group included 17 studies, 14 of them RCTs. 398 patients were included in total. 13 biomarkers were identified as potential candidates. None emerged as predictive biomarkers. Functional Connectivity (identified in 3 studies) and Brain Network Configurations on fMRI (identified in 2 studies)-emerged as potential type 2 - reflective - biomarkers. 7 studies utilized 2mA for the tDCS protocol, 5 studies used 1mA and 3 of them 1.5mA. One study used slow-oscillatory tDCS, where the current oscillated sinusoidally at a frequency of 0.75 Hz. 13 studies set the session time at 20 minutes. 7 studies only delivered 1 session of tDCS treatment, 1 study delivered the most seen in our review, at 180 sessions. The most common target for tDCS was the left dorsolateral pre-frontal cortex, being a target in 8 studies.
Pain disorders biomarkers
3.2.5
Table 6 shows the data from the Pain Disorders group. This group included 13 studies, 7 of them RCTs. 275 patients were included in total. 10 biomarkers were identified as potential candidates and 2 of these - Functional Connectivity and Glutamate/Glutamine levels in the ACC - were identified as type 2 biomarkers - reflecting clinical change -in at least two different studies. Each of these 2 biomarkers were also identified as predictive in a single study each, however this does not reach the cut-off threshold of two studies. 10 studies utilized 2mA for the tDCS protocol, 3 studies used 1mA. All studies set the session time at 20 minutes. 7 studies delivered 5 sessions of tDCS treatment, while 5 studies delivered 10 or more sessions. The most common target for tDCS, in 10 studies, was the primary motor cortex.
Addiction disorders biomarkers
3.2.6
Table 7 shows the data from the Addiction Disorders Group. This group included 11 studies, all but one of them RCTs. 387 patients were included in total. 6 biomarkers were identified as potential candidates and of these only Functional Connectivity was identified in at least two different studies as a potential biomarker reflecting clinical response. None of the studies in this group found, as a result, predictive biomarkers. 8 studies utilized 2mA for the tDCS protocol, 3 studies used 1mA. One study used a session time of 15 minutes, while the rest of 20 to 30 minutes. 8 studies delivered only 5 or fewer sessions of tDCS treatment, while only 3 studies delivered 10 sessions. The most common target for tDCS, in 9 studies, was the dorsolateral prefrontal cortex.
Disorders of consciousness biomarkers
3.2.7
Table 8 shows the data from the Disorders of Consciousness group. This group included 7 studies, however only 3 of them were RCTs. 126 patients were included in total. 5 biomarkers were identified as potential candidates; however, none were identified in at least two different studies as the same type of biomarker. All studies utilized 2mA and 20-minute sessions for the tDCS protocol. Four of the studies delivered only 1 session of tDCS treatment, while only 3 studies delivered 10 or more sessions. The most common target for tDCS, in 6 studies, was the left dorsolateral prefrontal cortex.
Multiple sclerosis biomarkers
3.2.8
Table 9 shows the data from the Multiple Sclerosis group. This group included 5 studies, 4 of them RCTs. 73 patients were included in total. 5 biomarkers were identified as potential candidates, however none of these was identified in at least two different studies. 4 studies utilized a tDCS protocol called FaReMuS, delivering 5 15-minute sessions of tDCS at 1.5mA and targeting the S1 area.
Neurodevelopmental disorders biomarkers
3.2.9
Table 10 shows the data from the Neurodevelopmental Disorders group. This group included 5 studies, 3 of them RCTs. 92 patients were included in total. 5 biomarkers were identified as potential candidates and 1 of these -EEG features- was identified in at least two different studies as a Type 2 biomarker - reflective of clinical changes. 3 studies utilized 1mA current for the tDCS protocol, and 1 study each utilized 1.5mA and 2mA. 4 studies delivered tDCS sessions of 20 minutes duration. 3 study protocols only delivered one tDCS session, and only 1 study in this group delivered more than 5 sessions. The most common target, (in 3 studies), was the left dorsolateral pre-frontal cortex.
Traumatic brain injury biomarkers
3.2.10
Table 11 Shows the data from the Traumatic Brain Injury group. This group included 5 studies, 4 of them RCTs. 144 patients were included in total. 4 biomarkers were identified as potential candidates, however none of these were identified in at least two different studies. 3 studies utilized 2mA current for the tDCS protocol. 2 studies delivered tDCS sessions of 30 minutes duration, and one study had variable duration of tDCS sessions, lasting as long as fMRI. 2 study protocols delivered 3 tDCS sessions, and 2 studies in this group delivered 10 sessions. There were varied targets for tDCS in this group, with two studies targeting the left dorsolateral pre-frontal cortex, and other studies targeting the primary motor cortex and the inferior frontal gyrus.
Discussion
4
In this systematic scoping review, we identified potential biomarkers to predict response to tDCS in neuropsychiatric patient populations, as well as biomarkers reflecting clinical change.
Potential predictive biomarkers, classified as Type 1 Biomarkers in this review, were only identified in the largest group in our study, Stroke/Aphasia group. These four were Functional Connectivity, Cortical Activity, White Matter Features and Baseline Damage. The most common promising predictive biomarker in the review was functional connectivity.
The other type of biomarkers identified, were classified as Type 2, Biomarkers reflecting clinical response. We identified five potential biomarkers of this type in at least two studies across our study groups: Functional Connectivity, Cortical Activity, Brain GABA levels, Glutamate/Glutamine levels in the ACC and EEG Features. In five out of ten symptom/disorder groups, the biomarker with the most studies supporting its use reflecting response, was measures of Functional Connectivity of the brain. Our review found that as per the literature, FC is a promising predictive biomarker for tDCS response in Stroke/Aphasia, and a promising candidate as a biomarker reflecting response in Stroke/Aphasia, Psychotic Disorders, Neurocognitive Disorders, Pain Disorders and Addiction Disorders. Functional connectivity (FC) can be defined as “temporal correlations between spatially remote neurophysiological events” (162). Different functional neuroimaging techniques, such as fMRI, EEG, fNIRS etc. can be used to record signals which are then analyzed. FC can be measured at resting-state conditions, or it can be task-based. Various different analysis methods are used to estimate FC, such as: network-based functional connectivity analysis, used to delineate FC within a previously defined network of regions; resting-state functional connectivity, a time series correlation in BOLD(blood-oxygen dependent level) fMRI data acquired during the absence of an external task; and seed-based FC analysis, which delineates FC of one or more seed regions with the rest of the brain (163).
In most of the studies in this analysis, FC was defined as the statistical interdependence of BOLD signals between different regions of the brain, measured using (fMRI)). In a smaller subset of studies, other measurements such as of EEG recording features were used as to estimate FC. Specifically, fMRI has grown over the last few decades into one of the most common methods for investigating human brain function in various domains of medicine such as psychiatry and neurology (164). It is one of the most promising biomarkers in these fields, with a rapidly expanding body of evidence in the literature (165). FC has been used as a biomarker for diagnostic and patient selection purposes, such as identifying different subtypes of depression (166), to predict treatment response, such as to transcranial magnetic stimulation (167) or medications (168). In our scoping review, it surpassed any other single biomarker in the number of studies where it was of value as a biomarker, and this is to be expected given the enthusiasm with which it has been studied as a biomarker in the last years. This wide range of usefulness makes sense, given that FC can be measured for any area of the brain and therefore could theoretically be applied to areas implied in all our symptom/disorder groups. In this review it emerged as a potential biomarker that reflects response and thus could be used as a monitoring biomarker in a wide range of disorders, but also as a potential predictive biomarker in the area of Stroke/Aphasia.
EEG features were identified as a potential biomarker reflective of clinical changes in at least two studies in the group of Neurodevelopmental Disorders. It is a safe and non-invasive test, and has been used in the past to identify biomarkers in many psychiatric and neuropsychiatric disorders such as depression (169, 170), PTSD (169) and dementia (171, 172). Event-related potentials (ERPs), which are EEG changes triggered by stimuli, were specifically identified as potential biomarkers in the Neurodevelopmental Disorders group.
Cortical activation was found to be a promising predictive (type 1) biomarker in more than two studies in the Stroke/Aphasia group and a potential response (type 2) biomarker which ended up having positive results in two or more studies in the Stroke/Aphasia, and Psychotic Disorders groups. Given the functions of different parts of the cortex, the results were not surprising. The motor cortex can be a target for post-stroke movement deficits (173). Aphasia, either Primary Progressive or post-stroke, has clinical correlates in different areas of the cortex (174). In psychotic symptoms, we know that the cortex can play a significant role, such as in auditory hallucinations, where we have aberrant activation of the auditory cortex (175).
Anatomical features were identified as potential biomarkers predictive of clinical response in the Stroke/Aphasia group. They were White Matter features and Baseline damage. White matter injury in stroke is a predictive biomarker of disability (176) and of clinical outcome and white matter injury can be used as a biomarker for long-term cerebrovascular disease and dementia (177). Stroke lesion volume, grey and white matter network disruption are related to the degree of post-stroke somatosensory deficits (178).
In addition, other types of biomarkers were identified such as brain neurotransmitter levels. In the Stroke/Aphasia group, GABA levels were found to change as a result of clinical response in two studies. In fact, GABA level changes were previously identified as correlated with motor improvements after stroke (179). One of the studies in this group used GABA levels in the inferior frontal gyrus in the prefrontal cortex, an area implicated in aphasia (180). In the Pain Disorders group, two studies examined the levels of Glutamate/Glutamine in the ACC, which is involved in pain perception modulation and function abnormally in chronic pain disorders (181). Specifically, it has been shown in animal studies that glutamatergic neuronal transmission modulates pain-related aversion and contributes to chronic pain (182, 183). In humans, glutamate+glutamine concentrations at the ACC increase with the onset of pain (184).
The proposed mechanism of tDCS, i.e. increased synaptic plasticity and subsequent neurostructural brain changes, is suggestive of the potential biomarkers that might be useful in this area. Such changes in the short and long-term, are related to, and in certain studies, have been correlated to changes in the biomarkers referred to in this review, such as Functional Connectivity, Cortical activation and features of EEG. However, a large proportion of the studies included in this review delivered only a single session of tDCS and monitored biomarker changes only in the very short term, which does not fully elucidate the neurostructural changes that are the possible result of tDCS treatment.
Limitations and strengths
5
The main strength of this review is the systematic nature with which it was undertaken. Another strength is that the search strategy was very broad with few exclusion criteria, and a large number of results were reviewed for inclusion. It was very positive that most of the studies included were RCTs, and the large majority of those were of high quality. An important positive indicator for the candidate biomarkers is that the biomarkers identified could be connected via their mechanism of action to clinical effects and have also been proposed as biomarkers in similar research. The main weakness is the large amount of heterogeneity in the studies. We found that studies varied widely, in the tDCS parameters such as current and the number and duration of tDCS sessions delivered. Studies also differed in regard to study design, study quality and the endpoints used. In addition, the classification of Functional Connectivity as biomarkers in this review, included different modalities used in the included studies, thus adding heterogeneity in the analysis and results. This heterogeneity means that the review could not attempt a statistical meta-analysis. Another important issue is the clinical relevance of the application of biomarkers including fMRI. For biomarkers to be applicable, they such be feasible in clinical practice as well as cost-effective. The scalability of their application is also an important issue that needs to be addressed before introducing them to clinical praxis. Easily available biomarkers such as EEG and clinical measures might be more easily applicable, especially if they are already available.
Conclusion
6
In this systematic scoping review on biomarkers to predict and monitor tDCS results, we extracted data from 154 studies, divided by distinct groups according to disorder or symptoms studied. We identified biomarkers that had positive results in at least two studies in their study group either as predicting or reflecting clinical response. The most common biomarker with promising results overall was functional connectivity, with cortical activity the other biomarker that was found to have the most positive results predicting and monitoring tDCS response. Future tDCS research should focus on these biomarkers as they have the biggest evidence base, wide-ranging applications and plausible mechanisms of action. Research should focus on standardising tDCS protocols when it comes to current used, number and duration of sessions. As the potential mechanism of action of tDCS includes long-term, downstream neurostructural changes, the research should investigate this by delivering more sessions over a longer period and monitoring long-term biomarker changes that would reflect those downstream effects.
The reference list from the paper itself. Each links out to its DOI / PubMed record.
- 1Matsumoto H Ugawa Y . Adverse events of t DCS and t ACS: A review. Clin Neurophysiol Pract. (2016) 2:19. doi: 10.1016/j.cnp.2016.12.003, PMID: 30214966 PMC 6123849 · doi ↗ · pubmed ↗
- 2Reato D Salvador R Bikson M Opitz A Dmochowski J Miranda PC . Principles of transcranial direct current stimulation (t DCS): introduction to the biophysics of t DCS. In: Knotkova H Nitsche MA Bikson M Woods AJ , editors. Practical guide to transcranial direct current stimulation: principles, procedures and applications. Springer International Publishing, Cham (2019). p. 45–80. doi: 10.1007/978-3-319-95948-1_2, PMID: · doi ↗
- 3Yamada Y Sumiyoshi T . Neurobiological mechanisms of transcranial direct current stimulation for psychiatric disorders; neurophysiological, chemical, and anatomical considerations. Front Hum Neurosci. (2021) 15:631838. doi: 10.3389/fnhum.2021.631838, PMID: 33613218 PMC 7890188 · doi ↗ · pubmed ↗
- 4Woods AJ Antal A Bikson M Boggio PS Brunoni AR Celnik P . A technical guide to t DCS, and related non-invasive brain stimulation tools. Clin Neurophysiol. (2016) 127:1031–48. doi: 10.1016/j.clinph.2015.11.012, PMID: 26652115 PMC 4747791 · doi ↗ · pubmed ↗
- 5Jog MA Anderson C Kubicki A Boucher M Leaver A Hellemann G . Transcranial direct current stimulation (t DCS) in depression induces structural plasticity. Sci Rep. (2023) 13:2841. doi: 10.1038/s 41598-023-29792-6, PMID: 36801903 PMC 9938111 · doi ↗ · pubmed ↗
- 6Abraham M Poulopoulos N Larson E . Clinical utility of transcranial direct current stimulation (t DCS) following traumatic brain injury and stroke. Arch Phys Med Rehabil. (2019) 100:e 149. doi: 10.1016/j.apmr.2019.08.454, PMID: 41815951 · doi ↗
- 7Fregni F El-Hagrassy MM Pacheco-Barrios K Carvalho S Leite J Simis M . Evidence-based guidelines and secondary meta-analysis for the use of transcranial direct current stimulation in neurological and psychiatric disorders. Int J Neuropsychopharmacol. (2020) 24:256. doi: 10.1093/ijnp/pyaa 051, PMID: 32710772 PMC 8059493 · doi ↗ · pubmed ↗
- 8Sreeraj VS Arumugham SS Venkatasubramanian G . Clinical practice guidelines for the use of transcranial direct current stimulation in psychiatry. Indian J Psychiatry. (2023) 65:289. doi: 10.4103/Indianjpsychiatry.Indianjpsychiatry_496_22, PMID: 37063621 PMC 10096202 · doi ↗ · pubmed ↗