Association between serum potassium levels and haematoma expansion in intracerebral hemorrhage: a retrospective cohort study
Rong Wu, Min Jiang, Bing Bao, Qi Li, Jiaojiao Meng, Meili Shen, Jian Wang, Xiaoping Yin, Moxin Wu

TL;DR
Low serum potassium levels are linked to increased brain bleeding after strokes, suggesting potassium may influence stroke severity.
Contribution
This study identifies a novel association between low serum potassium and haematoma expansion in intracerebral hemorrhage patients.
Findings
After matching, HE patients had significantly lower potassium levels than non-HE patients.
Low potassium was significantly associated with HE, with an adjusted odds ratio of 0.36.
The area under the ROC curve was 0.635, indicating moderate predictive value of potassium levels for HE.
Abstract
Serum potassium levels are risk factors for intracerebral hemorrhage (ICH), and haematoma expansion (HE) is an important determinant of poor prognosis in patients with ICH. This study investigated the correlation between serum potassium levels and HE after ICH. This retrospective study analyzed serum potassium levels in ICH patients. On the basis of imaging criteria (haematoma volume increase ≥33% or absolute enlargement >6 ml), patients were categorized into the HE subgroup. Differences in serum potassium levels were compared using the Mann–Whitney U-test. Propensity score matching (PSM) was applied to balance baseline characteristics between the HE subgroup and the non-HE subgroup for further comparison. Additionally, adjusted logistic regression analyses and receiver operating characteristic (ROC) curves were employed to evaluate the correlation between HE and serum potassium…
Genes, proteins, chemicals, diseases, species, mutations and cell lines named across the full text — each resolved to its canonical identifier and authoritative record.
Click any figure to enlarge with its caption.
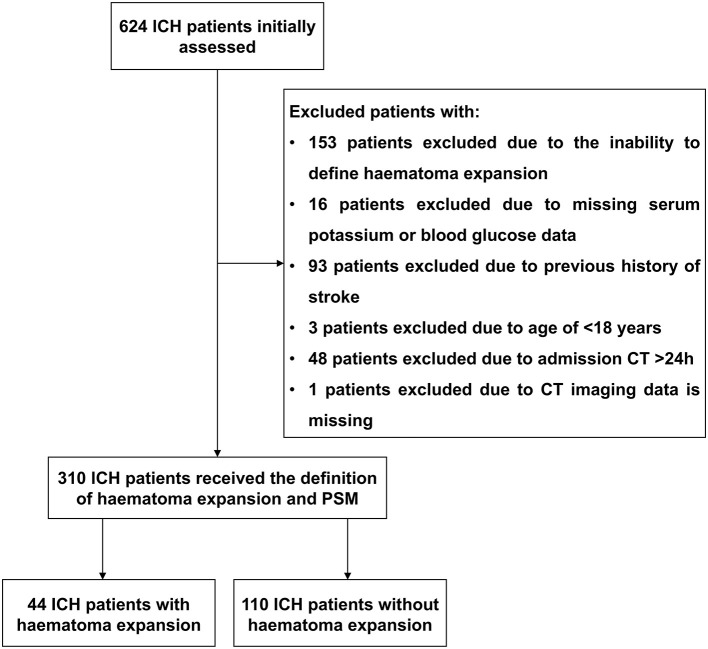 Figure 1
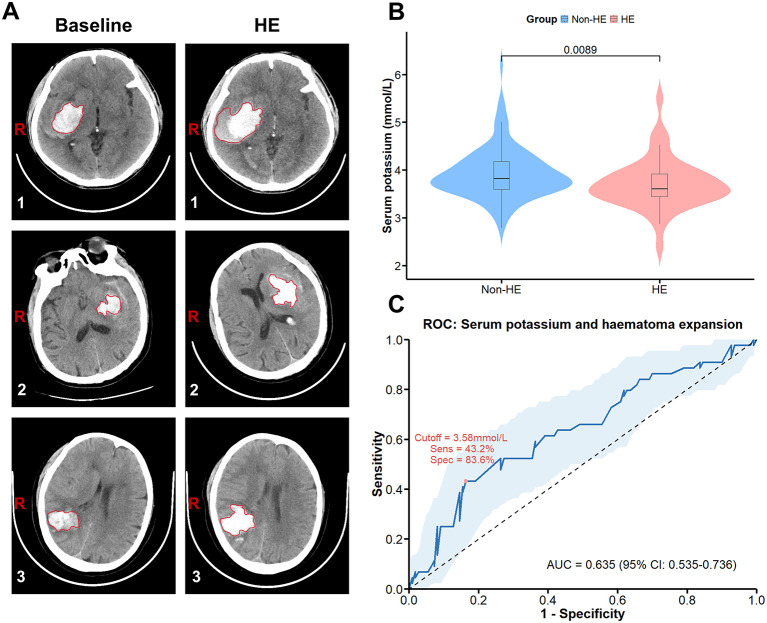 Figure 2
|
|
|
| |||||
|---|---|---|---|---|---|---|---|
|
|
|
| |||||
| Male, | 176 (67.69%) | 38 (76.00%) | 0.318 | 81 (73.63%) | 33 (75.00%) | 0.01 | 1.000 |
| Age, years (mean ± SD) | 63.29 ± 13.87 | 65.68 ± 13.92 | 0.267 | 65.04 ± 13.26 | 64.91 ± 14.28 | 0.1 | 0.971 |
| Baseline haematoma volume | 14,878.29 ± 16,180.68 (9,480.00 [15,585.75]) | 27,426.36 ± 26,109.17 (20,881.50 [26,959.25]) | 0.001** | 17,579.55 ± 15,678.80 (14,767.50 [18,081.50]) | 21,347.30 ± 16,310.14 (16,559.00 [24,234.0]) | 0.01 | 0.112 |
| Hypertension, | 158 (60.76%) | 33 (66.00%) | 0.590 | 77 (70.00%) | 29 (65.91%) | 0.06 | 0.762 |
| Diabetes mellitus, | 25 (9.61%) | 8 (16.00%) | 0.275 | 14 (12.73%) | 5 (11.36%) | 0.02 | 1.000 |
| Smoking, | 61 (23.46%) | 13 (26.00%) | 0.837 | 27 (24.55%) | 11 (25.00%) | 0.05 | 1.000 |
| Alcohol, | 45 (17.30%) | 11 (22.00%) | 0.555 | 24 (21.82%) | 9 (20.45%) | 0.08 | 1.000 |
| Admission systolic blood pressure | 170.40 ± 27.62 | 175.02 ± 27.69 | 0.283 | 173.30 ± 29.28 | 175.16 ± 28.79 | 0.02 | 0.658 |
| Blood glucose level (mmol/L) | 8.19 ± 2.73 | 7.94 ± 2.41 | 0.643 | 7.73 ± 2.17 | 7.68 ± 2.16 | 0.03 | 0.815 |
| Leucocyte count ( × 10 ( | 8.95 ± 3.60 | 8.44 ± 3.29 | 0.411 | 8.87 ± 3.37 | 8.26 ± 3.36 | 0.1 | 0.282 |
| Serum potassium level (mmol/L) | 3.88 ± 0.49 | 3.71 ± 0.51 | 0.015* | 3.92 ± 0.52 | 3.71 ± 0.52 | – | 0.009** |
|
|
|
| ||
|---|---|---|---|---|
|
|
|
|
| |
| Age | 0.99 (0.97–1.02) | 0.955 | 1.00 (0.97–1.03) | 0.892 |
| Gender | 1.07 (0.49–2.47) | 0.861 | 1.23 (0.51–3.08) | 0.651 |
| Baseline haematoma volume | 1.00 (0.99–1.00) | 0.186 | 1.00 (0.99–1.00) | 0.133 |
| Hypertension | 0.83 (0.40–1.72) | 0.621 | 0.85 (0.37–1.99) | 0.701 |
| Diabetes mellitus | 0.88 (0.27–2.47) | 0.816 | 1.47 (0.37–5.34) | 0.566 |
| Smoking | 1.02 (0.44–2.26) | 0.953 | 0.86 (0.30–2.37) | 0.779 |
| Alcohol | 0.92 (0.37–2.12) | 0.852 | 1.05 (0.35 −3.05) | 0.923 |
| Admission systolic blood pressure | 1.00 (0.99–1.01) | 0.720 | 1.00 (0.99–1.01) | 0.798 |
| Blood glucose level | 0.99 (0.83–1.16) | 0.880 | 0.96 (0.76–1.19) | 0.696 |
| Leucocyte count | 0.94 (0.83–1.05) | 0.312 | 0.92 (0.79–1.04) | 0.212 |
| Serum potassium level | 0.41 (0.18–0.87) | 0.027* | 0.36 (0.15–0.80) | 0.017* |
Peer Reviews
No public reviews on file for this paper yet. If you reviewed it on a platform where reviews are public (OpenReview, ICLR, NeurIPS, ICML), you can paste yours below so the community can read it here.
Videos
No videos yet. Explain this paper in a talk, walkthrough, or lecture? Add one.
Taxonomy
TopicsIntracerebral and Subarachnoid Hemorrhage Research · Potassium and Related Disorders · Traumatic Brain Injury and Neurovascular Disturbances
Introduction
Intracerebral hemorrhage (ICH), a subtype of stroke caused by cerebrovascular rupture, accounts for approximately 3.28 million new cases annually worldwide. This represents approximately 28.8% of all stroke types and is associated with high rates of disability and mortality (1, 2). Haematoma expansion (HE), which occurs in approximately 30% of ICH patients within the first 24 h, is a major determinant of early neurological deterioration and poor clinical outcomes (3–5). Neuroimaging, particularly computed tomography (CT), remains the gold standard for diagnosing ICH and assessing haematoma status (6). The “spot sign” observed on CT angiography is a significant imaging marker (7) for predicting HE and facilitates the identification of patients who may require urgent intervention. Recent studies suggest that biochemical markers, such as serum electrolyte levels, may also provide additional prognostic information (8–12).
Electrolyte imbalances are frequently observed in acute stroke and may reflect underlying pathophysiological responses to brain injury. In particular, the acute neuroendocrine stress response to ICH—mediated by activation of the sympathoadrenal axis and hypothalamic-pituitary-adrenal axis—leads to increases in catecholamines and cortisol. These hormonal changes can drive intracellular potassium shifts, resulting in reduced serum potassium concentrations (13, 14). Clinical studies have reported significantly lower serum potassium levels in patients with ICH than in those with ischaemic stroke (15).
Experimental models have also implicated potassium homeostasis in the pathogenesis of ICH. In a collagenase-induced ICH mouse model, deletion of the TREK-1 potassium channel was shown to impair vascular endothelial integrity and disrupt the blood–brain barrier, potentially exacerbating haemorrhagic progression (16). Despite these mechanistic insights, the association between serum potassium levels at admission and HE in ICH patients remains unclear.
This study aimed to investigate the relationship between baseline serum potassium levels and HE in patients with spontaneous ICH, with the goal of identifying its potential as a biomarker.
Methods
Study cohort
This real-world retrospective cohort study was conducted between January 31, 2020 and December 31, 2024 in patients with acute spontaneous ICH diagnosed by head CT scans and admitted to Afffliated Hospital of Jiujiang University. All patients were hospitalized within 24 h after stroke, and their haematomas received non-operative treatment. The exclusion criteria were: (1) age less than 18 years; (2) surgical treatment; (3) ICH resulting from TBI, haemorrhagic transformation of cerebral infarction, intracranial aneurysm, intracranial tumors, arteriovenous malformation, venous sinus thrombosis, or moyamoya disease; and (4) other specific conditions, such as severe infections within the past month, known malignancies, and autoimmune diseases. All patients received standardized blood pressure management according to the AHA/ASA guidelines (17). This study was approved by the Institutional Review Boards at the Affiliated Hospital of Jiujiang University. Patient informed consent was waived in accordance with national legislation and institutional requirements.
Data collection
The diagnosis and location of the ICH were verified by clinical neuroradiologists or trained study staff. All CT scans were performed without intravenous contrast injection. All CT images were saved in Digital Imaging and Communications in Medicine format and further reviewed independently by two experienced readers (B.B. and X.P.Y.) who were blinded to the clinical outcomes. Semiautomated CT volumetric measurements were performed using ITK-SNAP software (University of Pennsylvania, Philadelphia, USA; URL: http://www.itksnap.org) to assess haematoma volume. HE was defined as a haematoma growth of more than 33% and/or more than 6 ml in 24 h compared with the baseline haematoma. Peripheral venous blood samples were collected within 24 h of patient admission. Demographic data (age, sex), vascular risk factors (hypertension, diabetes mellitus), lifestyle factors (smoking, alcohol consumption), clinical and imaging parameters (systolic blood pressure on admission, baseline haematoma volume), and laboratory parameters (white blood cell count, blood glucose) were recorded.
Serum potassium level detection
Baseline serum potassium was measured immediately upon admission (prior to intervention). Subsequent measurements were taken on Days 1, 3, 7, and 14. To measure serum potassium levels, blood samples were centrifuged at 3,000 rpm for 5 min, after which serum samples were separated and serum potassium levels were measured using a Beckman Coulter AU5831 automated biochemistry analyser (Beckman Coulter Inc., Brea, CA, USA) according to the manufacturer's instructions for the use of the Beckman Coulter Bioanalytical System buffer. Measurements were performed by senior laboratory technicians who were blinded to the clinical data to ensure objective and reliable results. The normal reference range for serum potassium in this laboratory is 3.5–5.5 mmol/L.
Statistical analysis
Continuous variables were analyzed using the Mann–Whitney U-test, and categorical variables were compared with the chi–square test. To control for baseline confounders, we performed 1:3 propensity score matching (PSM) with the nearest neighbor method, setting a caliper width of 0.1. We evaluated predictive performance by plotting the receiver operating characteristic (ROC) curve and used a multivariable logistic regression model to assess the effect of serum potassium levels on HE. To evaluate the robustness of the findings, multiple imputation was used to assess the sensitivity to missing data. Influential points were identified based on Cook's distance, with the threshold set at 4/(n–p). The variance inflation factor (VIF) was calculated to diagnose multicollinearity. Internal validation was performed using the bootstrap method with 1,000 repetitions. The assessment of model calibration was performed via the Hosmer–Lemeshow test with 10 groups. The decision curve analysis (DCA) was performed to examine the clinical utility of the model. Statistical analyses were performed using R version 4.4.3 (MatchIt package version 4.7.2; pROC package version 1.18.5; mice package version 3.19.0; rmda package version 1.6; car package version 3.1-3; boot package version 1.3-31; rms package version 8.1-0; ResourceSelection package version 0.3-6). p < 0.05 was considered to indicate statistical significance.
Results
Patient selection and characteristics
During the study period, a total of 624 patients with acute spontaneous ICH who were hospitalized within 24 h of symptom onset were initially included. Afterwards, 314 patients were excluded on the basis of the exclusion criteria shown in Figure 1. Finally, 310 patients with ICH were included in this study. Among them, 50 (16.12%) patients were in the HE subgroup. After PSM, 44 and 110 patients were in the HE and non-HE subgroups, respectively. Patient characteristics were well matched (Table 1). The demographic and clinical characteristics of the patients are shown in Table 1.
Flowchart of screening of eligible acute spontaneous ICH patients. Initially, we evaluated 624 patients with ICH and excluded 314 patients with ICH. After PSM, 154 patients with ICH were ultimately included, 44 in the HE subgroup and 110 in the non-HE subgroup. ICH, intracerebral hemorrhage; HE, haematoma expansion; PSM, propensity score-matched.
Correlation of low serum potassium levels with haematoma expansion
Figure 2A shows the representative CT imaging diagnoses of the patients used for analysis. In the unmatched cohort, serum baseline potassium levels were lower in the HE subgroup than in the non-HE subgroup (3.71 ± 0.51 vs. 3.88 ± 0.49, p = 0.015) (Supplementary Figure S1). After PSM, serum baseline potassium levels were significantly lower in the HE subgroup than in the non-HE subgroup (3.71 ± 0.52 vs. 3.92 ± 0.52, p = 0.009; Figure 2B). Moreover, after adjusting for baseline confounders by multifactorial logistic regression (Table 2), low serum potassium levels were significantly associated with HE (adjusted Odds Ratio (aOR) = 0.36, 95% CI: 0.15–0.80; p = 0.017). To assess its discriminative ability, the ROC curve for serum potassium levels and HE yielded an area under the curve (AUC) of 0.635 (95% CI: 0.535–0.736) (Figure 2C).
In the PSM cohort, low potassium levels were associated with HE in patients with ICH. (A) CT images of patients with ICH were used for analysis, with the left image representing a baseline haematoma and the right image representing HE. (B) Serum potassium levels in the HE subgroup and the non-HE subgroup. (C) ROC curve of serum potassium levels for HE. ICH, intracerebral hemorrhage; HE, haematoma expansion; ROC, receiver operating characteristic; AUC, area under the curve.
In the validation analysis (Supplementary Figure S2), stability analysis supported the reliability of the results, while the model itself demonstrated good calibration (Hosmer–Lemeshow test, p = 0.27). DCA confirmed its strong clinical utility. In addition, we employed 1:1 nearest neighbor matching to obtain complete serum potassium level data for Days 1, 3, 7, and 14 from the HE subgroup (n = 28) and non-HE subgroup (n = 32). On this basis, we analyzed changes in serum potassium levels between the two subgroups at the aforementioned time points. (Supplementary Table S1). The results revealed that serum potassium levels significantly changed in the HE subgroup during each corresponding period, especially during the D7–D14 period (p = 0.0083). The connecting lines of individual serum potassium values had a large degree of dispersion and a high fluctuation range, indicating that the magnitude of change in serum potassium levels in the HE subgroup was significantly greater than that in the non-HE subgroup (Supplementary Figure S3). This model demonstrates modest predictive performance; its primary value lies in hypothesis generation. This clearly reflects the exploratory nature of the study, and its findings should not be applied to direct clinical decision-making.
Discussion
ICH occurs due to vessel rupture (2, 18) with hypertension being the most common cause (1, 19, 20). Long-term hypertension induces arteriolar pathological changes (21, 22), making vessels susceptible to rupture during sharp increases in blood pressure. In our study, more than 60% of the ICH patients in both the unmatched cohort and the PSM cohort had a history of hypertension. These findings further demonstrate that hypertensive ICH is the most common type of ICH. Our findings somewhat contrast those of Brouwers et al. (3), but align with Dowlatshahi et al. (23), who reported an HE incidence of 13–32%.The discrepancy observed between our study and Brouwers et al. (3) may be attributed to specific inclusion criteria in this research, such as restricting the time window from onset to baseline imaging to within 24 h, or to differences in population characteristics.
In the acute-phase treatment of ICH, controlling hypertension (24–26) and intracranial pressure (27, 28) is the central objective and is aimed at reducing the risk of cerebral oedema and neurological deterioration (29, 30). Commonly used antihypertensive agents and intracranial pressure-lowering medications, such as thiazide diuretics, mannitol, and furosemide, can all lead to decreased serum potassium levels. Current evidence is insufficient to establish that this drug-induced reduction in serum potassium directly causes HE. HE is associated with coagulation dysfunction (31–33). This study suggests that low serum potassium levels are associated with HE, but whether this affects the coagulation process by increasing vascular permeability (16) requires further investigation. Additionally, studies have indicated a correlation between low serum potassium levels and increased mortality in patients with ICH (34, 35).
In this context, structured acute response protocols such as Code ICH have emerged as essential tools for the timely recognition and management of ICH (see code ICH a call to action) (36). Incorporating laboratory monitoring (including serum electrolyte indicators such as potassium ions) into the Code ICH workflow may increase the precision of acute-phase interventions. This approach focuses on modifiable yet often overlooked factors in the pathophysiological process of ICH, potentially offering further support for improving patient outcomes in the future.
Our study has several limitations. First, our study is a single-center retrospective analysis and may be subject to bias. Second, as a retrospective observational study, key confounding factors that may influence HE—such as the use of acute-phase antihypertensive and intracranial pressure–lowering medications, prior medication history affecting coagulation function, and the CTA spot sign—were not systematically analyzed. Furthermore, serum potassium levels were not examined in further subdivided ranges. Therefore, the association between low serum potassium levels and HE after ICH should be considered a preliminary identification of a potential biomarker. These findings should not be used to guide specific clinical management or correction strategies. Future prospective studies are needed to systematically collect these key data, validate the reliability of these findings, and clarify the value of serum potassium levels more clearly within a multifactorial clinical context.
Conclusion
In summary, our study demonstrates that low serum potassium levels are associated with HE following ICH, offering a new perspective for understanding the pathophysiological processes of ICH.
The reference list from the paper itself. Each links out to its DOI / PubMed record.
- 1GBD 2021 Stroke Risk Factor Collaborators. Global, regional, and national burden of stroke and its risk factors, 1990-2021: a systematic analysis for the global burden of disease study 2021. Lancet Neurol. (2024) 23:973–1003. doi: 10.1016/S 1474-4422(24)00369-739304265 PMC 12254192 · doi ↗ · pubmed ↗
- 2Puy L Parry-Jones AR Sandset EC Dowlatshahi D Ziai W Cordonnier C. Intracerebral haemorrhage. Nat Rev Dis Primers. (2023) 9:14. doi: 10.1038/s 41572-023-00424-736928219 · doi ↗ · pubmed ↗
- 3Brouwers HB Chang Y Falcone GJ Cai X Ayres AM Battey TW . Predicting hematoma expansion after primary intracerebral hemorrhage. JAMA Neurol. (2014) 71:158–64. doi: 10.1001/jamaneurol.2013.543324366060 PMC 4131760 · doi ↗ · pubmed ↗
- 4Davis SM Broderick J Hennerici M Brun NC Diringer MN Mayer SA . Hematoma growth is a determinant of mortality and poor outcome after intracerebral hemorrhage. Neurology. (2006) 66:1175–81. doi: 10.1212/01.wnl.0000208408.98482.9916636233 · doi ↗ · pubmed ↗
- 5Brott T Broderick J Kothari R Barsan W Tomsick T Sauerbeck L . Early hemorrhage growth in patients with intracerebral hemorrhage. Stroke. (1997) 28:1–5. doi: 10.1161/01.STR.28.1.18996478 · doi ↗ · pubmed ↗
- 6Hillal A Ullberg T Ramgren B Wasselius J. Computed tomography in acute intracerebral hemorrhage: neuroimaging predictors of hematoma expansion and outcome. Insights Imaging. (2022) 13:180. doi: 10.1186/s 13244-022-01309-136417131 PMC 9684397 · doi ↗ · pubmed ↗
- 7Pensato U Dowlatshahi D Rodriguez-Luna D Ospel JM Morotti A Tanaka K . Spot sign in intracerebral hemorrhage: critical reappraisal and future clinical implications. Stroke. (2025) 56:1612–24. doi: 10.1161/STROKEAHA.125.05063740197116 PMC 12101894 · doi ↗ · pubmed ↗
- 8Yu Q Liu Y Chang X Mao X Wu X Chu M . High-normal serum potassium, calcium, and magnesium levels are associated with decreased risks of adverse outcomes after ischemic stroke. J Am Heart Assoc. (2025) 14:e 037601. doi: 10.1161/JAHA.124.03760140357677 PMC 12184585 · doi ↗ · pubmed ↗