Assessment of fetal endometrial thickness: a key to the prenatal diagnosis of ovarian cysts
Minh-Huy Huynh, Laura De Leon Benedetti, Leny Mathew, Mohamed K Mohamed, Edward R Oliver, Suzanne E Debari, Juliana S Gebb, Nahla Khalek, Shelly Soni, Desiree Fiorentino, N. Scott Adzick, Beverly G Coleman

TL;DR
This study shows that measuring fetal endometrial thickness can help accurately diagnose ovarian cysts before birth, improving prenatal care.
Contribution
The study identifies fetal endometrial thickness as a novel and reliable imaging marker for prenatal ovarian cyst diagnosis.
Findings
Fetal endometrial thickness was significantly greater in ovarian cysts compared to non-ovarian cysts.
An ultrasound threshold of 1.9 mm for endometrial thickness achieved 100% sensitivity and specificity for diagnosing ovarian cysts.
Cyst volume was not independently associated with ovarian cyst diagnosis after adjusting for gestational age.
Abstract
Fetal abdominopelvic cysts are relatively common, but distinguishing ovarian from non-ovarian cysts prenatally remains challenging because morphologic features overlap, and no imaging marker has been validated. To evaluate fetal endometrial thickness and cyst volume as imaging markers for the prenatal diagnosis of ovarian cysts. We conducted a single-center, retrospective study of female fetuses with abdominopelvic cysts diagnosed on prenatal ultrasound and/or magnetic resonance imaging (MRI) between January 2010 and December 2024. Two blinded pediatric radiologists independently measured endometrial thickness and cyst volume, with discrepancies resolved by consensus. Postnatal confirmation of diagnosis was obtained through imaging, surgical pathology, or clinical follow-up. Statistical analyses included regression models adjusted for gestational age and receiver operating…
Genes, proteins, chemicals, diseases, species, mutations and cell lines named across the full text — each resolved to its canonical identifier and authoritative record.
Click any figure to enlarge with its caption.
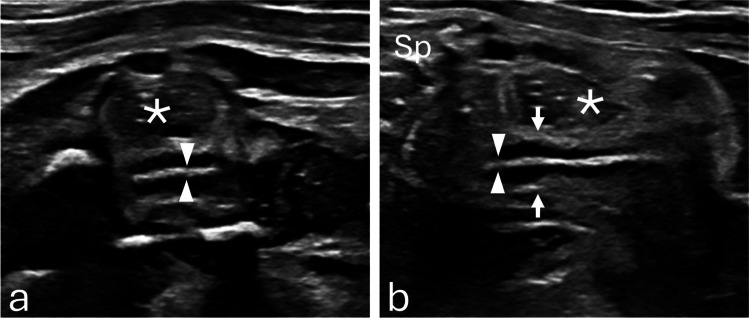 Figure 1
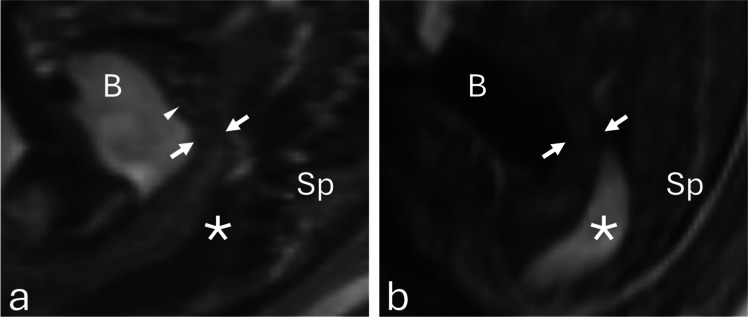 Figure 2
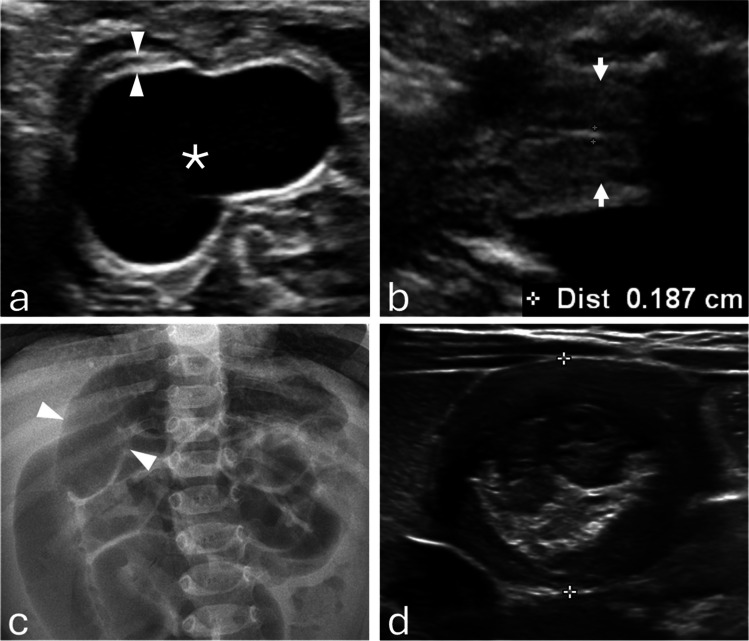 Figure 3
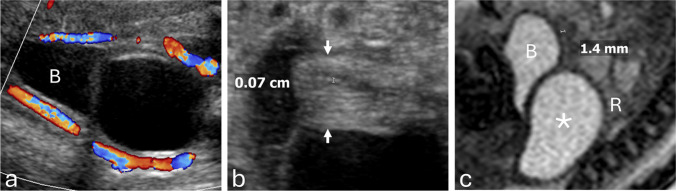 Figure 4
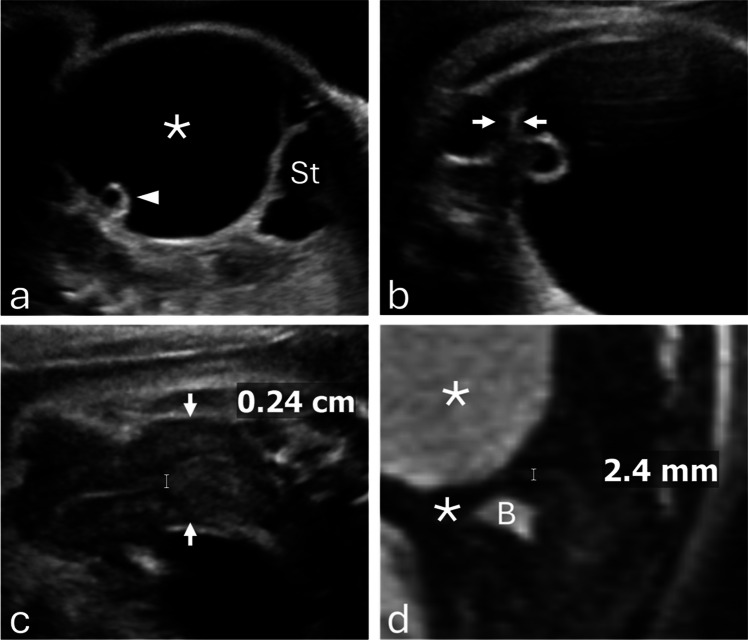 Figure 5
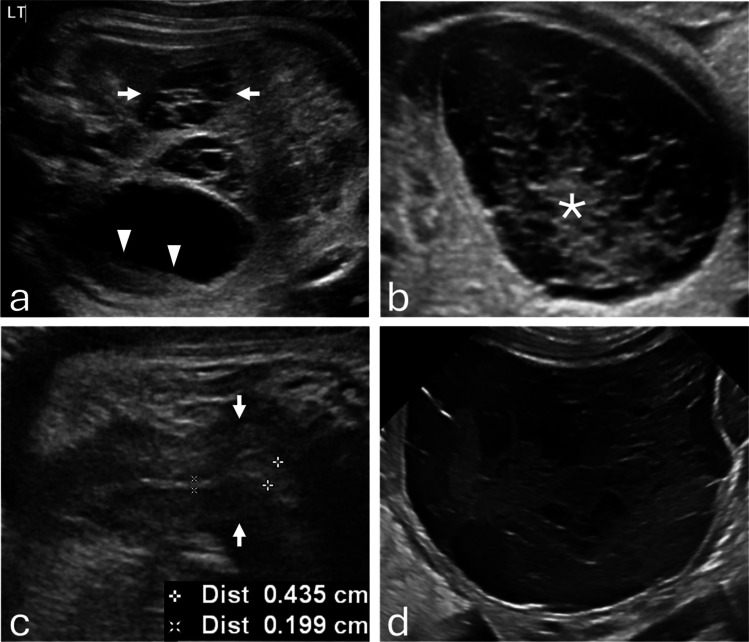 Figure 6
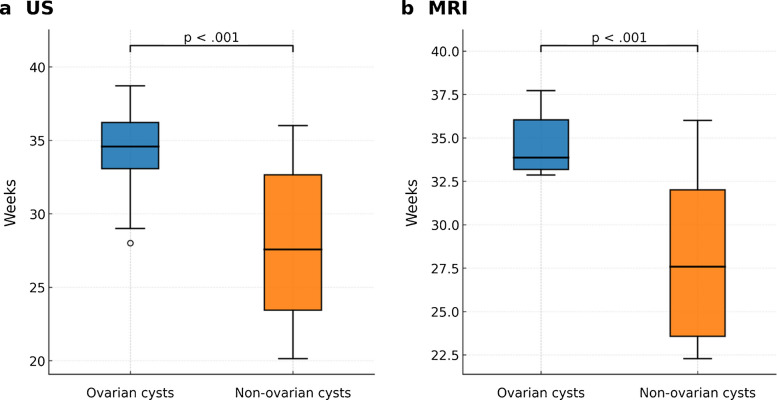 Figure 7
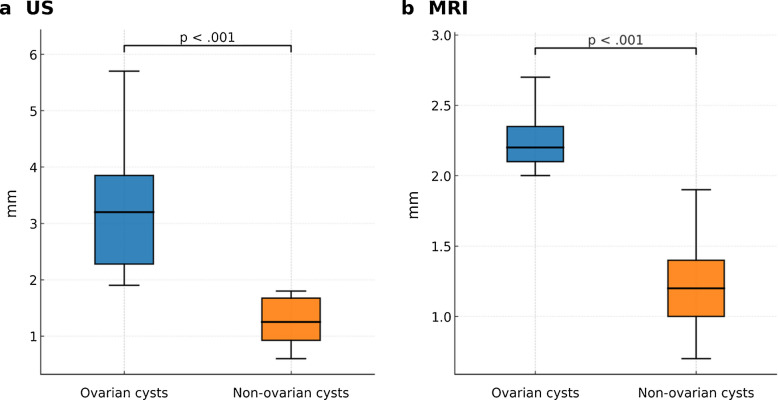 Figure 8
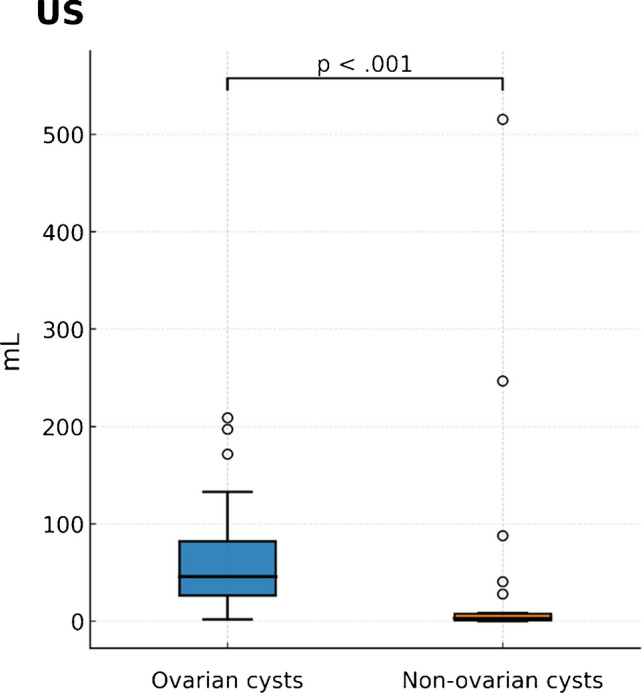 Figure 9
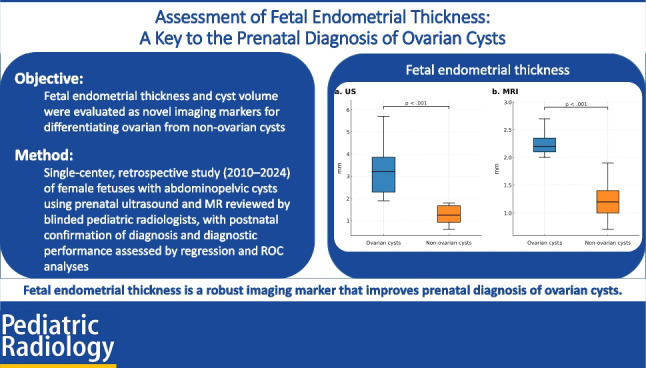 Figure 10
Peer Reviews
No public reviews on file for this paper yet. If you reviewed it on a platform where reviews are public (OpenReview, ICLR, NeurIPS, ICML), you can paste yours below so the community can read it here.
Videos
No videos yet. Explain this paper in a talk, walkthrough, or lecture? Add one.
Taxonomy
TopicsOvarian cancer diagnosis and treatment · Gynecological conditions and treatments · Ectopic Pregnancy Diagnosis and Management
Introduction
Fetal abdominopelvic cysts are relatively common incidental findings on second- and third-trimester ultrasound, with an estimated incidence of approximately 1 in 1,000 pregnancies [1, 2]. These cysts typically appear as round, anechoic lesions and encompass a broad differential diagnosis that includes adnexal, gastrointestinal, renal, lymphatic, and neoplastic etiologies [3–5]. Because imaging features often overlap, accurate lesion localization and confirmation of fetal gender are critical for narrowing the differential diagnosis.
Among these entities, fetal ovarian cysts are the most frequently encountered abdominopelvic cysts in female fetuses, with an estimated prevalence of 1 in 2,500 live female births [3, 6–8]. They usually arise in the third trimester due to maternal and placental estrogen and gonadotropin stimulation of the fetal ovary [3–6]. While many are physiologic and resolve spontaneously, complications such as torsion, hemorrhage, rupture, and ovarian loss are well documented [6, 9–11]. These adverse outcomes may necessitate surgical intervention and can jeopardize future fertility, highlighting the importance of timely and accurate prenatal diagnosis to guide prognosis, monitoring, and perinatal management.
Accurate prenatal identification of ovarian cysts remains challenging, as morphologic features alone may be misinterpreted or indistinguishable from non-ovarian cysts. Although the imaging characteristics of fetal ovarian cysts have been described extensively [4, 5], no physiologic imaging marker has been established to improve specificity. Fetal endometrial thickness represents a promising candidate. In postnatal populations, endometrial thickness is a well-validated, estrogen-responsive marker for assessing hormonal status, pubertal development, and abnormal uterine bleeding [12–14]. Estrogen receptors are present in the fetal endometrium by the late second and third trimesters, and histologic studies confirm its responsiveness to transplacental estrogen exposure [15]. Thus, prenatal endometrial thickening may serve as a noninvasive, physiologic marker of intrauterine estrogen stimulation, reflecting the influence of maternal and placental hormones on ovarian cyst formation and thereby improving diagnostic confidence.
Cyst volume is another underexplored diagnostic parameter. Most studies only report the maximum cyst diameter, which does not fully capture the burden of disease. Volume provides a three-dimensional assessment that may better reflect both hormonal stimulation and mass effect. Larger cysts are more likely to undergo torsion or require surgical intervention [6–9]; however, cyst volume has not been systematically evaluated as a discriminator between ovarian and non-ovarian cysts.
In this study, we propose fetal endometrial thickness and cyst volume as novel sonographic markers to improve the prenatal diagnosis of fetal ovarian cysts. We hypothesized that fetuses with ovarian cysts would demonstrate significantly greater endometrial thickness and cyst volumes compared with non-ovarian cysts, and that incorporating these markers would enhance diagnostic confidence.
Materials and methods
This single-center, retrospective study was approved by the Institutional Review Board (IRB) of our tertiary care children’s hospital. Female fetuses with abdominopelvic cysts detected on prenatal imaging between January 2010 and December 2024 were eligible for inclusion.
Inclusion criteria were as follows: (1) detection of an abdominopelvic cyst on prenatal ultrasound, with magnetic resonance imaging (MRI) included when available; (2) adequate prenatal imaging permitting assessment of the uterus and endometrium by ultrasound and/or MRI when available; and (3) postnatal confirmation of diagnosis through imaging, surgical pathology, or clinical follow-up. Exclusion criteria were as follows: (1) known chromosomal abnormalities, (2) major congenital anomalies, (3) suboptimal imaging quality precluding measurement, and (4) loss to follow-up without postnatal confirmation. Cases meeting inclusion criteria were categorized into two diagnostic groups: ovarian cysts and non-ovarian cysts.
Data collection
Demographic and clinical data were extracted from the electronic medical records. Variables collected included maternal age, maternal ethnicity, gestational age at imaging, cyst type identified on prenatal imaging, postnatal diagnosis and clinical outcomes, and availability of surgical pathology.
Ovarian cysts were further classified as simple or complicated. Complicated cysts were defined by the presence of hemorrhage or imaging features suggestive of ovarian torsion. For non-ovarian cysts, the suspected diagnosis (e.g., enteric duplication, lymphatic malformation) was recorded from the interpreting radiologist’s report. Clinical outcomes were categorized as spontaneous resolution or surgical intervention. In cases requiring surgery, operative and pathology reports were reviewed when available.
Imaging analysis
Fetal endometrial thickness and cyst volume were assessed on prenatal ultrasound and magnetic resonance imaging (MRI).
Endometrial thickness was measured independently by two pediatric radiologists, one with 3 years of dedicated fetal imaging experience and the other with more than 20 years of experience, both blinded to the postnatal diagnosis. When measurements differed, the images were reviewed jointly and a consensus measurement was recorded for analysis, typically aligning with the assessment of the more senior radiologist. No formal interobserver reproducibility assessment was performed.
Ultrasound technique
Ultrasound examinations were performed using curved C9-2 and linear eL18-4 transducers. Optimal visualization of the uterus was achieved when the fetal spine was positioned superiorly, allowing the rectosigmoid colon to be seen posteriorly, the uterus centrally, and the bladder anteriorly. Although sagittal uterine views are not part of our institution’s standard fetal ultrasound protocol, some members of the fetal imaging division began routinely obtaining sagittal views of the fetal uterus in female fetuses with abdominopelvic cysts during the study period. This practice was not uniformly adopted at the outset and became more consistent later as growing interest in endometrial assessment developed.
Endometrial thickness was measured in a midline sagittal view of the uterus, typically obtained near the fundus or upper body. The endometrium was identified by its layered echotexture: a thin echogenic line in the early proliferative phase; a multilayered appearance in the late proliferative phase, consisting of basal echogenic lines and intervening hypoechoic functional layers; and a uniformly echogenic band in the secretory phase. Thickness was measured as the maximum anteroposterior dimension of the echogenic endometrium, placed outer-to-outer from the anterior to the posterior basal echogenic borders, oriented perpendicular to the uterine axis. Adjacent hypoechoic myometrium and intrauterine fluid were excluded (Fig. 1).Fig. 1a Transverse and (b) sagittal grayscale ultrasound images at 29 weeks 4 days show the uterus (arrows) and non-thickened endometrium (arrowheads). The rectum (asterisk) lies posterior to the uterus. The fetal spine (Sp) is oriented anteriorly for image optimization. Thickness was measured as the maximal anteroposterior dimension of the echogenic endometrium, outer-to-outer between the anterior and posterior basal echogenic borders
MRI technique
MRI was performed on a 1.5-T system using T2-weighted HASTE sequences with 3-mm slice thickness. Endometrial thickness was measured in the midsagittal plane, where the endometrium appears as a thin, relatively hyperintense linear zone compared with the surrounding hypointense myometrium. Measurements were made from the outer margin to the outer margin across the anteroposterior dimension of the endometrium (Fig. 2).Fig. 2a Sagittal T2-weighted MR image shows the uterus posterior to the urinary bladder (B), with hypointense myometrium (arrows) and mildly hyperintense endometrium (arrowhead). b Sagittal T1-weighted MR image shows T1-hyperintense meconium within the rectosigmoid colon (asterisk), posterior to the uterus (arrows). Measurements were made from the outer margin to the outer margin across the anteroposterior dimension of the endometrium
Cyst volume was calculated on ultrasound and MR using the standard ellipsoid formula: length×width×height×0.52.
Statistical analysis
Continuous variables were summarized as medians with interquartile ranges (IQR) and categorical variables as counts and percentages. Between-group comparisons were made using Wilcoxon rank-sum or chi-square tests, as appropriate. Linear regression models adjusted for gestational age were used to assess independent associations of cyst type with endometrial thickness and volume. Receiver operating characteristic (ROC) curve analysis was used to determine diagnostic thresholds, sensitivity, specificity, and predictive values. Statistical significance was defined as P<0.05. Analyses were performed using R (version 4.2.0).
Results
The final study population consisted of 63 female fetuses with abdominal or pelvic cysts. All included cases had at least one prenatal imaging modality—ultrasound or MRI—sufficient for endometrial thickness measurement. The median maternal age was 36 years (range, 25–50 years), and most patients were White (61.9%). The median gestational age at the diagnostic ultrasound was 34.0 weeks (range, 20.5–40.3 weeks). Endometrial thickness could not be assessed on ultrasound in 17 fetuses (27.0%) because sagittal uterine views were unavailable or the endometrium could not be adequately measured, as this imaging view was not part of the standard protocol during the study period. Missing ultrasound measurements occurred in nine non-ovarian cyst cases (39.1%) and eight ovarian cyst cases (20.0%). MRI endometrial thickness measurements were missing in 44 fetuses (69.8%); these included 11 non-ovarian cyst cases (47.8%) and 33 ovarian cyst cases (82.5%) (Table 1). Table 1. Patient demographics (N=63)CharacteristicValueMaternal age, yearsMedian 36 (25–50)Maternal ethnicityWhite: 39 (61.9%)Black: 9 (14.3%)Asian: 7 (11.1%)Other: 8 (12.7%)Gestational age at ultrasound, weeksMedian 34.0 (20.5–40.3)Gestational age at MRI, weeksMedian 32.8 (22.6–37.6)
Of 63 cases, 40 (63.5%) were ovarian cysts (25 hemorrhagic, 15 simple) and 23 (36.5%) were non-ovarian cysts, most often enteric duplication (12 of 23 [52.2%]) (Fig. 3). Ovarian torsion occurred in 20 of 40 ovarian cysts (50.0%), including 17 of 25 hemorrhagic cysts (68.0%) and 3 of 15 simple cysts (20.0%). Torsion was significantly more frequent in hemorrhagic than in simple cysts (OR, 0.12 [95% CI, 0.02–0.61]; P=0.008) (Fig. 6). Torsion was confirmed intraoperatively and corroborated by pathology (Table 2). Fig. 3a Prenatal grayscale ultrasound at 34 weeks 3 days demonstrates a pathology-proven enteric duplication cyst (asterisk) with the classic gut signature, consisting of an echogenic inner mucosal layer and a hypoechoic outer muscular layer (arrowheads). b Sagittal grayscale ultrasound shows the fetal uterus (arrows) with an endometrium measuring < 2 mm. c At 4 months of age, frontal abdominal radiograph demonstrates small-bowel obstruction (arrowheads). d Grayscale ultrasound demonstrates an ileocolic intussusception caused by the enteric duplication cyst. The infant underwent surgical resectionTable 2Clinical characteristics (N=63)CharacteristicValueP-value/ORDiagnosisOvarian cysts (40/63, 63.5%)– Simple: 15 (37.5%)– Hemorrhagic: 25 (62.5%)Non-ovarian cysts (23/63, 36.5%)– Enteric duplication: 12 (52.2%)– Lymphatic malformation: 1 (4.3%)– Choledochal: 2 (8.7%)– Meconium pseudocyst: 3 (13.0%)– Hepatic: 2 (8.7%)– Renal: 1 (4.3%)– Teratoma: 1 (4.3%)– Hematocolpos: 1 (4.3%)–Ovarian torsion^a^Yes: 20 (50.0%)No: 20 (50.0%)Hemorrhagic vs. simple: OR=0.12, P=0.008Clinical outcomesOvarian cysts: 11 resolved spontaneously (27.5%), 22 required surgery (55.0%)non-ovarian cysts: 5 resolved spontaneously (21.7%), 18 required surgery (78.3%)Ovarian vs. non-ovarian surgery: OR=0.34, P=0.10Pathology availableYes: 37 (58.7%)No: 26 (41.3%)–Data shown as n (%) unless otherwise indicated.^a^*Among ovarian cyst cases only.^b^Percentages for ovarian and non-ovarian subtypes are calculated from within-group totals; overallpercentages for ovarian vs. non-ovarian cysts are based on the total cohort (N = 63).
Spontaneous resolution, defined as absence of cyst visualization on the latest follow-up imaging, occurred in 11 ovarian cysts (27.5%) and five non-ovarian cysts (21.7%). Surgery was required in 18 non-ovarian cysts (78.3%) (Figs. 3, 4) and 22 ovarian cysts (55.0%) (Figs. 5, 6); the difference between groups was not statistically significant (OR, 0.34 [95% CI, 0.10–1.14]; P=0.10). Pathology reports were available for 37 of 63 cases (58.7%), including all surgically resected ovarian cysts. Among non-ovarian cysts, pathology was obtained in nearly all surgical cases; however, in one case, no specimen was obtained, and the diagnosis was confirmed intraoperatively.Fig. 4a Prenatal grayscale ultrasound with color Doppler at 33 weeks shows imperforate hymen with hydrocolpos. The fluid-distended vagina (asterisk) appears cystic, posterior and slightly inferior to the bladder (B) and anterior to the rectosigmoid colon (R). b Sagittal grayscale ultrasound shows the uterus (arrows) with a non-thickened endometrium measuring < 2 mm. c Sagittal T2-weighted MR image confirms hydrocolpos (asterisk) and a non-thickened endometrium. The infant underwent postnatal hymenectomyFig. 5a Prenatal sagittal grayscale ultrasound at 36 weeks 5 days demonstrates a large unilocular ovarian cyst (asterisk) extending from the left pelvis to the upper abdomen adjacent to the stomach, containing a “daughter cyst” (arrowhead), characteristic of ovarian cyst. b A close-up image demonstrates peripheral displacement of the ovarian stroma (arrows).** c** Sagittal grayscale ultrasound shows the fetal uterus (arrows) with a thickened endometrium measuring > 2 mm. d Sagittal T2-weighted MR image confirms a thickened endometrium. The infant underwent exploratory laparotomy with cyst drainage, which confirmed a simple ovarian cystFig. 6a Prenatal grayscale ultrasound at 30 weeks demonstrates a hormonally stimulated right ovary containing a hemorrhagic cyst with a fluid–debris level (arrowheads) and preserved stroma with follicles. The left ovary is also hormonally stimulated with multiple follicles (arrows). b At 36 weeks, the cyst evolved to a reticular pattern with echogenic, non-shadowing retractile clot (asterisk). c Sagittal grayscale ultrasound shows the fetal uterus (arrows) with a thickened endometrium at the fundus measuring > 2 mm. d Postnatal grayscale ultrasound at day 4 demonstrates a persistent hemorrhagic ovarian cyst measuring 74 mL in volume. The infant underwent surgery, which confirmed a necrotic ovarian cyst with hemorrhage and calcifications due to prenatal torsion
Gestational age and imaging timing
Fetuses with ovarian cysts underwent ultrasound at significantly later gestational ages than those with non-ovarian cysts (median 35.0 weeks [IQR, 33.8–36.1] vs. 27.9 weeks [IQR, 23.8–33.1]; P<0.001). MRI was performed in 19 cases (30.2%) at a median of 34.4 weeks (IQR, 34.0–34.8) for the ovarian cyst group and 27.9 weeks (IQR, 23.9–32.8) for the non-ovarian cyst group (P<0.001) (Fig. 7).Fig. 7. Gestational age and imaging timing. a Ultrasound examinations were performed at later gestational ages in fetuses with ovarian cysts compared with those with non-ovarian cysts (median 35.0 weeks [IQR 33.8–36.1] vs. 27.9 weeks [IQR 23.8–33.1]; P < 0.001). b Among the 19 fetuses who also underwent MRI (30.2%), gestational age at the time of imaging was higher in the ovarian cyst group (median 34.4 weeks [IQR 34.0–34.8]) than in the non-ovarian group (median 27.9 weeks [IQR 23.9–32.8]; P < 0.001)
(Table 3). Table 3. Imaging parameters by diagnosisVariableNon-ovarian cyst (n=23)Ovarian cyst (n=40)Overall (N=63)P-valueGestational age at US, weeks27.9 (23.8–33.1)35.0 (33.8–36.1)34.0 (31.0–35.4) <0.001Gestational age at MRI, weeks27.9 (23.9–32.8)34.4 (34.0–34.8)32.8 (26.4–34.4) <0.001Cyst volume, mL (US)2.8 (0.8–7.4)45.4 (25.7–79.4)28.0 (4.1–63.9) <0.001Endometrial thickness, mm (US)1.3 (0.9–1.7)3.2 (2.3–3.9)2.35 (1.7–3.6) <0.001Endometrial thickness, mm (MRI)1.2 (1.0–1.4)2.2 (2.1–2.4)1.4 (1.2–2.1) <0.001Values are median (IQR). Missing data: gestational age at MRI 44 (69.8%), endometrial thickness by ultrasound 17 (27.0%), endometrial thickness by MRI 44 (69.8%). US, ultrasound.
Endometrial thickness
Endometrial thickness on ultrasound was measurable in 46 of 63 cases (73.0%). On ultrasound, fetuses with ovarian cysts had significantly greater endometrial thickness compared with non-ovarian cysts (median, 3.2 mm [IQR, 2.3–3.9] vs. 1.3 mm [IQR, 0.9–1.7]; P<0.001).
Among the 19 cases with MRI, endometrial thickness was also greater in ovarian cysts (median 2.2 mm [IQR, 2.1–2.4]) than in non-ovarian cysts (1.2 mm [IQR, 1.0–1.4]; P<0.001) (Fig. 8).Fig. 8. Endometrial thickness. a On ultrasound, fetuses with ovarian cysts demonstrated greater endometrial thickness compared with fetuses with non-ovarian cysts (median 3.2 mm [IQR 2.28–3.85] vs. 1.25 mm [IQR 0.93–1.68]; P < 0.001). This difference remained significant after adjusting for gestational age (coefficient 1.56; 95% CI 0.84–2.26; P < 0.001).** b** In the subset of 19 fetuses evaluated with MRI, endometrial thickness was again greater in the ovarian cyst group (median 2.2 mm [IQR 2.1–2.35]) compared with the non-ovarian group (median 1.2 mm [IQR 1.0–1.4]; P < 0.001), with significance persisting after adjustment for gestational age (coefficient 0.81; 95% CI 0.41–1.21; P < 0.001)
Cyst volume
Cyst volumes were significantly larger in ovarian cysts (median 45.4 mL [IQR, 25.7–79.4]) compared with non-ovarian cysts (2.8 mL [IQR, 0.8–7.4]; P<0.001). However, after adjusting for gestational age, cyst volume was not independently associated with ovarian cyst diagnosis (coefficient, −24.05 [95% CI, −76.45 to 28.36]; P=0.36) (Fig. 9) (Table 4). Table 4. Diagnostic performance of imaging markers for ovarian cyst diagnosisParameterModalityThresholdSensitivity, %Specificity, %PPV, %NPV, %AUC (95% CI)Endometrial thicknessUltrasound1.9 mm1001001001001.00 (1.00–1.00)Endometrial thicknessMRI1.8 mm^a^10091.787.51000.99 (0.96–1.00)Cyst volumeUltrasound11.9 mL90.078.387.781.60.82 (0.71–0.93)PPV, positive predictive value; NPV, negative predictive value; AUC, area under the ROC curve; CI, confidence interval.^a^Threshold by Youden indexFig. 9Cyst volume on ultrasound. Median cyst volume was substantially larger in ovarian cysts than in non-ovarian cysts (45.4 mL [IQR 25.7–79.4] vs. 2.8 mL [IQR 0.76–7.41]; P<0.001). After accounting for gestational age, cyst volume was not independently predictive of ovarian cyst diagnosis (coefficient −24.05; 95% CI −76.45 to 28.36; P=0.36)
Multivariable linear regression models were used to evaluate whether endometrial thickness remained independently associated with ovarian cyst diagnosis after adjusting for gestational age. On ultrasound, ovarian cyst diagnosis was independently associated with greater endometrial thickness (coefficient, 1.56 [95% CI, 0.84–2.26]; P<0.001). Gestational age was also positively associated with endometrial thickness (coefficient, 0.08 mm per week [95% CI, 0.04–0.12]; P<0.001).
On MRI, ovarian cysts similarly showed increased endometrial thickness (coefficient, 0.81 [95% CI, 0.41–1.21]; P<0.001), and gestational age again demonstrated a smaller positive association (coefficient, 0.06 mm per week [95% CI, 0.02–0.10]; P=0.003). These findings confirm that endometrial thickening is independently associated with ovarian cysts across imaging modalities (Table 5).
Table 5. Multivariable linear regression analysis for endometrial thicknessVariableUltrasound modelMRI modelOvarian cyst diagnosis (yes vs. no)1.56 (0.84–2.26), P<0.0010.81 (0.41–1.21), P<0.001Gestational age (per week)0.08 (0.04–0.12), P<0.0010.06 (0.02–0.10), P=0.003Models adjusted for gestational age. Ultrasound model: n = 46; MRI model: n = 19. CI, confidence interval; MRI, magnetic resonance imaging
Diagnostic performance
Receiver operating characteristic (ROC) curve analysis demonstrated excellent performance for endometrial thickness. An ultrasound threshold of 1.9 mm classified all cases correctly, with sensitivity and specificity of 100% and an area under the curve (AUC) of 1.00 (95% CI, 1.00–1.00). The corresponding positive and negative predictive values were also 100%.
In contrast, cyst volume showed only moderate discriminatory ability. A threshold of 11.9 mL yielded a sensitivity of 90% and specificity of 78%, with an AUC of 0.82 (95% CI, 0.71–0.93). At this threshold, the positive predictive value was 87.7% and the negative predictive value was 81.6%.
Discussion
This study identifies fetal endometrial thickness as a novel and reliable marker for the prenatal diagnosis of ovarian cysts. We found that endometrial thickness, measured on both ultrasound and MRI, was significantly greater in fetuses with ovarian cysts compared with those with non-ovarian cysts, and that this association persisted after adjusting for gestational age. Importantly, endometrial thickness achieved perfect diagnostic accuracy in our cohort, outperforming cyst volume and traditional morphologic assessment.
The accurate prenatal diagnosis of ovarian cysts remains challenging because morphologic features frequently overlap with those of non-ovarian lesions, particularly when cysts are complicated or hemorrhagic. In such cases, reliance on morphologic descriptors alone may lead to diagnostic uncertainty. Our findings demonstrate that incorporating endometrial thickness into prenatal imaging protocols provides an objective and quantifiable marker that enhances diagnostic confidence. Early and accurate recognition of ovarian cysts has important clinical implications, as nearly one-third of cases in our study were complicated by torsion, which can result in ovarian loss and compromise future fertility.
The biological plausibility of endometrial thickness as a diagnostic marker is supported by established developmental physiology. Estrogen receptors are expressed in the fetal endometrium by the late second and third trimesters, and histologic studies confirm responsiveness to transplacental maternal and placental estrogen. A thickened endometrium may therefore serve as a visible indicator of ovarian cysts stimulated by transplacental hormonal exposure. To our knowledge, this is the first study to systematically evaluate endometrial thickness as a diagnostic discriminator, and the accuracy achieved (area under the curve=1.00) represents an important advance over existing approaches that rely solely on morphologic assessment.
Although cyst volume was significantly greater in fetuses with ovarian cysts, this association was no longer significant after adjusting for gestational age. This suggests that gestational age and variability in cyst development may explain much of the observed difference between groups. The moderate diagnostic accuracy of volume measurements (AUC=0.82) supports its use as a complementary rather than primary diagnostic marker. Clinically, larger cysts remain important to monitor given their higher risk of torsion and need for intervention, but cyst volume alone is not sufficient to reliably distinguish ovarian from non-ovarian lesions.
Strengths of this study include the use of both ultrasound and MRI for prenatal assessment, blinded independent review by radiologists with varying levels of experience, and postnatal confirmation of diagnosis through imaging or pathology when available. Together, these factors enhance the robustness and reproducibility of our findings. Limitations include the retrospective single-center design, relatively modest number of MRI cases, lack of formal interobserver reproducibility assessment, and incomplete availability of surgical pathology given that many cysts resolved spontaneously. Future studies should aim to validate these findings prospectively across multiple centers, evaluate reproducibility, and develop standardized protocols for measurement. Longitudinal studies examining the evolution of endometrial thickness across gestations and its correlation with maternal hormone levels may also provide further insights into the underlying physiologic mechanisms.
Conclusion
Fetal endometrial thickness is a robust imaging marker for the prenatal diagnosis of ovarian cysts. Incorporating this parameter into routine prenatal ultrasound protocols can substantially improve diagnostic accuracy, complement morphologic assessment and cyst volume, and ultimately enhance prenatal counseling and perinatal management.
The reference list from the paper itself. Each links out to its DOI / PubMed record.
- 1Mobeen S, Apostol R (2025) Ovarian cyst. In: Stat Pearls. Stat Pearls Publishing, Treasure Island, FL. https://www.ncbi.nlm.nih.gov/books/NBK 560541. Accessed 27 Sept 2025