Imaging for molecular and pathological subtyping of hepatocellular carcinoma—a critical appraisal and future directions
Xinyuan Jia, Hanyu Jiang, Zheng Ye, Hong Wei, Jie Chen, Yali Qu, Claude B. Sirlin, Bin Song, Yanshu Wang

TL;DR
This paper reviews how imaging techniques like CT and MRI can help identify different types of liver cancer and guide personalized treatment.
Contribution
The paper proposes integrating imaging, clinical, and molecular data to improve HCC subtype classification and treatment decisions.
Findings
Imaging features correlate with HCC molecular and pathological subtypes but lack one-to-one reliability.
Combining imaging with clinical and molecular data may enhance prognostication and treatment strategies.
Non-invasive imaging could reduce reliance on invasive histopathological analysis for HCC subtyping.
Abstract
Hepatocellular carcinoma (HCC) is characterized by distinct molecular and pathological subtypes, each with unique prognostic implications. This review aims to synthesize the imaging features associated with these HCC subtypes and discuss their potential to guide therapeutic decision-making. We searched PubMed and Embase for articles published from September 2004 to December 2024. The search strategy combined terms for imaging modalities (“CT,” “MRI”), the primary disease (“hepatocellular carcinoma”), and various molecular and pathological subtypes (e.g., “macrotrabecular-massive,” “steatohepatitic,” “CK19,” and “CTNNB1”). HCC is a biologically heterogeneous malignancy with varied prognosis and sensitivity to treatment. Assessment of its molecular and pathological subtypes relies on invasive histopathological examination, which is subject to sampling errors and often unavailable prior…
Genes, proteins, chemicals, diseases, species, mutations and cell lines named across the full text — each resolved to its canonical identifier and authoritative record.
Click any figure to enlarge with its caption.
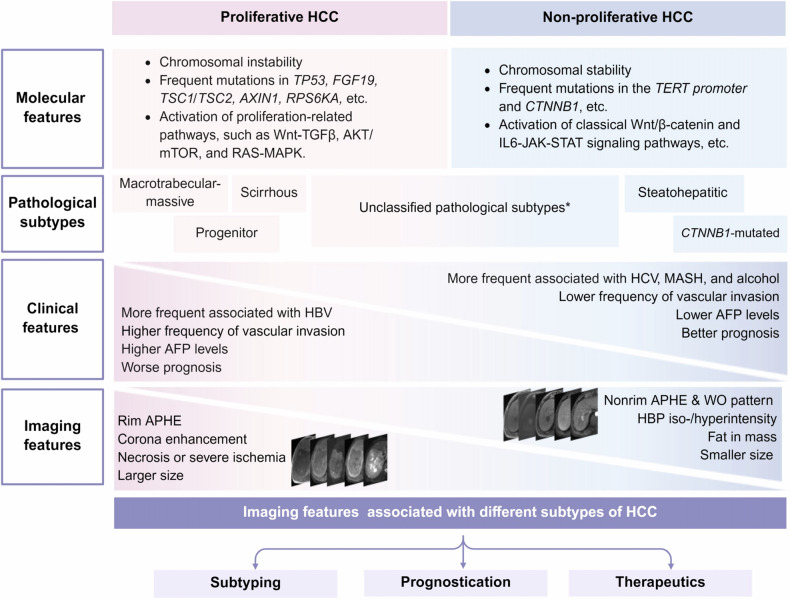 Figure 1
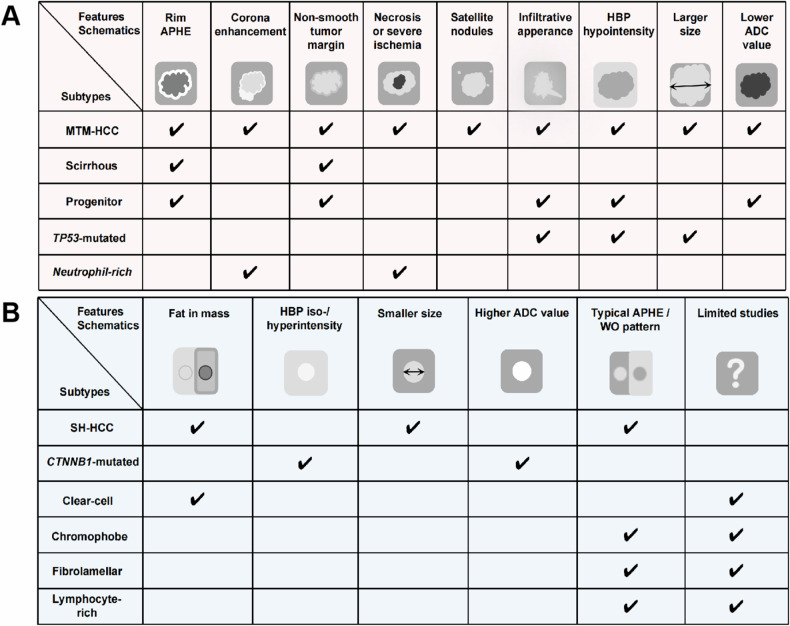 Figure 2
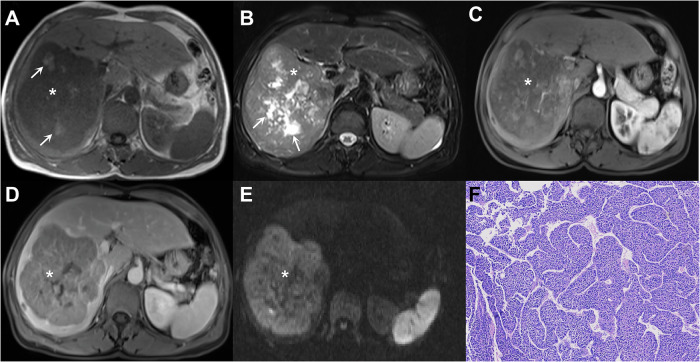 Figure 3
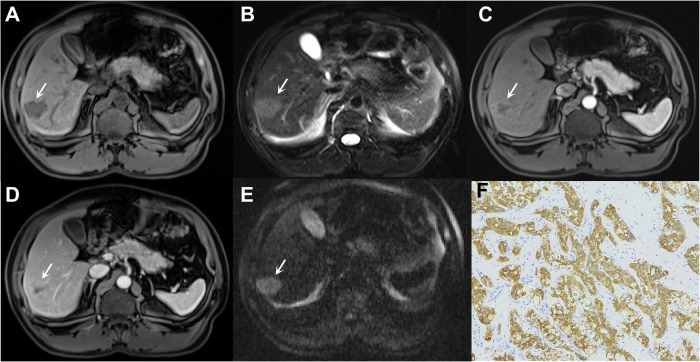 Figure 4
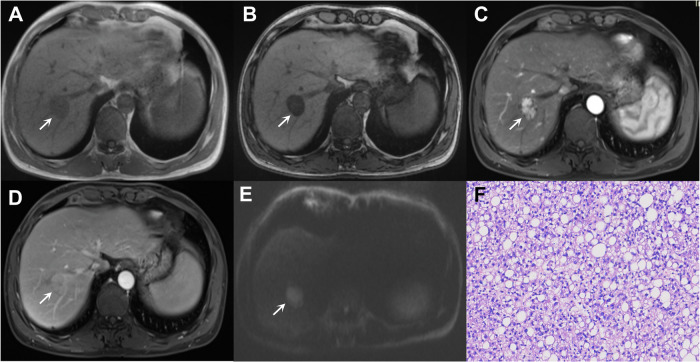 Figure 5
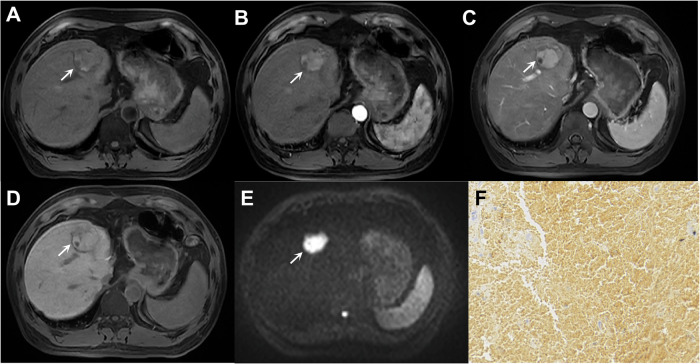 Figure 6
- —Sichuan Science and Technology Program
- —http://dx.doi.org/10.13039/501100001809National Natural Science Foundation of China
- —http://dx.doi.org/10.13039/501100018542Natural Science Foundation of Sichuan Province
- —Science and Technology Department of Hainan Province
- —Development Project of Hainan Provincial Clinical Medical Center and Postdoctoral Station Development Project of Sanya
- —Postdoctoral Research Fund of West China Hospital, Sichuan University
Peer Reviews
No public reviews on file for this paper yet. If you reviewed it on a platform where reviews are public (OpenReview, ICLR, NeurIPS, ICML), you can paste yours below so the community can read it here.
Videos
No videos yet. Explain this paper in a talk, walkthrough, or lecture? Add one.
Taxonomy
TopicsHepatocellular Carcinoma Treatment and Prognosis · Liver Disease Diagnosis and Treatment · Cancer Mechanisms and Therapy
Introduction
Hepatocellular carcinoma (HCC) is a biologically heterogeneous malignancy [1, 2]. Such heterogeneity complicates management by influencing the risks of recurrence, metastasis, and therapeutic response [3, 4]. Several classifications have been proposed to stratify HCC into distinct subtypes with varied molecular and pathological characteristics and prognoses. However, assessment of HCC subtypes, whether molecular or pathological, requires invasive tissue sampling, which is often unavailable at the time of therapeutic decision-making and subject to sampling errors. Accumulating evidence suggests that key molecular and pathological characteristics may be inferred from multiphase computed tomography (CT) and multiparametric magnetic resonance imaging (MRI) (e.g., qualitative, quantitative, and radiomic features) [5–8]. Thus, understanding the correlations between imaging features, molecular characteristics, and pathological subtypes may improve noninvasive outcome prognostication and treatment responsiveness prediction, thereby informing individualized HCC management.
This review summarizes the imaging features associated with molecular and pathological subtypes of HCC, with attention given to the current understanding of these subtypes’ pathological and molecular bases and relevance to clinical practice.
Molecular and pathological HCC classifications
Molecular classification
Molecular heterogeneity drives biological heterogeneity. According to gene expression profiles, major molecular drivers and altered signaling pathways, HCCs could be broadly divided into the proliferative and non-proliferative classes, each with various subclasses [9–14]. Generally, the proliferative class is characterized by active cell cycle progression, uncontrolled cell division, proliferative signaling pathways, and genomic chaos with chromosomal instability and aberrant epigenetic alterations. Notably, proliferative tumors may exhibit some but not all of these abnormalities; the key concept is that the global molecular profile is one of proliferation. The non-proliferative class is characterized by retained hepatocyte-like features with altered cellular metabolism or activation of inflammatory pathways but without uncontrolled proliferation. Given tumor heterogeneity, HCCs may harbor both proliferative and non-proliferative components at the lesion or patient levels, but this has not yet been investigated.
The proliferative class accounts for approximately 50% of HCC, with the non-proliferative class comprising the remaining portion [2, 9]. Proliferative class is more frequently observed in patients with chronic hepatic B virus (HBV) infection and has been associated with a more aggressive phenotype (e.g., poorer differentiation and greater propensity for vascular invasion, satellite nodules, and metastasis), higher serum alpha-fetoprotein (AFP) and des-gamma-carboxy prothrombin (DCP) levels, and poorer clinical outcomes, even after adjusting for tumor size and stage [15, 16]. Proliferative HCCs demonstrate enrichment of proliferation-related signaling pathways, such as PI3K-AKT-mTOR, RAS-MAPK, and MET cascades, as well as high chromosomal instability, global DNA hypomethylation, and frequent TP53 inactivation with FGF19 or CCND1 amplification. Further subclassification of the proliferative class reveals (1) a “Wnt-TGFβ subclass”, characterized by activation of both TGFβ and Wnt pathways [17] and (2) a “progenitor subclass” with expression of epithelial cell adhesion molecule (EpCAM) or cytokeratin 19 (CK19), and upregulation of Myc and Akt protein kinase [16, 18].
Conversely, the non-proliferative class predominates in alcohol-related steatotic liver disease (ALD), metabolic dysfunction-associated steatohepatitis (MASH), and hepatitis C virus (HCV)-related HCCs, and has been associated with a less aggressive phenotype, lower AFP levels, and better clinical outcomes. Molecularly, these tumors are characterized by higher chromosomal stability, extensive promoter hypermethylation, and more frequent mutations in CTNNB1 and TERT promoters, resulting in altered metabolic regulation and cancer growth with relatively low proliferative activity [10, 19]. Why ALD, MASH, and chronic HCV predispose to non-proliferative HCC is not yet understood, but vascular, metabolic, immune, and inflammatory factors may play a role. Importantly, the clinical associations mentioned above (e.g., of proliferative HCC with chronic HBV, higher AFP and DCP; of non-proliferative HCC with other etiologies of liver disease and lower AFP) are not strong enough to enable noninvasive classification of tumors based on this information alone.
Emerging evidence suggests that molecular alterations in HCC may have prognostic and therapeutic implications. For instance, CTNNB1 mutations have been reported to drive tumor immune exclusion, and patients with CTNNB1 mutations are often considered to be resistant to immunotherapy [20]. However, considering the complexity and cost of genetic analyses, pathological classification (detailed below) may serve as a practical surrogate.
Pathological subtypes
In parallel to molecular heterogeneity, HCC also exhibits substantial morphological heterogeneity at the pathological level. The 2019 WHO classification (5th edition) classifies up to 65% of HCCs as conventional HCCs (also known as “not otherwise specified” subtype), lacking distinctive morphological characteristics [21]. The remaining 35% are classified into one of the following eight subtypes: macrotrabecular-massive (MTM), steatohepatitic (SH), clear-cell, scirrhous, chromophobe, fibrolamellar, neutrophil-rich, and lymphocyte-rich HCC [22]. Below are the pathological characteristics of common histological subtypes; those with an incidence < 5% are detailed in Supplementary Material 1.
The pinpoint relationship between molecular and pathological classifications remains inadequately established. However, the phenotype of HCC is unlikely to be random, but rather reflects genomic traits. Specifically, the MTM and progenitor subtypes are generally classified within the proliferative class [9], whereas the steatohepatitic and CTNNB1-mutated subtypes are typically classified within the non-proliferative class (Fig. 1) [11]. To date, molecular investigations for neutrophil-rich HCCs, clear-cell HCCs, and lymphocyte-rich HCCs remain limited. Some studies have classified neutrophil-rich HCCs as proliferative and clear-cell and lymphocyte-rich HCCs as non-proliferative based on their behavioral patterns and prognosis, although this classification remains controversial [23, 24].Fig. 1. An illustration highlighting the predictive value of imaging features in identifying the integrated molecular and pathological classification of HCC. *Unclassified subtypes include pathological variants with uncertain molecular classification according to current evidence, such as not otherwise specified (NOS), neutrophil-rich, clear cell, chromophobe, fibrolamellar, and lymphocyte-rich HCCs, etc. HCC, hepatocellular carcinoma; TP53, tumor protein p53; FGF19, fibroblast growth factor 19; TSC, tuberous sclerosis; TERT, telomerase reverse transcriptase; MTM, macrotrabecular-massive; AFP, alpha-fetoprotein; HBV, hepatitis B virus; HCV, hepatitis C virus; MASH, metabolic dysfunction-associated steatohepatitis; APHE, arterial phase hyperenhancement; WO, “Washout” or washout appearance
Proliferative class
(1) MTM-HCC
MTM-HCC has been observed in approximately 5% of HCC and characterized by a prominent macrotrabecular growth pattern (HCC cords > 6 cells in thickness) in ≥ 50% of the tumor [9, 16]. Molecularly, MTM-HCC is characterized by frequent TP53 mutation and FGF19 amplification, and is generally regarded within the proliferative class. Pathologically, this subtype has been associated with larger size and aggressiveness, including higher tumor grade and more frequent intratumoral necrosis, microvascular invasion (MVI), vessels encapsulating tumor clusters, and satellite nodules [15, 25]. Clinically, MTM-HCC has been linked to poorer prognosis with increased metastatic spread and macrovascular invasion, even after adjusting for initial size, grade, and stage [15, 16]. Recent studies have proposed that patients with MTM-HCC may benefit from a combination of anti-CMTM6 and anti-programmed death-ligand 1 (anti-PD-L1) therapy, given the role of CMTM6 in stabilizing PD-L1 expression and enhancing immune evasion by preventing its degradation [26, 27].
(2) Progenitor HCC
The reported proportion of progenitor subtype ranges from 10% to 35% of HCC and is characterized by > 5% hepatic progenitor cell expression (e.g., CK19 or EpCAM) on immunohistochemistry [28, 29]. Compared to non-progenitor HCCs, these tumors are characterized by larger size, infiltrative growth with reduced capsule formation (potentially due to enhanced cytoskeletal dynamics and cellular motility), and frequent vascular invasion. Molecularly, they are characterized by expression of epithelial-mesenchymal transition-related proteins [28]. The aggressive biological behavior results in poorer prognosis, higher metastatic potential, and worse disease-free survival after curative-intent surgery, even after adjusting for size and stage [28–31]. Furthermore, they are more resistant to sorafenib and transarterial chemoembolization (TACE), while novel therapies targeting SALL4, a key mediator of HCC stemness, may offer therapeutic benefits [30, 32].
Non-proliferative class
(1) Steatohepatitic hepatocellular carcinoma (SH-HCC)
SH-HCC represents 5–20% of HCC and is defined by ≥ 5% tumor steatohepatitis (i.e., steatosis, ballooning, inflammation, and pericellular fibrosis) [33]. The key molecular features include IL-6/JAK/STAT activation and less frequent CTNNB1, TERT, and TP53 mutations. Pathologically, these tumors exhibit a less aggressive phenotype with infrequent MVI and metastases. Clinically, SH-HCC has been more frequently observed in patients with ALD or MASH and may exhibit increased resistance to immunotherapies due to an immune-suppressive tumor microenvironment driven by exhausted CD8^+^ PD1^+^T cells [34, 35].
(2) ***CTNNB1-***mutated HCC
The CTNNB1-mutated HCC is generally well-differentiated, characterized by trabecular and pseudo-glandular architectural patterns, intratumoral cholestasis, and lack of immune infiltrates. *CTNNB1-*mutated HCC accounts for 30–40% of cases and is characterized by canonical WNT/β-catenin signaling activation. Given the limited sensitivity of β-catenin detection, studies also utilize positive expression (> 5%) of β-catenin or glutamine synthetase (GS, a downstream protein regulated by β-catenin) as the diagnostic criteria for *CTNNB1-*mutated HCC [7, 36]. Pathologically, *CTNNB1-*mutated HCC is frequently associated with large tumor size (> 5 cm), well-differentiated histology, cholestasis, and microtrabecular/pseudoglandular patterns [9]. Studies have reported an increased resistance to immune checkpoint inhibitors (ICIs) due to decreased T-cell infiltration within the tumor. Notably, promising studies have shown that targeting the Wnt/β-catenin pathway with PORCN inhibitors (i.e., ETC-159) or the mTOR inhibitors (i.e., Rapamycin), may have therapeutic benefits for this subtype. Despite its immune-cold phenotype, CTNNB1-mutated HCC may be associated with more favorable clinical outcomes compared to conventional HCC [20, 24, 37].
Imaging features of HCC molecular and pathological subtypes
Radiologist-defined “semantic” features and computer-derived “radiomic” features on CT and MRI enable noninvasive profiling of HCC molecular and pathological subtypes (Fig. 2) [38–40]. Although radiotracers were also reported to be useful, this review focuses on CT and MRI features (Tables 1 and 2).Fig. 2. Schematic representation of common radiologic features and their correlations with molecular and pathological subtypes of HCC. A Radiologic features of the Proliferative class. B Radiologic features of the Non-Proliferative class. HCC, hepatocellular carcinoma; APHE, arterial phase hyperenhancement; HBP, hepatobiliary phase; ADC, apparent diffusion coefficient; MTM, macrotrabecular-massive; CK-19, cytokeratin-19; TP53, tumor protein p53; WO, WO “Washout” or washout appearance.Table 1. Imaging features associated with proliferative HCC and their predictive or diagnostic performanceSubtypesImaging featuresMRI imagesDefinitionsFrequenciesORs/diagnostic metrics (sensitivities, specificities, AUCs)^†^Proliferative classQualitativeRim APHESpatially defined subtype of arterial phase hyperenhancement in which arterial phase enhancement is most pronounced in the tumor periphery [23, 38, 70].42.2–61.9%OR = 2.79–12.3Sensitivity = 61.9%Specificity = 88.8%Mosaic architecturePresence of any combination of internal nodules, compartments, or septations, within a solid or mostly solid mass [38].28%OR = 3.3Satellite lesionPresence of distinct, unequivocal HCC(s) that are smaller than 1 cm and within 2 cm of the main tumor [38].8.70%OR = 3.2Lobulated shapeA tumor with a lobulated appearance [38].30.80%OR = 2.1Corona enhancementPeritumoral enhancement in the late arterial phase or early portal venous phase. The enhancement is contiguous with and surrounds all or part of the tumor [70].31.0–57.4%OR = 3.37Infiltrative appearanceA non-circumscribed tumor margin (indistinct transition) covering > 50% of the tumor circumference may indicate permeative growth [70].18.0-34.4%OR = 7.82Intratumoral arteryPresence of discrete arteries within the tumor on AP [70].31.0–55.7%OR = 4.71Substantial hypoenhancing componentThe enhancement of over 50% of the tumor area is considerably lower than that of the liver parenchyma in AP [70].41.4–54.1%OR = 2.68QuantitativeRadiomics and deep learningNANAAUC = 0.80–0.99MTM-HCCQualitativeIntratumoral necrosis (Necrosis or severe ischemia*, substantial necrosis, hypovascular component on AP)Presence of nonenhancing area in a solid mass, not attributable to a cystic component, prior treatment, or intralesional hemorrhage [6, 41, 45, 47];OR presence of a central area of high-signal intensity on T2WI without enhancement and involving at least 20% of the tumor area at the level of the largest cross-sectional diameter [44, 57];OR the presence of a hypovascular component during AP, occupying at least 20% of the total tumor volume [42].21.4–93.0%OR = 3.32–32.0Sensitivity = 65–88%Specificity = 57–93%Intratumoral hemorrhagePresence of a hyperattenuated area with a relatively lower attenuation compared with calcification on the nonenhanced images [45].15.0%OR = 5.4Rim APHESpatially defined subtype of arterial phase hyperenhancement in which arterial phase enhancement is most pronounced in the tumor periphery [41, 47].~15%OR = 2.63Sensitivity = 16%Specificity = 92%Intratumoral arteryPresence of discrete arteries within the tumor on AP [42, 47].45.0–67.0%OR = 2.58Sensitivity = 45-58%Specificity = 76–78%Corona enhancementPeritumoral enhancement in the late arterial phase or early portal venous phase. The enhancement is contiguous with and surrounds all or part of the tumor [42, 47].51.0%OR = 2.55Sensitivity = 26–51%Specificity = 78–88%Non-smooth tumor marginThe tumor margin is irregular and/or has areas of bulging, nodular projection, or infiltration into adjacent tissues at the tumor periphery in any imaging plane [42, 47].67–76%Sensitivity = 67%Specificity = 65%Tumor in veinUnequivocal presence of enhancing soft tissue in the vein, regardless of the presence of parenchymal mass [42].14.3–35%OR = 2.35Sensitivity = 21%Specificity = 89%Infiltrative appearanceA non-circumscribed tumor margin (indistinct transition) covering > 50% of the tumor circumference may indicate permeative growth [41].~25%NAPeritumoral HBP hypointensityPresence of irregular, wedge-shaped, or flame-like hypointense area of liver parenchyma located outside of the tumor margin in the hepatobiliary phase [47].NAOR = 2.21Sensitivity = 44%Specificity = 71%QuantitativeTumor size* (larger)The outer-edge-to-outer-edge dimension of a tumor is larger than that of non-MTM HCC [6, 44].NANALow ADC valueADC value of the tumor in whole or in part is lower than the liver [6].NAOR = 3.05Sensitivity = 59%Specificity = 68%Radiomics and deep learningNANAAUC = 0.74–0.91Progenitor HCCQualitativeNon-smooth tumor marginThe tumor margin is irregular and/or has areas of bulging, nodular projection, or infiltration into adjacent tissues at the tumor periphery in any imaging plane [31, 50, 51].73.7–81.6%OR = 3.05–6.66Sensitivity = 74.0–81.6%Specificity = 54.9–70%Rim APHESpatially defined subtype of arterial phase hyperenhancement in which arterial phase enhancement is most pronounced in the tumor periphery [31].36.80%OR = 8.71Sensitivity = 36.8%Specificity = 70.1%Targetoid appearanceIncluding targetoid restriction and targetoid TP orHBP appearance, as defined in LI-RADS v2018 [50].42.1%OR = 26.17Sensitivity = 42%Specificity = 97%Mosaic architecture* (absence)Absence of any combination of internal nodules, compartments, or septations, within a solid or mostly solid mass [50].21.0%OR = 15.7Sensitivity = 21%Specificity = 92%Progressive or persistent dynamic enhancement patternEither a gradual increase in solid tumor enhancement that peaks in the delayed phase or a consistent intensity throughout the arterial and venous phases [51].25.0%NAQuantitativeLow tumor-to-liver ADC ratioTumor-to-liver ADC ratio ≤ 0.82 [31]NAOR = 13.28Sensitivity = 36.8%Specificity = 93.6%Low tumor-to-liver SI on HBPTumor-to-liver SI ratio on HBP ≤ 0.52 [31]NAOR = 3.12Sensitivity = 92.1%Specificity = 59.3%Radiomics and deep learningNANAAUC = 0.73–0.85* Represents the radiologic feature is included in LI-RADS v2018, otherwise not^†^ The presentation of ORs or diagnostic metrics (sensitivities, specificities, AUCs) is based on the availability of data provided in the original studiesOR odds ratio, AUC area under the curve, HCC hepatocellular carcinoma, MTM macrotrabecular-massive, AP arterial phase, APHE arterial phase hyperenhancement, HBP hepatobiliary phase, ADC apparent diffusion coefficient, T2WI T2-weighted imaging, T1WI T1-weighted imaging, SI signal intensity, TP transitional phase, NA not available, LI-RADS liver imaging reporting and data systemTable 2Imaging features associated with non-proliferative HCC and their predictive or diagnostic performanceSubtypesImaging featuresMRI imagesDefinitionsFrequenciesORs/AUCs^†^SH-HCCQualitativeFat in massExcess fat within a mass, in whole or in part, relative to the adjacent liver [41, 57].26.7–66.7%OR = 15.07QuantitativeTumor size (smaller)The outer-edge-to-outer-edge dimension of a tumor is smaller than that of non-SH HCC [41, 57].NANACTNNB1-mutatedQualitativeHBP iso-/hyperintensitySignal intensity of the tumor in the hepatobiliary phase (nearly) identical to or higher than that of the liver, in whole or in part [7].NANAQuantitativeTumor size* (larger)The outer-edge-to-outer-edge dimension of a tumor is larger than that of HCCs without CTNNB1 mutations [16].NAOR = 2.14Higher ADC valueNACalculated as: ADC = Log [SI_1_/ SI_2_] / [b_2_–b_1_], where SI_1_ and SI_2_ are the SIs of ROI_1 and_ ROI_2_, with b_1_ = 0 s/mm² and b_2_ = 800 s/mm² [7].NANARadiomics and deep learningNANANAAUC = 0.70–0.88 [66, 67]* Represents the radiologic feature is included in LI-RADS v2018, otherwise not^†^ The presentation of ORs or AUCs is based on the availability of data provided in the original studiesSH steatohepatitic, OR odds ratio, AUC area under the curve, HCC hepatocellular carcinoma, HBP hepatobiliary phase, ADC apparent diffusion coefficient, SI signal intensity, ROI region of interest, NA not available, LI-RADS liver imaging reporting and data system
Proliferative class
MTM-HCC
On CT/MRI, MTM-HCC has been associated with larger tumor size, higher frequency of substantial necrosis and hypovascular component on arterial phase (AP), tumor in vein and Liver Imaging Reporting and Data System M (LI-RADS M) features (e.g., rim arterial phase hyperenhancement [APHE]) compared with non-MTM-HCC [41, 42].
Specifically, Rhee et al reported that irregular rim APHE on gadoxetic acid-enhanced MRI (EOB-MRI) were more frequently observed in tumors with macrotrabecular patterns in a single-center retrospective study [5]. In a subsequent multicenter study, the same team further found that the hypovascular component ≥ 20% on AP could be used to diagnose MTM-HCCs with a negative predictive value of over 90%. When the hypovascular component exceeded 50%, along with ≥ 2 ancillary findings (i.e., intratumoral artery, peritumoral enhancement on AP, and non-smooth tumor margin), the diagnostic specificity increased to 96% [42]. On CT, Rhee and colleagues found this criterion to be as effective as on EOB-MRI for the diagnosis of the MTM subtype and for prognostication, although the included patients overlapped completely with their previous work [43]. Similarly, Mulé et al reported a specificity of 93% for substantial necrosis (the absence of enhancement combined with T2 hyperintensity in ≥ 20% of the tumor’s maximal diameter) for identifying MTM-HCCs [44]. Despite promising results reported thus far, defining the hypovascular or necrotic component ratio may be challenging and increase inter-reader variability [41, 44].
Integrating clinical factors further enhances the noninvasive diagnostic performance for MTM-HCC [6, 45, 46]. For example, Feng et al proposed an ANH score (AFP, necrosis, and hemorrhage) based on CT for diagnosing MTM-HCCs, achieving an area under the curve (AUC) of 0.73 in the external validation cohort. Interestingly, substantial necrosis was also related to the vascular endothelial-to-tumor cell transition pattern. Similarly, Chen et al developed a nomogram incorporating high platelet count (≥ 163.5 × 10³/µL), low tumor-to-liver apparent diffusion coefficient (ADC) ratio (≤ 1.05), and necrosis or severe ischemia, which achieved an AUC of 0.81 in the validation dataset. The aforementioned conclusions were not entirely consistent, possibly due to differences in study populations and surgical resection indications. Moreover, some of the associations (e.g., high platelet count) are not well understood. Nonetheless, they uniformly highlighted the utility of intratumoral necrosis in diagnosing MTM-HCCs. This finding was further verified in a meta-analysis, which showed the highest pooled odds ratio of intratumoral necrosis (4.16) for the diagnosis of MTM-HCC (Fig. 3) [47]. Compared with non-MTM-HCC, vascular invasion is more frequent in MTM-HCC. While macrovascular invasion can be inferred from the imaging finding directly, the assessment of MVI and vascular encapsulated tumor clusters (VETC) remains challenging. The imaging findings associated with MVI and VETC are detailed in Supplementary Material 2.Fig. 3. Imaging of a 62-year-old male with chronic hepatitis B virus infection and macrotrabecular-massive HCC (*, A–E). The lesion shows focal hyperintensity on the T1-weighted image (arrow in A), suggestive of intratumoral hemorrhage, and hyperintensity on the T2-weighted image (arrow in B), indicative of intratumoral necrosis. The lesion also demonstrates non-rim APHE on arterial phase image (C), nonperipheral washout on portal venous phase image (D), and marked diffusion restriction on diffusion weighted image (E). Hematoxylin-eosin staining under light microscopy reveals a macrotrabecular pattern (F). The patient underwent surgical resection and died 6 months postoperatively
In addition to semantic features, studies also unveiled the potential of radiomic features in diagnosing MTM-HCC. In a retrospective study of 365 HCC patients from three hospitals in China, a CT-based radiomic model was developed using 11 radiomic features extracted from AP and portal venous phase (PVP), achieving an AUC of 0.74 in the external test set [48]. In an independent cohort of advanced HCC treated with TACE and antiangiogenic therapy, patients with lower radiomics scores showed longer progression-free survival. Since histopathology is not mandatory for HCC diagnosis, the information on pathological subtype is usually unavailable in non-surgical cases. In this setting, the results of Feng and colleagues shed light on the potential of MTM and its noninvasive diagnostic models as promising decision-making tools. More recently, Li et al developed a dual-energy CT-based deep learning radiomics nomogram for predicting MTM-HCC, based on 146 patients (98% with chronic HBV infection) in China, which achieved a superior AUC compared to the conventional clinical-radiologic model in the external test set (AUC, 0.89 vs 0.79) [49]. However, the model’s performance may vary in patients with HCV infection or metabolic dysfunction-associated steatotic liver disease, and further validation is needed to assess its generalizability.
While the emerging data are promising, no model is yet sufficiently validated to be applied in clinical practice to make the noninvasive diagnosis of MTM-HCC.
Progenitor HCC
The available evidence indicates that progenitor HCCs tend to exhibit LR-M features, particularly the targetoid appearance, which demonstrates relatively high specificity. For example, in a single-center retrospective study, irregular tumor margin, rim APHE, lower tumor-to-liver ratio on ADC, and lower tumor-to-liver signal intensity ratio on hepatobiliary phase (HBP) were independent predictors for CK19-positive HCC, achieving a diagnostic specificity of 99.5% [31]. In addition to irregular margins and rim APHE, Chen et al reported that progenitor HCCs (either CK19 or EpCAM positive) were more prone to exhibit targetoid appearance and lack of mosaic architecture [50].
Furthermore, skewness on T2WI and uniformity on pre-T1WI were identified as key quantitative indicators of progenitor HCCs. Other studies identifying MRI features for predicting progenitor HCCs reached similar conclusions (Fig. 4) [51–53]. Additionally, scholars also explored radiomics-based models for diagnosing CK19-positive HCCs, which demonstrated improved predictive values over traditional radiologic models (AUCs, 0.73–0.85) [54–56].Fig. 4. Imaging of a 48-year-old male with chronic hepatitis B virus infection and cytokeratin-19-positive HCC. The lesion (arrow, A–E) shows hypointensity on T1-weighted image (A), mild to moderate hyperintensity on T2-weighted image (B), rim hyperenhancement on arterial phase image (C), delayed central enhancement on PVP image (D), and marked diffusion restriction on diffusion weighted image (E). Immunohistochemistry reveals positive expression of cytokeratin-19 (F). The patient underwent surgical resection, with intrahepatic metastasis occurring approximately 24 months postoperatively
Similar to MTM-HCC, no model is yet sufficiently validated to be applied in clinical practice to make the noninvasive diagnosis of progenitor HCC.
Non-proliferative class
SH-HCC
In general, SH-HCCs have been consistently associated with the presence of intratumoral fat and smaller tumor size in published literature, although the basis for their small size has not been elucidated [41, 48, 57].
For example, in a single-center retrospective study, the SH-HCC subtype was found in 21.0% (62/295) of HCC, and fat in mass (an ancillary feature favoring HCC in LI-RADS) was more frequently detected in this subtype [41]. Furthermore, SH-HCCs were smaller and, when exceeding 10 mm in size, more frequently classified as LR-5, as confirmed in another multicenter study [57]. However, it should be noted that fat in mass is not a specific feature for SH-HCC, as it can also be observed in certain proportions of conventional, MTM, and clear-cell HCCs [58, 59]. In patients with MASH, intratumoral fat in the absence of mosaic architecture could achieve specificities reaching up to 97.6–97.7% for the diagnosis of SH-HCC [35]. Additionally, the fat component may be difficult to evaluate qualitatively when the background liver is steatotic. In this setting, quantitative MRI approaches such as proton density fat fraction (PDFF) may be helpful, although PDFF sequences tend to have low spatial resolution and so are not likely to detect small foci of fat within a tumor. The distribution of fat within a lesion (homogeneous or heterogeneous) may have diagnostic and prognostic implications, as shown by Jiang and Cannella et al in their multicenter retrospective study. The authors defined “homogenous fat” as excess intratumoral fat relative to adjacent liver without mosaic and nodule-in-nodule architecture, whereas “heterogeneous fat” referred to fat-containing tumors with either the mosaic or nodule-in-nodule architecture. Notably, HCCs with homogeneous intratumoral fat (Fleiss’ κ value, 0.38–0.41) were more frequently observed in SH-HCC and were associated with smaller tumor size in both Asian and European cohorts. Prognostically, homogeneous intratumoral fat was associated with longer recurrence-free survival and overall survival in the Asian cohort, suggesting that MRI-assessed intratumoral fat pattern should be considered as an additional factor beyond the mere presence or absence of intratumoral fat [59, 60].
Noteworthily, unlike typical hepatocarcinogenesis in most HCCs, approximately 30% of SH-HCCs can develop directly in MASH patients without cirrhosis [61]. With metabolic dysfunction increasingly driving SH-HCC incidence, future research should identify additional radiologic hallmarks to address the shift from virus-dominated to metabolism-dominated HCC etiology (Fig. 5).Fig. 5. Imaging of a 52-year-old male with chronic hepatitis B virus infection and steatohepatitic HCC. The lesion (arrow, A–E) shows hypointensity on in-phase T1-weighted image (A) and significant signal loss on out-phase T1-weighted image (B), non-rim hyperenhancement on arterial phase image (C), no washout on PVP image (D), and diffusion restriction (E). Hematoxylin-eosin staining reveals numerous unstained fat vacuoles (F). The patient remains recurrence-free 30 months postoperatively
CTNNB1-mutated HCC
CTNNB1 is one of the most frequently mutated genes in HCC, occurring in approximately 15–40% of cases [16, 18]. Similar to progenitor HCC, CTNNB1-mutated HCC is not among the eight pathological subtypes in the WHO, but still constitutes a specific genetic/molecular subtype.
It is widely accepted that the expression of organic anion transporting polypeptide (OATP) 1B3, a transporter for hepatobiliary-specific contrast agents, decreased during hepatocarcinogenesis, resulting in hypointensity of most HCC in comparison to liver parenchyma on HBP [62, 63]. However, a small proportion ( < 15%) of HCC exhibits iso-/hyperintensity on HBP, and these HCC have been characterized by CTNNB1 mutation (also regarded as β-catenin mutation or cholestatic-HCCs in some studies) [64]. Kitao et al retrospectively analyzed 138 resected HCCs from 121 patients and found a high enhancement ratio on HBP and a high ADC value to be more frequent in HCCs with β-catenin mutation [7]. In another study by the same team, a higher enhancement ratio on HBP was also found for β-catenin and hepatocyte nuclear factor 4α (HNF4α)-positive HCCs, implying the potential of β-catenin and HNF4α co-activation to contribute to this feature (Fig. 6) [65].Fig. 6. Imaging of a 56-year-old male with chronic hepatitis B virus infection and OATP-positive HCC. The lesion (arrow, A–E) shows isointensity on the T1-weighted image (A), non-rim hyperenhancement on the arterial phase image (B), and no washout on the PVP image (C). The lesion also demonstrates isointensity on HBP image (D) and marked diffusion restriction on diffusion weighted image (E). Immunohistochemistry reveals positive expression of OATP (F). The patient remains recurrence-free 32 months postoperatively
HBP-based radiomic signatures facilitate CTNNB1-mutated HCCs, and the incorporation of PVP features may further improve predictive performance [66, 67]. However, these studies were limited by relatively small sample sizes (< 150 cases), actors, and external validation, which may impact the generalizability and reproducibility of these models. Thus, these radiomic models are useful for showing proof of concept but are not yet sufficiently validated for clinical implementation.
Other uncommon subtypes
Given their low incidence (< 5%), studies on uncommon HCC subtypes (e.g., scirrhous, neutrophil-rich, clear-cell, chromophobe, fibrolamellar, and lymphocyte-rich HCCs) are limited [40, 68]. Detailed findings are provided in Supplementary Material 2.
Gaps and future directions
Despite the potential of imaging in non-invasively assessing the molecular and pathological subtypes of HCC, current studies have several key limitations.
Gaps in the molecular and pathological classification systems
Firstly, due to the complexity and high cost of high-throughput sequencing technologies, most studies have relied on histology as a surrogate for molecular classification rather than multiomics sequencing. This is problematic because histopathologic analysis and multiomics sequencing do not demonstrate perfect correlation. Secondly, given the marked heterogeneity of HCC, it is likely that some HCCs simultaneously exhibit molecular alterations of both proliferative and non-proliferative classes (“overlap” tumors), but this possibility is ignored by current classification systems. Characterization of “overlap” HCC will require more comprehensive spatial sampling than is currently performed. Finally, because histopathologic confirmation is not mandatory to establish the definite diagnosis of HCC in at-risk patients, a large proportion of patients (particularly those with unresectable tumors) do not receive histopathologic examinations on a daily basis. Therefore, it is challenging to confirm the correlations between imaging predictors and the molecular/pathological subtypes.
Gaps in imaging-based classification, prognostication, and prediction
First and foremost, although some studies have proposed management strategies for molecularly defined proliferative HCC or more aggressive pathological subtypes, their clinical value remains unproven [23]. On one hand, 65% of conventional HCCs and some rare subtypes lack clear prognostic and predictive significance; on the other hand, there is no consensus regarding whether imaging-classified proliferative class or aggressive pathological subtypes necessitate more aggressive intervention (e.g., surgery over ablation, wider resection margins, anatomical resections), or systemic therapies [21]. Future studies are encouraged to accumulate high-quality evidence (e.g., multi-center, large sample size, and well-standardized data collection) regarding the clinical utility of molecular and pathological classification systems. Secondly, most studies are single-center, retrospective, with relatively small sample sizes, which inevitably limits the level of evidence. Multi-center, large-cohort, and prospective studies are encouraged to fuel the clinical applicability of imaging-based prediction for molecular and pathological classification. Thirdly, the majority of the analyzed patients had chronic HBV infection, challenging the extrapolation of current findings to patients with other chronic liver disease etiologies [49, 69]. Future studies may benefit from international collaborations by including patients with more diverse etiological backgrounds. Fourthly, HCC exhibits substantial intra-individual and inter-individual heterogeneity, but pinpoint radiology–pathology spatial correlation at the voxel (radiology) and lesion-segment (pathology) level was seldom achieved in existing studies due to the retrospective nature of data collection. This makes correlating imaging findings with related molecular and pathological classification difficult. One possible way to address this challenge is to employ artificial intelligence-assisted image processing and 3D-printed patient-specific molds to achieve precise radiology–pathology correlation. This methodological innovation may help overcome current limitations and facilitate a more robust correlation between imaging features and underlying molecular or pathological profiles.
Conclusion
Characterizing the molecular and pathological subtypes of HCC may improve individualized management and prognostication. Increasing studies have unveiled the potential of imaging as a noninvasive biomarker for molecular and pathological subtypes of HCC, with preliminary results suggesting that HCC identified as proliferative class through CT/MRI-based models demonstrate lower response rates following TACE but may potentially benefit from combined tyrosine kinase inhibitor (TKI)-ICI treatment [23, 38, 70]. Since biopsy to identify proliferative HCC is not routinely performed prior to intra-arterial or systemic treatment, suspicious imaging findings suggestive of aggressive HCC subtypes may warrant consideration of a more proactive biopsy strategy. However, the narrow representativeness of study populations and the lack of rigorous molecular-pathologic-radiologic correlation hinder the application of imaging as an effective decision-making tool. Further comprehensive and in-depth attempts are encouraging. Additionally, in light of sampling errors and the technical constraints of molecular analyses, a phenotyping system integrating clinical, imaging, pathological, and molecular phenotypes may be more attractive in modern clinical settings (e.g., unsupervised clustering analysis integrating all the above information). To further support the utility of the molecular and pathological classification of HCC, larger-scale multi-center prospective studies covering a wider range of liver diseases are highly encouraged in the future. More rigorous molecular-pathologic-radiologic correlations and integrated classification systems that take imaging features into account may provide more practical guidance for individualized management.
Supplementary information
Supplementary information
The reference list from the paper itself. Each links out to its DOI / PubMed record.
- 1WHO Classification of Tumours Editorial Board (2019) Digestive system tumours. WHO Classification of Tumours, 5th edn. IARC, Lyon. https://publications.iarc.fr/Book-And-Report-Series/Who-Classification-Of-Tumours/Digestive-System-Tumours-2019
- 2Kim T-H, Woo S, Lee DH, Do RK, Chernyak V (2024) MRI imaging features for predicting macrotrabecular-massive subtype hepatocellular carcinoma: a systematic review and meta-analysis. Eur Radiol 34:6896–690710.1007/s 00330-024-10671-1PMC 1205808638507054 · doi ↗ · pubmed ↗
- 3Fowler KJ, Burgoyne A, Fraum T et al (2021) Pathologic, molecular, and prognostic radiologic features of hepatocellular carcinoma. Radiographics 41:1611–163110.1148/rg.202121000934597222 · doi ↗ · pubmed ↗
- 4Kitao A, Matsui O, Yoneda N et al (2011) The uptake transporter OATP 8 expression decreases during multistep hepatocarcinogenesis: correlation with gadoxetic acid–enhanced MR imaging. Eur Radiol 21:2056–206610.1007/s 00330-011-2165-821626360 · doi ↗ · pubmed ↗
- 5Yan Z, Liu Z, Zhu G et al (2024) Gadoxetic acid-enhanced MRI-based radiomic models for preoperative risk prediction and prognostic assessment of proliferative HCC. Acad Radiol 32:157–16910.1016/j.acra.2024.07.04039181825 · doi ↗ · pubmed ↗
- 6Lu M, Yan Z, Qu Q et al (2024) Diagnostic model for proliferative HCC using LI-RADS: assessing therapeutic outcomes in hepatectomy and TKI-ICI combination. J Magn Reson Imaging 61:134–14710.1002/jmri.2940038647041 · doi ↗ · pubmed ↗