Vascular, physical fitness, lifestyle, and body composition characteristics in middle-aged and older diver fishermen: association between shear rate and lower-limb physical fitness
Alex Véliz, Raquel Pereira Berríos, Anita Dörner Paris, David C. Andrade, Cristian Álvarez

TL;DR
This study examines vascular and physical fitness traits in middle-aged and older diver fishermen, finding that lower-limb fitness correlates with vascular shear rates.
Contribution
The study identifies a novel association between vascular shear rates and lower-limb physical fitness in diver fishermen.
Findings
Middle-aged diver fishermen showed better upper and lower-limb physical fitness compared to older fishermen.
Lower-limb fitness, measured by the Ruffier test, was significantly associated with vascular shear rates in both brachial and carotid arteries.
Abstract
First, to describe the vascular, physical fitness, lifestyle, and body composition characteristics of middle-aged and older adult diver fishermen. Second, to associate vascular outcomes with physical fitness (upper and lower limbs). A descriptive pilot study was performed in middle-aged [MA-DF, n = 11, body mass index (BMI) 29.9 ± 4.9, mean arterial pressure (MAP) 103.9 ± 6.2 mmHg] and older (OA-DF, n = 11, BMI 28.5 ± 2.7, MAP 111.8 ± 9.6 mmHg) adult diver fishermen. In each group, brachial (BA) and common carotid artery (CCA) diameter (D BA; D CCA), peak systolic (PSVBA; PSVCCA), end-diastolic velocity (EDVBA; EDVCCA), shear rate (SRBA; SRCCA), resistance index (RIBA; RICCA), pulsatility index (PIBA; PICCA), Reynolds number (ReBA; ReCCA), handgrip strength right (HGSRA), left (HGSLA), and average (HGSAV) and lower-limb fitness (Ruffier test) were the main outcomes, while other types…
Genes, proteins, chemicals, diseases, species, mutations and cell lines named across the full text — each resolved to its canonical identifier and authoritative record.
Click any figure to enlarge with its caption.
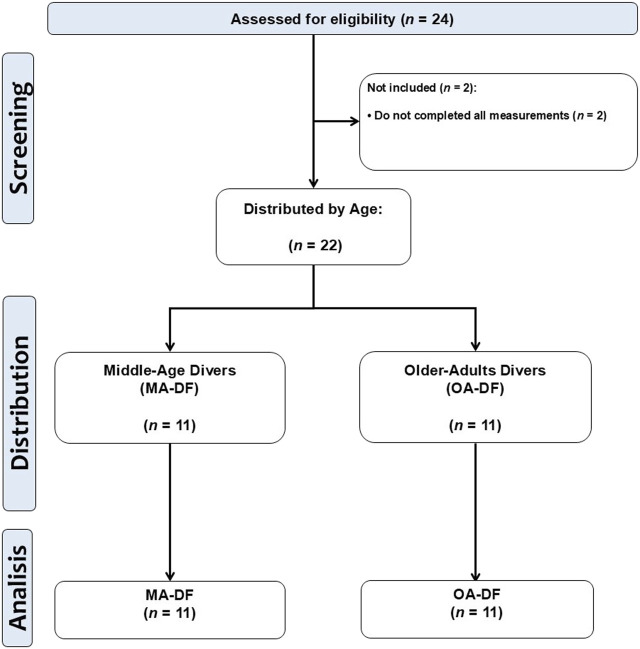 FIGURE 1
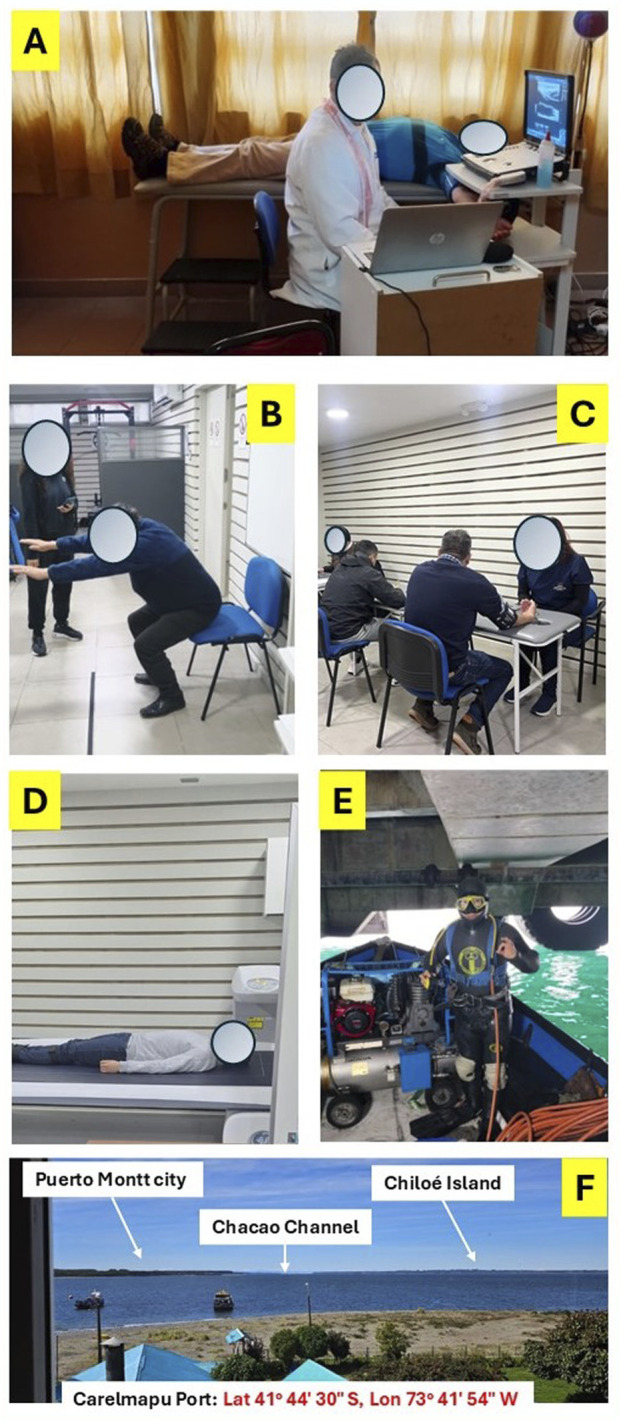 FIGURE 2
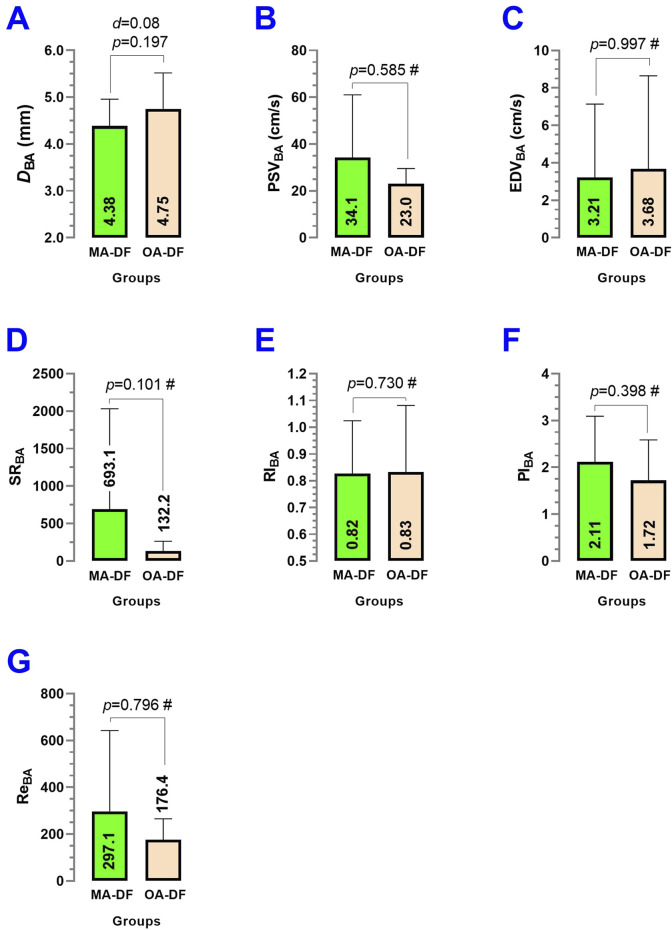 FIGURE 3
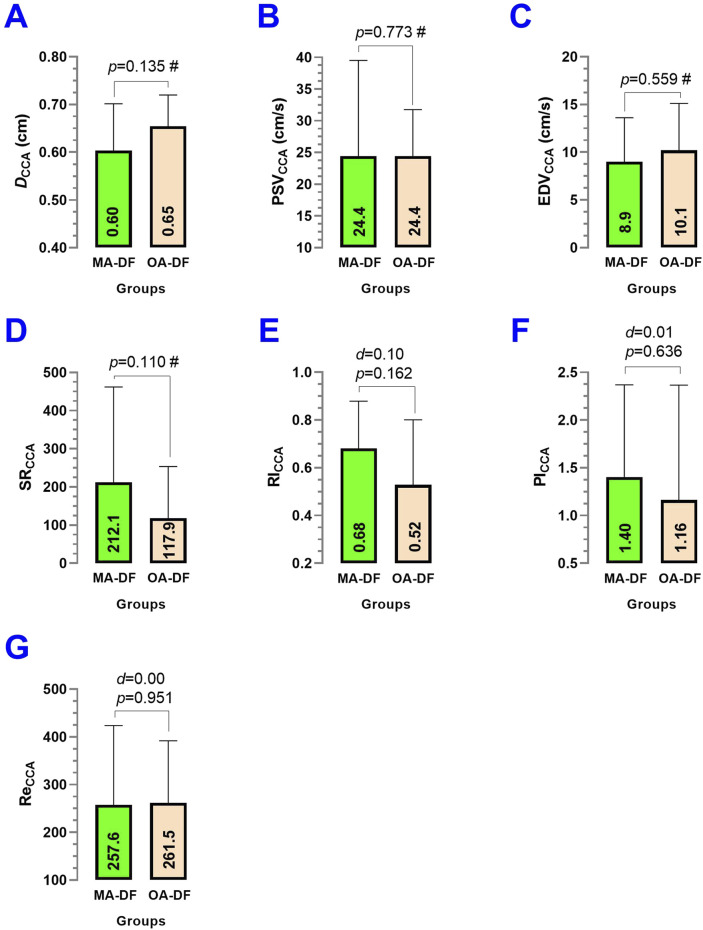 FIGURE 4
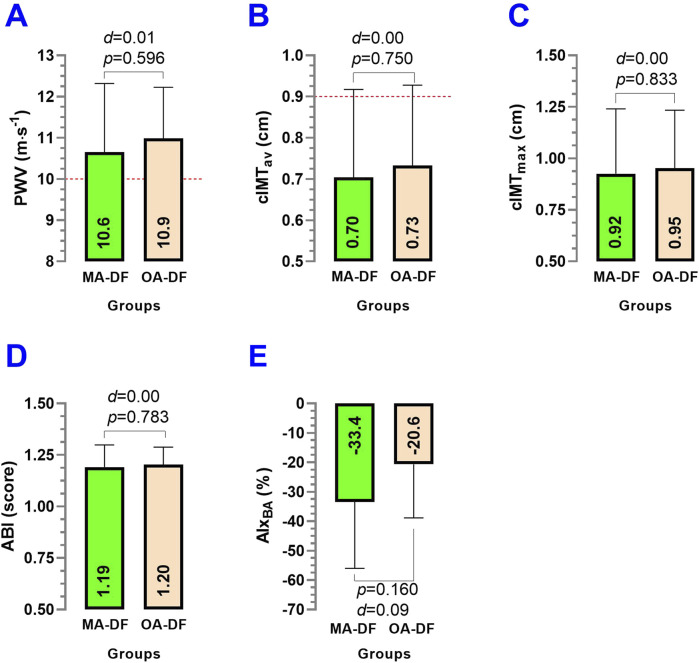 FIGURE 5
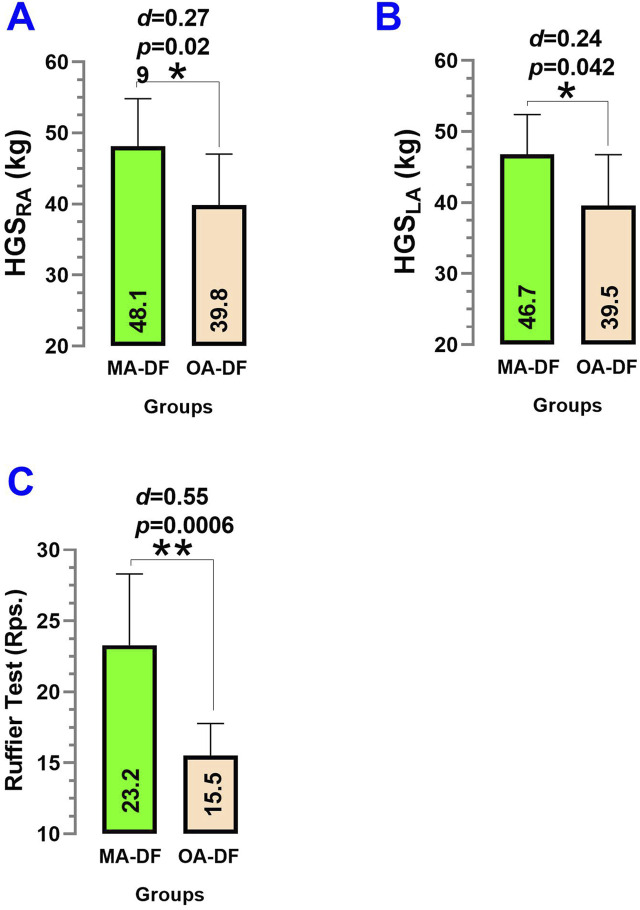 FIGURE 6
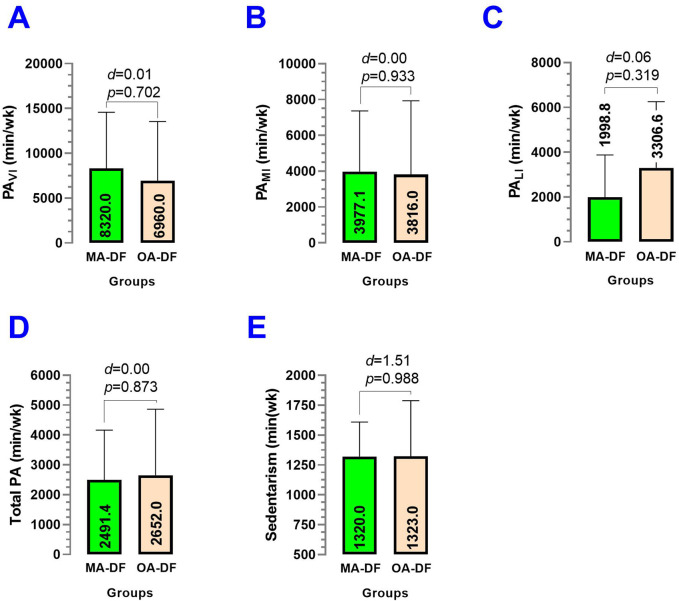 FIGURE 7
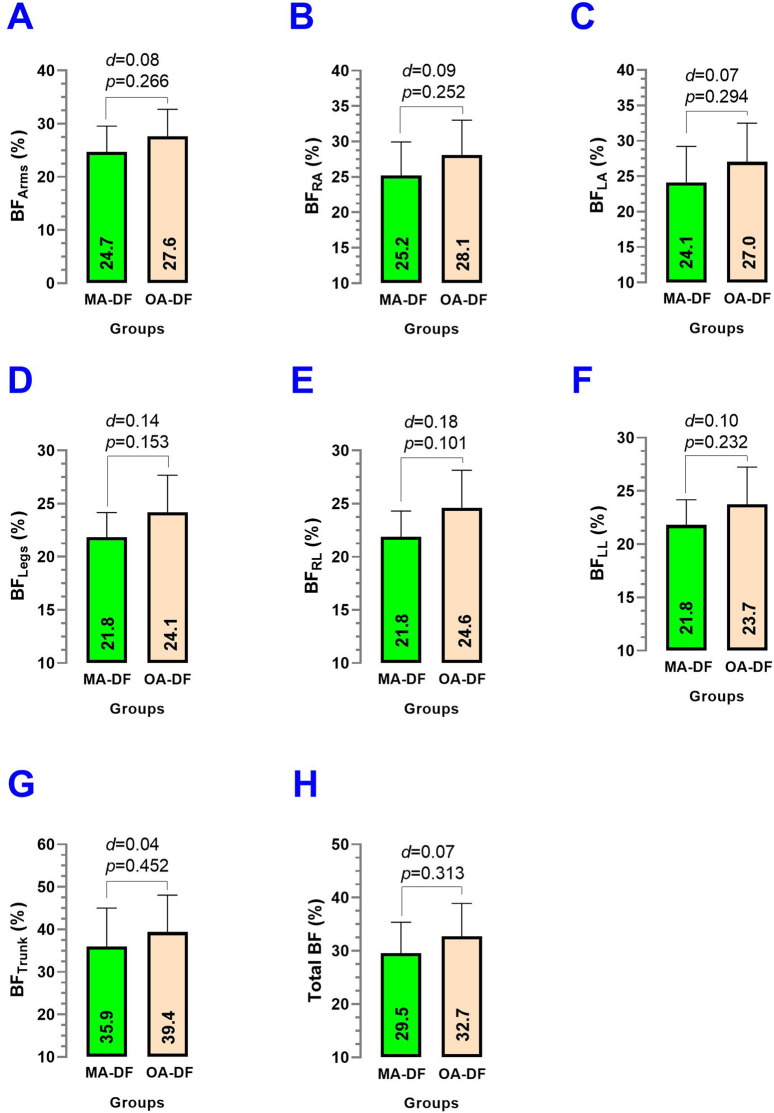 FIGURE 8
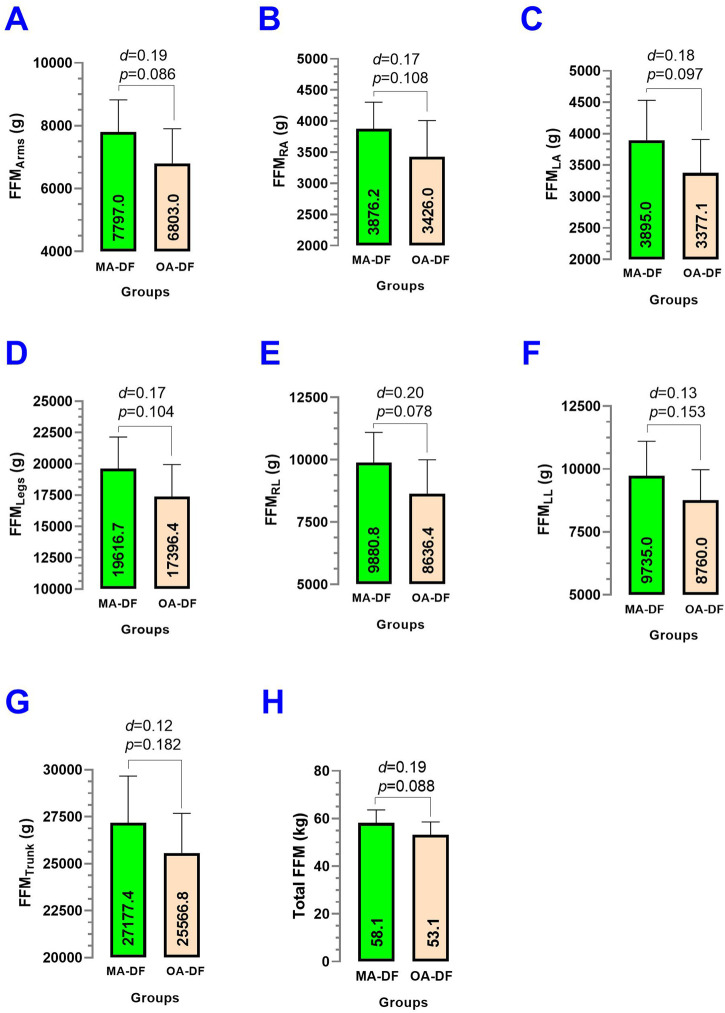 FIGURE 9
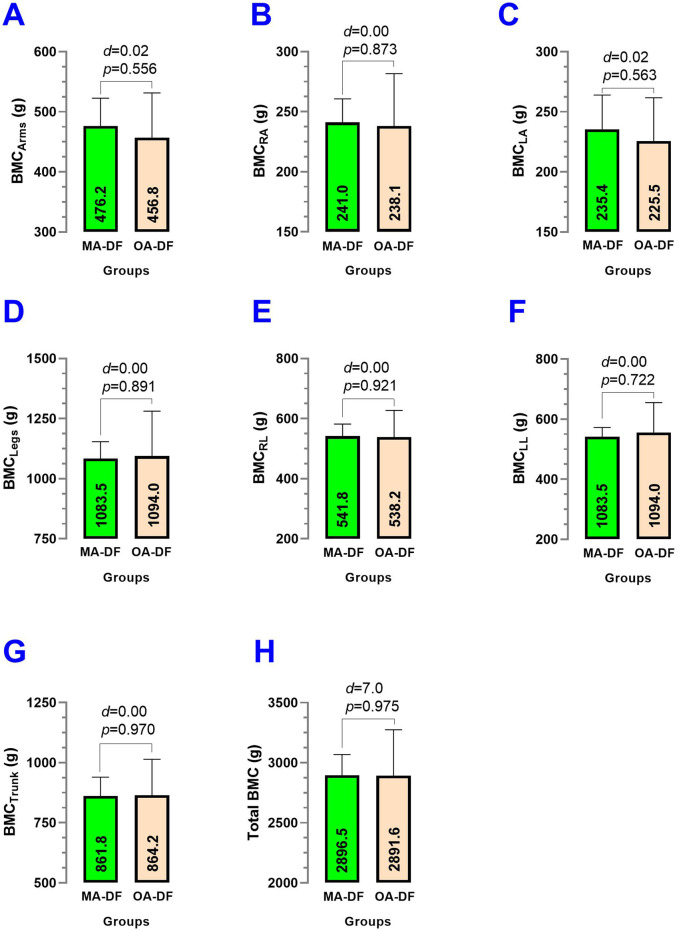 FIGURE 10
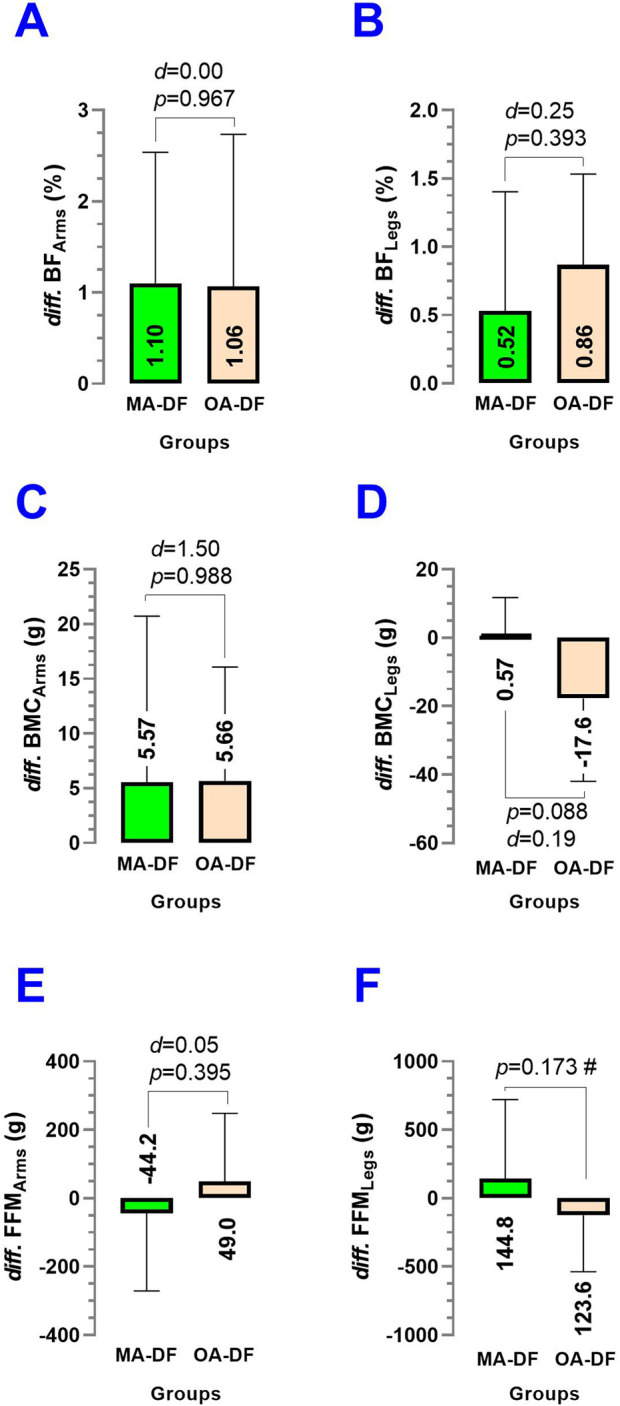 FIGURE 11
| Outcome | MA-DF | OA-DF |
|
|---|---|---|---|
| Age (y) | 48.0 ± 8.5 | 66.0 ± 5.9 |
|
| Height (cm) | 169.7 ± 5.3 | 171.8 ± 5.4 |
|
| Weight (kg) | 86.0 ± 12.6 | 84.4 ± 10.1 |
|
| Body mass index (kg/m2) | 29.9 ± 4.9 | 28.5 ± 2.7 |
|
|
| |||
| Systolic BP (mmHg) | 138.2 ± 6.0 | 150.1 ± 16.3 |
|
| Diastolic BP (mmHg) | 87.0 ± 6.7 | 92.6 ± 7.6 |
|
| Mean arterial pressure (mmHg) | 103.9 ± 6.2 | 111.8 ± 9.6 |
|
|
| |||
| Normal ( | 2 (18.1) | 0 (0) |
|
| High blood pressure ( | 6 (54.5) | 4 (36.3) | |
| Hypertensive ( | 3 (27.2) | 7 (63.6) | |
| Dependent outcome—predictor | B (estimate) | SE |
|
| 95%CI |
|---|---|---|---|---|---|
|
| |||||
| Intercept |
|
|
|
|
|
| | −0.03 | 0.03 | 1.2 |
| −0.1; 0.02 |
| | −0.01 | 0.02 | 0.6 |
| −0.06; 0.03 |
| | −0.01 | 0.02 | 0.2 |
| −0.09; 0.06 |
| | −0.08 | 0.06 | 1.3 |
| −0.2; 0.05 |
|
| |||||
| Intercept | −2,342.0 | 1,655.0 | 1.4 |
| −5,948.0; 1,264.0 |
| SRBA (s-1) – Adj.Age (y) | 13.9 | 11.8 | 1.1 |
| −11.7; 39.7 |
| SRBA (s-1) – Adj.MAP (mmHg) | 6.4 | 8.6 | 0.7 |
| −12.3; 25.3 |
| SRBA (s-1) – HGSAV (kg) | −14.9 | 14.4 | 1.0 |
| −46.3; 16.4 |
| SRBA (s-1) – Ruffier test (repetitions) |
|
|
|
|
|
|
| |||||
| Intercept | 0.9 | 0.4 | 2.0 |
| −0.07; 1.8 |
| | −0.0001 | 0.003 | 0.04 |
| −0.007; 0.006 |
| | −0.0008 | 0.002 | 0.3 |
| −0.005; 0.004 |
| | −0.003 | 0.003 | 1.0 |
| −0.01; 0.004 |
| | 0.0007 | 0.006 | 0.1 |
| −0.01; 0.01 |
|
| |||||
| Intercept | −658.3 | 1,217.0 | 0.5 |
| −3,338.0; 2021.0 |
| SRCCA (s-1) – Adj.Age (y) | 3.3 | 8.4 | 0.3 |
| −15.3; 22.0 |
| SRCCA (s-1) – Adj.MAP (mmHg) | 3.0 | 6.0 | 0.4 |
| −10.3; 16.3 |
| SRCCA (s-1) – HGSAV (kg) | −10.3 | 10.0 | 1.0 |
| −32.5; 11.8 |
| SRCCA (s-1) – Ruffier test (repetitions) |
|
|
|
|
|
- —Agencia Nacional de Investigación y Desarrollo10.13039/501100020884
Peer Reviews
No public reviews on file for this paper yet. If you reviewed it on a platform where reviews are public (OpenReview, ICLR, NeurIPS, ICML), you can paste yours below so the community can read it here.
Videos
No videos yet. Explain this paper in a talk, walkthrough, or lecture? Add one.
Taxonomy
TopicsCardiovascular Health and Disease Prevention · Marine Bivalve and Aquaculture Studies · Orthopedic Surgery and Rehabilitation
Introduction
1
Diving involves a large population, with approximately nine million divers in the United States (Taylor et al., 2003). Excluding people who dive for tourism, scientific, or recreational aims, diving related to the fishing industry (i.e., aquiculture, salmon, and mollusk harvesting) represents an important occupational activity for young and older adults on the American coasts of the Pacific and Atlantic oceans. In Chile alone, for example, approximately 3,500–4,000 people dive commercially (Souto Cavalli et al., 2023; SUSESO, 2020). Diver fishermen (DF), technically known as “basic shellfish divers” by the Chilean Navy Force authority, show specific physiological adaptations and maladaptations in terms of vascular and body composition health (Armada De Chile, 2014).
Diving work is conducted in a “reduced gravitational environment” that is slightly similar to the zero gravity of space (Turner, 2000), and thus divers with more years of experience could show a reduced bone mineral content (Véliz et al., 2025). Although DF dedicated to mollusk harvesting are frequently doing upper limb movements in 20–36 m of depth, and these actions could not represent a major cardiovascular risk (i.e., under the correct application of the diving decompression rules) (Armada De Chile, 2014), this diving specialty offers a low load on the human skeleton and on lower-limb muscles that could implies potential bone mineral content (BMC) consequences at more adult ages in the long term (Hwang et al., 2006). The diving exposes the body to increased pressure and inert gas saturation, producing unique physiological effects and potential vascular disorders (Bove, 2014). The pressure changes can cause ear, sinus, or lung injuries due to gas volume shifts during ascent/descent, and the supersaturated inert gases may form nitrogen bubbles, leading to decompression disease (Bove, 2014). Other vascular consequences from the hyperbaric environment include endothelial dysfunction, which alters the nitric oxide production, and vasodilation, arterial stiffness, and oxidative stress that alters the endothelial cells (Obad et al., 2010). Conversely, muscular activity may counteract these effects. Muscular movement in the human skeleton, through maintaining a healthy lifestyle, such as adhering to international physical activity guidelines of different intensities and modalities (WHO, 2021), could contribute to muscle mass and strength maintenance of the upper and lower limbs and promote more osteogenic stimulus (Bevier et al., 1989; Li and Wang, 2025).
A recent governmental study conducted by the Chilean Superintendence of Social Security (SUSESO) showed a major prevalence of musculoskeletal disorders, hypertension, working memory impairment, and osteonecrosis in those DF more exposed to hyperbaric conditions (SUSESO, 2020). A more recent report adds that 36% of the DF industry reports a smoking habit and high prevalence of overweight and obesity (∼86.7%), which increases their cardiovascular risk (SUSESO, 2020). As aging is associated with progressive structural and functional deterioration of the vascular system (i.e., biological aging), some physical fitness factors (i.e., muscle strength, functional capacity and cardiorespiratory fitness) and lifestyle patterns (i.e., physical activity patterns and sedentary behavior) could worsen the vascular health and thus accelerate the occurrence of CVD when they are poorly addressed (Seth et al., 2025). Importantly, maintaining upper and lower limb physical fitness, such as muscular strength, functional capacity, or cardiorespiratory fitness, may mitigate some of the deleterious vascular effects of chronological aging (Subramanian et al., 2025). In this line, and with wide knowledge about the deleterious effects of environmental and work contexts in which employees spend much sedentary time, some strategies such as “exercise snacks” have been proposed to avoid early CVD in office workers (Lazić et al., 2025).
The DF of the Chilean coast begin this activity early in life and maintain active occupational work into older ages (i.e., >60 years old). However, there is little information regarding the peripheral and central vascular characteristics, physical fitness, or body composition, particularly in older adult divers. In this regard, handgrip strength (HGS) is a widely recognized marker of upper limb muscle strength, where higher levels show better cardiovascular health. In comparison, lower HGS levels are typically associated with a higher prevalence of CVD in Americans aged 20–60 years (Li and Wang, 2025). On the other hand, recent studies have highlighted the relevance of using simple field-based or clinical tests due to their potential to estimate physical fitness parameters [i.e., cardiorespiratory fitness (CRF), muscle strength fitness, or functional capacity] and thereby help prevent CVD (Vakulenko et al., 2024; Vakulenko and Vakulenko, 2024; González-García and McCarthy, 2022). For lower-limb physical fitness, the Ruffier test was previously associated with CRF and cardiovascular risk (Alahmari et al., 2020), and it is useful for estimating CRF in divers (Sartor et al., 2016). Similarly, the peak oxygen consumption (VO2_peak_), a surrogate for maximal oxygen uptake and frequently used in clinical testing (Zamodics et al., 2025), is a strong predictor of CVD and mortality (Weeldreyer et al., 2025). The Ruffier test has shown significant correlation with femoral artery blood flow recovery in trained athletes and may be useful for monitoring physiological recovery after physical efforts using Doppler ultrasound (Piquet et al., 2000). Previous studies in divers have also reported that they exhibit greater carotid intima–media thickness (cIMT), and lower peak systolic and end-diastolic velocity values [i.e., resulting in different shear rate (SR)] compared with healthy adult controls (Dormanesh et al., 2016). However, it is also well documented that increasing age is associated with a greater increase in arterial stiffness determined by the pulse wave velocity vascular outcome (PWV). For example, hypertensive populations are known to show elevated PWV values (i.e., ≥10 m·s^−1^) that denote elevated CVD risk in adults. At the same time, lifestyle interventions such as exercise can also improve these outcomes (i.e., decrease PWV) (Álvarez et al., 2024). Thus, if DF of different ages present differences in physical fitness and traditional vascular parameters such as cIMT and PWV, it would similarly be reasonable to expect changes in blood flow variables such as shear rate (SR) and the Reynolds number to estimate “laminar” or “retrograde” blood fluxes (Gomez et al., 2022; Tremblay et al., 2019). Evidence is scarce regarding physical fitness and blood flow characteristics in the BA or CCA arteries of adult men exposed to pressure-changing environments, such as DF. The relationship of peripheral and central vascular characteristics in DF with the physical fitness of the upper and lower limbs is less clear, with the aim of detecting their vascular risk and preventing CVD. Assessing these outcomes among active DF of different age groups may elucidate modifiable factors that contribute to healthier vascular or musculoskeletal aging. Therefore, the main aim of this study was to describe the vascular, physical fitness, lifestyle, and body composition characteristics of middle-aged and older adult diver fishermen. The second aim was to associate vascular outcomes with physical fitness (upper and lower limbs). We hypothesize that upper- and lower-limb physical fitness can be associated with peripheral or central vascular parameters of function (i.e., SR_BA_ or SR_CCA_) or structure [i.e., diameters of BA (D BA) or CCA (D CCA)] of DF.
Materials and methods
2
Study participants
2.1
A descriptive pilot study was conducted from June 2024 to April 2025 in adult DF affiliated with social fishermen’s and mollusk harvesting organizations from the coastal cities of Puerto Montt, Calbuco, Maullín, and Carelmapu in southern Chile. Participants were recruited through an open call issued directly to the leaders of each divers’ organization. Prior to enrollment, the study aims, methodological procedures, and the scope of the assessments and counseling services were clearly presented to each organization. The inclusion criteria were as follows: i) age ≥18 years (legal adulthood under Chilean law); ii) active occupational diver; iii) membership in a recognized divers’ social or professional organization; and iv) availability to attend all study assessments. The exclusion criteria included i) any contraindication to undergoing an iDXA assessment involving X-ray exposure; ii) the presence of electronic medical devices, such as pacemakers or insulin pumps, that could interfere with iDXA evaluation; and iii) any condition that prevented the completion of non-invasive ultrasound assessments.
The research protocol received ethical approval from the Scientific Ethical Committee of the Universidad Mayor under approval number N° 0492 of 2024. All individuals who took part provided written informed consent, which included detailed information on the evaluation procedures, confidentiality, data protection measures, anonymity assurances, and a description of any potential risks. The sample size for this pilot descriptive study was decided based on prior data from a similar cohort of adult participants, using the body mass index (BMI) as a reference outcome. A standard deviation (SD) of ≤5.0 kg/m^2^ was used to represent expected interindividual variability in BMI within each group, consistent with previously reported values in comparable populations (Perovic et al., 2017). Thus, considering the exploratory nature of the study, a total of (n = 22) participants, divided into two groups (n = 11 per group), were selected to detect preliminary trends and inform future sample size estimations. A post-hoc power analysis conducted with G*Power software (version 3.1.9.6, Franz Faul, Universität Kiel, Kiel, Germany) revealed that with this SD and a moderate effect size (Cohen’s d = 0.5), the current sample provides an estimated statistical power of approximately 80% at a significance level of α = 0.05 (two-tailed). This sample is considered proper for pilot-level research and feasibility assessment of the study protocol. The final sample included groups of middle-aged diver fishermen (MA-DF, n = 11) and older adult diver fishermen (OA-DF, n = 11). The CONSORT study design can be seen in (Figure 1).
CONSORT study design flow chart.
Pulse wave velocity and co-variables
2.2
Arterial stiffness was measured by the pulse wave velocity (PWV) outcome. This outcome was measured in the BA using oscillometric pressure traces from the BA in the upper left arm in 90° abduction (measured in m·s^−1^) with an automatic digital device after a 20-min rest in a supine position (Arteriograph, TensioMed™, Hungary). Data analysis was conducted with the Arteriograph software v.1.9.9.2. This equipment operates similarly to a blood pressure assessment using a validated algorithm (Ring et al., 2014), and a PDF report was extracted as a result. The ankle-brachial index (ABI) and the augmentation index of the BA (AIx_BA_) were also extracted and registered. PWV values exceeding 10 m·s^−1^ indicate elevated arterial stiffness, correlating with increased CVD risk (Mancia et al., 2013).
Brachial and common carotid artery diameter and flow characteristics
2.3
First, the BA artery diameter (D BA) was continuously monitored using high-resolution ultrasound imaging (GE Medical Systems, Model LOGIQ-E PRO, Milwaukee, United States), after 20 min of rest, similar to previous studies (Thijssen et al., 2019). Shear rate of the BA (SR_BA_) was calculated using peak systolic velocity BA (PSV_BA_) and D BA diameter using the formula SR_BA_ = 4 · PSV_BA_/D BA, providing insights into endothelial shear stress during rest. The pulsatility index of BA (PI_BA_) was calculated as PI_BA_ = PSV_BA_ − EDV_BA_/V_av_, where: PSV_BA_ = peak systolic velocity, EDV_BA_ = end-diastolic velocity, and V_av_ = average velocity, calculated as V_av_ = PSV_BA_ + 2 · EDV_BA_/3.
The resistivity index of BA (RI_BA_) was derived from Doppler waveform analysis, reflecting vascular resistance and pulsatile flow dynamics (Natale et al., 2014), and calculated as RI_BA_ = PSV_BA_ − EDV_BA_/PSV_BA_. Additionally, the Reynolds number of BA (Re_BA_) was estimated to assess the nature of blood flow (anterograde or retrograde), considering the following formula: Re_BA_ = ρ · PSV_BA_ · D BA/μ, where ρ = blood density (1.06 g/cm^3^), PSV_BA_ = peak systolic velocity, D BA = brachial artery diameter, and μ = blood viscosity 0.035 g/(cm·s). These variables were selected to comprehensively evaluate D BA and flow characteristics in the left BA under resting conditions. The same vascular outcomes were measured in the central CCA in terms of diameter (D CCA) and fluxes (PSV_CCA_; EDV_CCA_, SR_CCA_, RI_CCA_, PI_CCA_, Re_CCA_).
The carotid intima–media thickness average (cIMT_av_) and maximum (cIMT_max:, defined as the maximum thickness within the cIMT_av measurement) were obtained from the CCA by an ultrasound imaging 7–12 MHz linear-array transducer (GE Medical Systems, Model LOGIQ-E PRO, Milwaukee, United States). After carotid bulb identification, an image was obtained in “B mode” in longitudinal orientation of the right CCA by an automatic ultrasound function that detects both cIMT_av_ and cIMT_max_ outcomes. The scan was focused 1 cm from the carotid bifurcation on the far wall. The ultrasound software recorded the image, and later, it was analyzed offline. All measurements were recorded at the end-diastolic stage (Coll and Feinstein, 2008). Given that the cIMT_av_ >0.9 mm has been used as a previous cut-off point to denote high cardiovascular risk, we used this value in our cIMT_max_ outcome, following the European Society of Hypertension and European Society of Cardiology recommendations (Mancia et al., 2013).
Blood pressure
2.4
Blood pressure was measured on three attempts with rest intervals of at least 1 min between measurements, using a digital cuff instrument positioned on the arm Omron™ (Model HEM-7142, United States). Blood pressure was categorized according to the criteria of the European Society of Cardiology into hypertension [systolic blood pressure (SBP) ≥140 or diastolic blood pressure (DBP) ≥90 mmHg], normal-high blood pressure (SBP 130–139 mmHg or DBP 85–89 mmHg), and normotensive (SBP ≤129 mmHg or DBP ≤84 mmHg) (Marx et al., 2023).
Physical fitness of the upper limb and lower limb
2.5
For HGS, measurements of both hands were used in three attempts in a seated position, and we used the HGS of the right (HGS_RA_: HGS right arm) and left arm (HGS_LA_: HGS left arm) as the upper limb physical fitness. Additionally, the average of HGS_RA_ plus HGS_LA_ [i.e., handgrip strength average (HGS_AV_)] was used as the upper limb marker in the associative analyses. These measurements were developed by using a digital handheld dynamometer (Jamar®, Plus+, Sammons Preston, Patterson Medical, Illinois, United States) following previous studies in Latin American populations (Santos et al., 2025).
For lower-limb physical fitness, we used the Ruffier–Dickson test to calculate the Ruffier index (RI) (Joussellin, 2007). The participants were instructed as follows: 1) the heart rate at rest was in (beats per minute) and registered as HR1, then the person stood up and 2) executed a squat exercise at a steady pace with the thighs straight at 90° of knee flexion, raising the arms forward while flexing for 45 s. Immediately after performing the 45-s squat exercise, 3) the heart rate was taken again and recorded as HR2, followed by a 1-min rest in a seated position, and 4) finally, the heart rate was recorded again as HR3. The results were then interpreted using the following formula: Ruffier index = [(HR1 + HR2 + HR3) − 200]/10, where the squat repetitions and heart rate values could be useful for estimating the CRF (data not shown).
Lifestyle patterns
2.6
The physical activity (PA) levels of the participants were determined with the Global Physical Activity Questionnaire (GPAQ v2) (WHO, 2009). From here, the min/week of vigorous (PA_VI_), moderate (PA_MI_), and light PA (PA_LI_) was determined and registered by each participant. The sedentary time per week was determined by self-reporting time spent on activities involving sitting or reclining during leisure time. To determine the smoking habit, the smoking surveillance instrument proposed by the Pan-American Health Organization was used. This instrument identified current smokers (daily and occasionally) and ex-smokers, allowing the assessment of the number of cigarettes smoked and the persistence of the habit, but in this study, we registered the data as non-smoker or smoker (Guatibonza-García et al., 2025).
Anthropometry (secondary outcomes)
2.7
Weight was measured with the BIA equipment InBody120™ scale (tetrapolar 8-point tactile electrode system, model BPM040S12F07, BioSpace, Inc., Seoul, Korea) with 0.1 kg precision following previous studies (Marfell-Jones et al., 2006). Height was measured with a SECA™ 213-Topmedic portable stadiometer (Germany). BMI was calculated using weight and height squared.
Body composition by dual-X-ray absorptiometry (secondary outcomes)
2.8
The participants visited the Universidad de Los Lagos Laboratory (Puerto Montt city, Chile) for the iDXA body composition evaluation from Monday to Friday between 9 a.m. and 1 p.m. to perform these procedures. Prior to the iDXA measurement (Healthcare General Electric Company, Encore 18 Software, United States), a preliminary interview was conducted to rule out the use of electronic devices such as pacemakers and insulin pumps, among others, that could interfere with the operation of the equipment or could affect the health of the participant. For the iDXA measurement, each subject was placed in a supine position on the equipment, wearing light clothing, without shoes or metal objects. All iDXA measurements were applied segmentally [i.e., body fat % arms (BF_Arms_), left arm (BF_LA_), right arm (BF_RA_), legs (BF_Legs_), right leg (BF_RL_), left leg (BF_LL_), and trunk (BF_Trunk_); fat-free mass g arms (FFM_Arms_), left arm (FFM_LA_), right arm (FFM_RA_), legs (FFM_Legs_), right leg (FFM_RL_), left leg (FFM_LL_), and trunk (FFM_Trunk_); and bone mineral content of arms (BMC_Arms_), left arm (BMC_LA_), right arm (BMC_RA_), legs (BMC_Legs_), right leg (BMC_RL_), left leg (BMC_LL_), and trunk (BMC_Trunk_)]; and in total parameters (i.e., total body fat % (Total BF), total fat-free mass (Total FFM), and total bone mineral content (Total BMC)). The evaluation process lasted approximately 10 min. Parts of the vascular, physical fitness, body composition, and equipment characteristics of the DF can be seen in Figure 2.
Vascular measurement (A), physical fitness Ruffier test (B), lifestyle patterns [Global Physical Activity Questionnaire (GPAG)] (C), body composition iDXA measurement (D), equipment characteristics (E), and georeferenced geographic area of the Carelmapu Port (Southern Chile), as the city of the diver fishing participants (F).
Statistical analysis
2.9
Data are shown as mean and (±) standard deviation. The Shapiro–Wilk test was applied to test the normal distribution of the main and secondary outcomes. For outcomes with normal distribution, the differences between groups were evaluated by paired or unpaired t-test at a P < 0.05 alpha error level. Additionally, Cohen’s d effect size was described. The chi-square test was applied at a P < 0.05 alpha level to assess frequencies of blood pressure categories. The Wilcoxon test was applied to those outcomes with no normal distribution. Multivariable regression (i.e., adjusted by age and MAP outcomes) was applied to test the association between vascular outcomes of the BA: D BA, SR_BA_, CCA, D CCA, and SR_CCA_, with upper (HGS_AV_) and lower-limb physical fitness (Ruffier test repetitions). The analyses were performed using GraphPad Prism version 8.0 statistical software (Chicago, Illinois, United States).
Results
3
General and brachial artery characteristics
3.1
Comparing the MA-DF vs. OA-DF groups, there were significant differences in characteristics of age (48.0 ± 8.5 years vs. 66.0 ± 5.9 years, p = 0.0006), systolic (138.2 ± 6.0 mmHg vs. 150.1 ± 16.3 mmHg, p = 0.043), and mean arterial pressure (103.9 ± 6.2 mmHg vs. 111.8 ± 9.6 mmHg, p = 0.039) (Table 1). No other differences were detected in the general characteristics of the sample (Table 1).
In the BA, comparing MA-DF vs. OA-DF, the D BA (p = 0.197) (Figure 3A), PSV_BA_ (p = 0.585) (Figure 3B), EDV_BA_ (p = 0.997) (Figure 3C), SR_BA_ (p = 0.101) (Figure 3D), RI_BA_ (p = 0.730) (Figure 3E), PI_BA_ (p = 0.398) (Figure 3F), and Re_BA_ (p = 0.796) (Figure 3G) showed no significant differences between groups.
Brachial artery diameter (D BA) (A), peak systolic velocity (PSVBA) (B), end-diastolic velocity (EDVBA) (C), shear rate (SRBA) (D), resistance index (RIBA) (E), pulsatility index (PIBA) (F), and Reynolds number (ReBA) (G) in diver fishermen of the southern Chilean Coast dedicated to mollusk harvesting. Groups are described as middle-aged diver fishermen (MA-DF) and older adult diver fishermen (OA-DF). (#) Analyzed by the unpaired t-test at p < 0.05. (d) Cohen’s d effect size at p < 0.05.
Common carotid artery characteristics
3.2
In the CCA, comparing MA-DF vs. OA-DF, the D CCA (p = 0.135) (Figure 4A), PSV_CCA_ (p = 0.773) (Figure 4B), EDV_CCA_ (p = 0.559) (Figure 4C), SR_CAA_ (p = 0.110) (Figure 4D), RI_BA_ (p = 0.162) (Figure 4E), PI_CCA_ (p = 0.636) (Figure 4F), and Re_CCA_ (p = 0.951) (Figure 4G) showed no significant differences.
Common carotid artery diameter (D CCA) (A), peak systolic velocity (PSVCCA) (B), end-diastolic velocity (EDVCCA) (C), shear rate (SRCCA) (D), resistance index (RICCA) (E), pulsatility index (PICCA) (F), and Reynolds number (ReCCA) (G) in diver fishermen of the southern Chilean Coast dedicated to mollusk harvesting. Groups are described as middle-aged diver fishermen (MA-DF) and older adult diver fishermen (OA-DF). (#) Analyzed by an unpaired t-test at P < 0.05. (d) Cohen’s d effect size at p < 0.05.
Arterial stiffness, intima–media thickness, and covariates characteristics
3.3
Comparing MA-DF vs. OA-DF, the PWV (p = 0.596) (Figure 5A), cIMT_av_ (p = 0.750) (Figure 5B), cIMT_max_ (p = 0.833) (Figure 5C), ABI (p = 0.783) (Figure 5D), and AIx_BA_ (p = 0.160) (Figure 5E) showed no significant differences between groups.
Pulse wave velocity (PWV) (A), carotid intima–media thickness average (cIMTav) (B), carotid intima–media thickness maximum (cIMTmax) (C), ankle-brachial index (ABI) (D), and augmentation index of the brachial artery (AIxBA) (E) of the common carotid artery in diver fishermen of the southern Chilean Coast dedicated to mollusk harvesting. Groups are described as middle-aged diver fishermen (MA-DF) and older adult diver fishermen (OA-DF). (#) Analyzed by the unpaired t-test at p < 0.05. (d) Cohen’s d effect size at p < 0.05.
Physical fitness characteristics
3.4
Comparing MA-DF vs. OA-DF, there were significant differences in outcomes HGS_RA_ (48.1 ± 6.2 kg vs. 39.8 ± 6.4 kg, p = 0.029, d = 0.27) (Figure 6A), HGS_LA_ (46.7 ± 5.9 kg vs. 39.5 ± 6.3 kg, p = 0.042, d = 0.24) (Figure 6B), and in the Ruffier test repetitions performed in the 45 s squat exercise Ruffier test (23.2 ± 5.3 repetitions vs. 15.5 ± 2.4 repetitions, p = 0.0006) (Figure 6C).
Handgrip strength right arm (A), handgrip strength left arm (B), and Ruffier test of 45 s “squat” exercise (C) in diver fishermen of the southern Chilean Coast dedicated to mollusk harvesting. Groups are described as middle-aged diver fishermen (MA-DF) and older adult diver fishermen (OA-DF). () denotes significant differences by unpaired t-test at p < 0.05. (**) denotes significant differences by unpaired t-test at p < 0.001. (d) Cohen’s d effect size at p < 0.05.*
Lifestyle characteristics
3.5
Comparing MA-DF vs. OA-DF, the vigorous PA_VI_ (p = 0.702) (Figure 7A), moderate PA_MI_ (p = 0.933) (Figure 7B), light physical activity PA_LI_ (p = 0.319) (Figure 7C), total physical activity (p = 0.873) (Figure 7D), and sedentary behavior per week (p = 0.988) (Figure 7E) showed no significant differences between groups.
Physical activity of vigorous (A), moderate (B), and light intensity (C), total physical activity (D), and sedentary behavior (E) in diver fishermen of the southern Chilean Coast dedicated to mollusk harvesting. Groups are described as middle-aged diver fishermen (MA-DF) and older adult diver fishermen (OA-DF). (d) Cohen’s d effect size at p < 0.05.
Body fat characteristics
3.6
Comparing MA-DF vs. OA-DF, the % body fat in arms BF_Arms_ (p = 0.266) (Figure 8A), % body fat of the left arm BF_LA_ (p = 0.294) (Figure 8B), body fat of the right arm BF_RA_ (p = 0.252) (Figure 8C), % body fat legs BF_Legs_ (p = 0.153) (Figure 8D), % body fat right leg BF_RL_ (p = 0.101) (Figure 8E), % body fat left leg BF_LL_ (p = 0.232) (Figure 8F), % body fat trunk BF_T_ (p = 0.452) (Figure 8G), and total body fat % Total BF (p = 0.313) (Figure 8H) showed numerically higher values in the MA-DF group but were non-significant differences (p > 0.05).
Body fat of the arms (A), body fat of the right arm (B), body fat of the left arm (C), body fat of the legs (D), body fat of the right leg (E), body fat of the left leg (F), body fat of the trunk (G), and total body fat % (H) in diver fishermen of the southern Chilean Coast dedicated to mollusk harvesting. Groups are described as middle-aged diver fishermen (MA-DF) and older adult diver fishermen (OA-DF).
Fat-free mass characteristics
3.7
There were no significantly different (p > 0.05) when comparing MA-DF vs. OA-DF groups in terms of fat-free mass in arms FFM_A_ (p = 0.086) (Figure 9A), fat-free mass in right arm FFM_RA_ (p = 0.108) (Figure 9B), fat-free mass in left arm FFM_LA_ (p = 0.097) (Figure 9C), fat-free mass legs FFM_L_ (p = 0.104) (Figure 9D), fat-free mass right leg FFM_RL_ (p = 0.078) (Figure 9E), fat-free mass left leg FFM_LL_ (p = 0.153) (Figure 9F), fat-free mass trunk FFM_T_ (p = 0.182) (Figure 9G), and total fat-free mass Total FFM (p = 0.088) (Figure 9H).
Fat-free mass of the arms (A), fat-free mass of the right arm (B), fat-free mass of the left arm (C), fat-free mass of the legs (D), fat-free mass of the right leg (E), fat-free mass of the left leg (F), fat-free mass of the trunk (G), and total fat-free mass (H) in diver fishermen of the southern Chilean Coast dedicated to mollusk harvesting. Groups are described as middle-aged diver fishermen (MA-DF) and older adult diver fishermen (OA-DF). (d) Cohen’s d effect size at p < 0.05.
Bone mineral content characteristics
3.8
Comparing MA-DF vs. OA-DF, the bone mineral content in arms BMC_Arms_ (p = 0.556) (Figure 10A), bone mineral content in right arm BMC_RA_ (p = 0.873) (Figure 10B), bone mineral content in left arm BMC_LA_ (p = 0.563) (Figure 10C), bone mineral content legs BMC_Legs_ (p = 0.891) (Figure 10D), bone mineral content right leg BMC_RL_ (p = 0.921) (Figure 10E), bone mineral content left leg BMC_LL_ (p = 0.722) (Figure 10F), bone mineral content trunk BMC_T_ (p = 0.970) (Figure 10G), and total bone mineral content Total BMC (P = 0.975) (Figure 10H) showed no significant differences between groups (p > 0.05).
Bone mineral content (BMC) of the arms (A), BMC of the right arm (B), BMC of the left arm (C), BMC of the legs (D), BMC of the right leg (E), BMC of the left leg (F), BMC of the trunk (G), and total BMC (H) in diver fishermen of the southern Chilean Coast dedicated to mollusk harvesting. Groups are described as middle-aged diver fishermen (MA-DF) and older adult diver fishermen (OA-DF).
Segmental body composition differences between groups
3.9
The segmental differences in body composition comparing MA-DF vs. OA-DF in outcomes diff. BF_Arms_ (p = 0.967) (Figure 11A), diff. BF_Legs_ (p = 0.393) (Figure 11B), diff. BMC_Arms_ (p = 0.988) (Figure 11C), diff. BMC_Legs_ (p = 0.088) (Figure 11D), FFM_Arms_ (p = 0.395), and FFM_Legs_ (p = 0.173) showed no significant differences between groups (p > 0.05).
Differences (diff) between the body fat % of the arms (A), diff. of the legs (B), diff. of the bone mineral content (BMC) of the arms (C), diff. of the BMC of the legs (D), diff. of the fat-free mass [FFM] of the arms (E), and diff. of the FFM of the legs (F) in diver fishermen of the southern Chilean Coast dedicated to mollusk harvesting. Groups are described as middle-aged diver fishermen (MA-DF) and older adult diver fishermen (OA-DF).
Association between physical fitness and blood flow characteristics
3.10
For the BA structure, no significant associations were observed between D BA and age, MAP, HGS_AV_, or Ruffier test performance (all p > 0.05). Regarding BA function, Ruffier test performance showed a strong and significant positive association with SR_BA_ (B = 88.7 s^−1^ per repetition, p = 0.003, 95%CI: 35.8; 141.9), whereas age, MAP, and HGS_AV_ were not significantly associated with SR_BA_ (all p > 0.05). For the CCA structure, D CCA was not significantly associated with age, MAP, HGS_AV_, or Ruffier test performance (all p > 0.05) (Table 2). In terms of CCA function, Ruffier test performance was significantly and positively associated with SR_CCA_ (B = 38.7 s^−1^ per repetition, p = 0.042, 95%CI: 1.5; 75.8). No significant associations were found between SR_CCA_ and age, MAP, or HGS_AV_ (Table 2).
Discussion
4
The primary aim of the present study was to describe the vascular, physical fitness, lifestyle, and body composition characteristics of middle-aged and older adult diver fishermen. The second aim was to associate vascular outcomes with the physical fitness of the upper and lower limbs. Thus, the present study has three main results: i) middle-aged and older adult DF show similar vascular (functional and structural), lifestyle, and body composition characteristics; ii) significant differences in upper- and lower-limb physical fitness favored the middle-aged DF; and iii) a significant association was found between the vascular parameters of function SR_BA_, and SR_CCA_ with lower-limb physical fitness (i.e., by the Ruffier test repetitions) (Table 2). Overall, the present results suggest that lower-limb physical fitness evaluated using the Ruffier test is independently associated with peripheral (SR_BA_) and central vascular outcomes of function (SR_CCA_), whereas no association was observed with arterial structural variables of diameters, after controlling for relevant confounders. These findings suggest that enhanced lower-limb functional capacity is positively associated with more favorable flow dynamics and vascular health in peripheral (i.e., BA) and central (i.e., CCA) arteries in DF (Table 2), which may help inform and support the development of specific lifestyle strategies to promote adequate physical fitness in active divers.
About our first result, the observation that the BA (D BA, PSV_BA_, EDV_BA_, SR_BA_, RI_BA_, PI_BA_, and Re_BA_) (Figure 3), carotid (D CCA, PSV_CCA_, EDV_CCA_, SR_CCA_, RI_CCA_, PI_CCA_, and Re_CCA_) (Figure 4), and PWV, cIMT_av_, cIMT_max_, ABI, AIx_BA_ vascular parameters did not differ significantly between middle-aged and older adult DF could suggest a preserved vascular health in this occupational group, despite almost ∼20 years of chronological age difference. Worryingly, the similarity in PWV in both MA-DF and OA-DF was higher than 10 m·s^−1^, which denotes a high CVD risk in both MA-DF and OA-DF groups (Figure 5A). At the same time, cIMT_av_ was apparently exceeded in SD in some participants, as shown in Figure 5B. Thus, independent of biological aging, both MA-DF and OA-DF may need additional PA/exercise practice and to improve their lifestyle conditions (i.e., PA patterns) to decrease arterial stiffness and CVD risk, as has been shown in previous studies (Vogel et al., 2013; Alvarez et al., 2024). Vogel et al. reported that 9 weeks of intermittent endurance exercise training in healthy adults decreased PWV by −0.6 m·s^−1^. We previously reported that 6 weeks of exercise training decreased PWV by −1.2 m·s^−1^ in hypertensive subjects under additional obesity conditions (Alvarez et al., 2024). Thus, these early vascular risks in MA-DF and OA-DF could be potentially treated with lifestyle interventions.
About our second result, the analysis of physical fitness outcomes revealed significantly greater HGS_RA_ and HGS_LA_ and a higher number of repetitions during the Ruffier squat test in the middle-aged group (Figure 6). These differences likely reflect age-related declines in muscular strength (i.e., upper limb) and functional capacity (i.e., lower limb), consistent with prior findings in aging populations. However, it is notable that these older adult divers stay physically active and keep moderate to high physical activity levels, which may mitigate some functional losses. Thus, we presume that despite no lifestyle differences between MA-DF vs. OA-DF in lifestyle PA_VI_, PA_MI_, PA_LI_, it is important to promote more structured and specific PA and exercise regimes, such as resistance training including external weights, in these populations of active occupational activity during older adulthood to promote an increase in skeletal muscle mass and thus avoid some early symptoms of chronological aging. For example, Cavani et al. (2002) reported that after 6 weeks of resistance training plus stretching exercise (3 sessions/week, older adult participants (∼70 years) improved their performance during the Ruffier test. A systematic review and meta-analysis of Radaelli et al. (2025) with 151 randomized trials summarized that short (i.e., ≤20 weeks) and middle-term resistance training programs (i.e., ≥20 weeks) can significantly increase muscle size in older adults. Another recent systematic review from Khaleghi et al. (2025) summarizing different water sports reported that short interventions (i.e., including swimming and diving) of ∼14 days show potential for cardiovascular health by improving body composition and physical fitness.
Our third key finding of this study was the significant association between flow parameters of vascular function (SR_BA_ and SR_CCA_) with the Ruffier test repetitions (Table 2). These associations suggest a strong link between dynamic muscular activity of the lower limbs with peripheral and central arterial hemodynamics, reinforcing the concept that physical fitness, evaluated from a large muscle mass in the form of a lower-limb squat exercise, can modulate vascular function even in older adult individuals. Jun et al. (2021) reported recently in a sample of n = 5,401 followed for 2 years that the lowest skeletal muscle mass index quartile [calculated by: total appendicular muscle mass (kg)/body weight (kg) × 100] was significantly associated with the presence of increased risk of coronary artery calcification in adults ∼50 years old. In contrast, upper limb strength, assessed by HGS_AV_, was not associated with vascular parameters in either BA or CCA (Table 2). This may indicate that the type of muscular activity represented by handgrip strength could not sufficiently stimulate vascular adaptations, or that its effects on vascular blood fluxes and hemodynamics are less systemic than those induced by lower-limb endurance activities that involve greater skeletal muscle mass.
Secondary outcomes, such as lifestyle (PA_VI_, PA_MI_, PA_LI_, sedentary time/wk), body composition (BF_Arms_, BF_RA_, BF_LA_, BF_Legs_, BF_RL_, BF_LL_, BF_Trunk_, Total BF; FFM_Arms_, FFM_RA_, FFM_LA_, FFM_Legs_, FFM_RL_, FFM_LL_, FFM_Trunk_, Total FFM; and BMC_Arms_, BMC_RA_, BMC_LA_, BMC_Legs_, BMC_RL_, BMC_LL_, BMC_Trunk_, and Total BMC), were similar between groups. This suggests that observed differences in vascular health are unlikely to be driven by these variables and further emphasizes the role of physical fitness in influencing vascular dynamics. On the other hand, despite our precision iDXA body composition measurements and no significant statistical differences between groups, there was a trend that BF% was higher (Figure 8), but FFM and BMC outcomes were slightly lower in OA-DF than MA-DF (Figures 9, 10). However, considering the active diving condition of the OA-DF group, it is also relevant to promote more specific lifestyle strategies in this group. Examples include reinforcing adherence to the international physical activity guidelines or specific strength training for maintenance of the FFM, muscle mass, and BMC to avoid potential frailty conditions and also to decrease body fat content to reduce the risk for CVD. Interestingly, when we compared the MA-DF and OA-DF groups in terms of the segmental arms or legs analysis, the BMC_Legs_ outcome was almost a significant difference (diff.) between the groups (p = 0.088, Figure 11), meaning that older adult DF are at more risk for experiencing balanced bone demineralization between legs with potential consequences to functional capacity and locomotion. From here, we presume that the nature of our pilot study in terms of low sample size can be further clarified in future descriptive or cross-sectional studies with more robust samples.
Overall, these results highlight the importance of maintaining lower-limb physical fitness (i.e., particularly functional capacity) in older-age occupational groups of major longevity like DF, who need more lifestyle interventions to support both vascular and musculoskeletal health. Recently, the Chilean Superintendence of Social Security reported that 36% of DF report a smoking habit, ∼4–5% report bone fractures as the most common type of accident, and 86.7% show overweight/obesity. These findings increase the need for more robust studies (SUSESO, 2020). The predictive associations between Ruffier test “squat” performance and the vascular outcome SR underscore its potential utility as a practical screening tool in aging DF workers exposed to unique physical environments in the waters of the Chilean coast.
Limitations and strengths
4.1
This study has several limitations. First, the sample size was small, and participants were recruited voluntarily, which may limit generalizability. Second, heart rate during the Ruffier test was measured manually, which could introduce variability. Third, potential environmental factors such as seasonal diving patterns and water temperature were not considered. Fourth, the seasons with longer or shorter frequency of diving periods were not quantified. Fifth, as with any study of an associative nature, these findings do not imply a cause–effect relationship; therefore, future studies with greater methodological complexity are needed to corroborate these preliminary results. Sixth, future applications of the Ruffier test should consider using a heart rate monitor to record this parameter more objectively. Despite these limitations, the study also has notable strengths, including i) it focused on a difficult-to-reach occupational population; ii) it employed gold-standard iDXA for body composition analysis; iii) it includes individuals across a wide range of chronological ages, providing a more comprehensive characterization of the physiological traits of this population, which typically remains active in this occupational context well into advanced age; iv) it provided novel insights into the relationship between physical fitness and vascular parameters in aging divers; v) all the measurements taken are part of a preventive plan with social authorities, which will allow future health promotion coordination to be proposed from the research team.
Conclusion
5
Despite similar vascular, lifestyle, and body composition profiles, middle-aged and older diver fishermen displayed marked differences in upper- and lower-limb physical fitness. Importantly, lower-limb physical fitness, as assessed by the Ruffier test, emerged as a robust correlate of vascular SR in both the BA and CCA, highlighting its potential relevance to peripheral and central vascular function.
The reference list from the paper itself. Each links out to its DOI / PubMed record.
- 1Alahmari K. A. Rengaramanujam K. Reddy R. S. Samuel P. S. Kakaraparthi V. N. Ahmad I. (2020). Cardiorespiratory fitness as a correlate of cardiovascular, anthropometric, and physical risk factors: using the ruffier test as a template. Can. Respir. J. 2020 (1), 3407345. 10.1155/2020/3407345 32963643 PMC 7495241 · doi ↗ · pubmed ↗
- 2Armada de Chile (2014). Reglamento de Buceo para Buzos Profesionales (TM-035). Valparaíso: Dirección General del Territorio Marítimo y de Marina Mercante. Available online at: https://www.directemar.cl/directemar/site/docs/20170308/20170308093133/tm_035.pdf?utm_source=chatgpt.com.
- 3Álvarez C. Peñailillo L. Saavedra P. I. Roa M. T. Mayorga D. A. J. Domaradski J. (2024). Exercise training is effective for arterial stiffness and blood pressure rehabilitation in hypertensive adults. Retos nuevas tendencias Educ. física, deporte recreación (56), 301–311. 10.47197/retos.v 56.104740 · doi ↗
- 4Alvarez C. Peñailillo L. Ibacache-Saavedra P. Jerez-Mayorga D. Campos-Jara C. Andrade D. C. (2024). Six weeks of a concurrent training therapy improves endothelial function and arterial stiffness in hypertensive adults with minimum non-responders. Hipertens. Y Riesgo Vasc. 41 (4), 240–250. 10.1016/j.hipert.2024.07.001 39079872 · doi ↗ · pubmed ↗
- 5Bevier W. C. Wiswell R. A. Pyka G. Kozak K. C. Newhall K. M. Marcus R. (1989). Relationship of body composition, muscle strength, and aerobic capacity to bone mineral density in older men and women. J. Bone Mineral Res. 4 (3), 421–432. 10.1002/jbmr.5650040318 2763878 · doi ↗ · pubmed ↗
- 6Bove A. A. (2014). Diving medicine. Am. Journal Respiratory Critical Care Medicine 189 (12), 1479–1486. 10.1164/rccm.201309-1662 CI 24869752 · doi ↗ · pubmed ↗
- 7Cavani V. Mier C. M. Musto A. A. Tummers N. (2002). Effects of a 6-Week resistance-training program on functional fitness of older adults. J. Aging Phys. Activity 10 (4), 443–452. 10.1123/japa.10.4.443 · doi ↗
- 8Coll B. Feinstein S. B. (2008). Carotid intima-media thickness measurements: techniques and clinical relevance. Curr. Atherosclerosis Reports 10 (5), 444–450. 10.1007/s 11883-008-0068-1 18706287 · doi ↗ · pubmed ↗