Cost-effectiveness of microprocessor-controlled prosthetic knees in the Dutch healthcare system: The impact of study duration on outcomes
A Kuhlmann, A Kannenberg

TL;DR
This study shows that using a longer time frame significantly improves the cost-effectiveness estimate of microprocessor-controlled prosthetic knees in the Netherlands.
Contribution
The study demonstrates the importance of using the correct time horizon in health-economic analyses to avoid misleading results.
Findings
The ICUR dropped from €457,063 to €17,945 per QALY when using a 6-year time horizon.
MPKs were found cost-effective in the Netherlands when analyzed over a longer timeframe.
The ICUR fell below the €50,000-per-QALY threshold after 4-5 years of use.
Abstract
A previous health-utility analysis of microprocessor-controlled prosthetic knees (MPKs) in the Netherlands used a very short evaluation period of only 6 months resulting in an extremely high incremental cost-utility ratio (ICUR) of €457,063 per quality-adjusted life year (QALY) gained. However, for proper health-economic analyses, an appropriate time horizon, usually the useful life of an intervention, must be chosen to avoid biased results. Therefore, we performed a basic cost-utility analysis (CUA) extrapolating and properly discounting the utility and cost data reported by that article over the useful lifetime of MPKs of 6 years and found an ICUR of €17,945 per QALY. To further refine the CUA, we conducted a modeling study of the ICUR of the MPKs over a timeframe from 6 months to 25 years using existing and published population models for Germany and Sweden. In the modeling study,…
Genes, proteins, chemicals, diseases, species, mutations and cell lines named across the full text — each resolved to its canonical identifier and authoritative record.
Click any figure to enlarge with its caption.
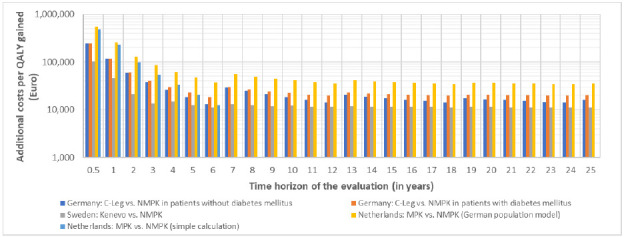 Figure 1
| NMPK group | MPK group | Difference | |
|---|---|---|---|
| EQ-5D-5L utility | 0.742 (n | 0.787 (n=60) | 0.045 |
| QALYs in 6 months | 0.37 (n=46) | 0.40 (n=55) | 0.032 |
| 6-month cost excluding prosthesis | €4,981 (n=42) | €3,909 (n=55) | −€1,072 |
| 6-month cost including prosthesis | €9,395 (n=42) | €24,927 (n=55) | €15,532 |
| One-time prosthesis cost | €4,417 (n=42) | €21,018 | €16,601 |
| 6-month Incremental cost-utility ratio (ICUR) | €457,063 per QALY | ||
| Applicable willingness-to-pay threshold for the Netherlands | €50,000 per QALY |
| Parameter | Parameter values | Source / comment | |||||
|---|---|---|---|---|---|---|---|
|
|
|
|
| ||||
|
| German | German | Swedish | German | |||
|
| C-Leg | C-Leg | Kenevo | not reported | Germany: Kuhlmann et al. 2020. | ||
|
| Without DM | With DM | all | With DM | |||
|
| 40-49y | 6.3% | 5.8% |
| 5.8% | Germany: Kuhlmann et al. 2020. | |
| 50-59y | 18.7% | 17.7% | - | 17.7% | |||
| 60-69y (65-74y) | 32.9% | 31.9% | 32.8% | 31.9% | |||
| 70-79y (75-84y) | 24.0% | 24.4% | 39.8% | 24.4% | |||
| 80+y (85+y) | 18.1% | 20.2% | 27.4% | 20.2% | |||
|
| 40-49y: 28.0 | 40-49y: 13.6 | - | 40-49y: 13.6 | Germany: Kuhlmann et al. 2020. | ||
| 50-59y: 20.0 | 50-59y: 9.1 | - | 50-59y: 9.1 | ||||
| 60-69y: 13.1 | 60-69y: 6.0 | 65-74y: 4.3 | 60-69y: 6.0 | ||||
| 70-79y: 7.8 | 70-79y: 3.6 | 75-84y: 3.3 | 70-79y: 3.6 | ||||
| 80+y: 4.5 | 80+y: 2.1 | 85+y: 2.2 | 80+y: 2.1 | ||||
|
| Annual utility gain of MPK compared with NMPK | <55y | 0.119 | - | 0.064 | Germany: Cutti et al. 2017. | |
| 55-64y | 0.082 | - | |||||
| 65+y | 0.078 | 0.078 | |||||
| Additional disutility for fall-related medical events | Hospitalization, outpatient treatment, fatal falls | Hospitalization, outpatient treatment, fatal falls | Not included | Germany: Kuhlmann et al. 2020. | |||
|
| Price (Euro) | NMPKs | 10,862 | 1,268 | 4,417 | Germany: Kuhlmann et al. 2020. | |
| MPKs | 29,645 | 8,937+4,283 | 21,018 | ||||
| Average life cycle (years) | NMPKs | 3.5 | 2 | 3.5 | |||
| MPKs | 6 | 3+3 | 6 | ||||
|
| Cost perspective | Payer | Payer | Societal | |||
| Annual cost savings of MPKs compared with NMPKs (Euro) | Difference in costs of fall-related medical events | Difference in costs of fall-related medical events | 2,144 | Germany, Sweden: Calculated by the model Netherlands: Bosman et al. 2025. | |||
|
| Health outcomes | 3% | 3% | 1.5% | Germany: IQWiG 2025. | ||
| Costs | 3% | 3% | 3% | ||||
| Price year | 2019 | 2019 | 2023 | Germany: Kuhlmann et al. 2020. | |||
| Year | Difference in QALY | Difference in cost | Comments |
|---|---|---|---|
| Year 1 | 0.045 | €14,460 | Difference in utility X 1 year; Difference in 6-month cost including prosthesis (€15,532) + Difference in 6-month cost excluding prosthesis (−€1,072). |
| Year 2 | 0.0443 | −€2,080 | Difference in utility in year 1 discounted by 1.5%; 2 X 6-month cost excluding prosthesis in year 1 (−€2,144) discounted by 3%. |
| Year 3 | 0.0437 | −€2,017 | Difference in utility in year 2 discounted by 1.5%; 2 X 6-month cost excluding prosthesis in year 2 (−€2,080) discounted by 3%. |
| Year 4 | 0.0430 | −€1,957 | Difference in utility in year 3 discounted by 1.5%; 2 X 6-month cost excluding prosthesis in year 3 (−€2,017) discounted by 3%. |
| Year 5 | 0.0424 | −€1,898 | Difference in utility in year 4 discounted by 1.5%; 2 X 6-month cost excluding prosthesis in year 4 (−€1,957) discounted by 3%. |
| Year 6 | 0.0417 | −€1,841 | Difference in utility in year 5 discounted by 1.5%; 2 X 6-month cost excluding prosthesis in year 5 (−€1,898) discounted by 3%. |
|
|
|
|
|
| Year | Difference in QALY | Difference in cost | Comments |
|---|---|---|---|
| 6-month | 0.032 | ||
| Year 1 | 0.064 | €14,460 | Difference in utility for 6 months X 2; Difference in 6-month cost including prosthesis (€15,532) + Difference in 6-month cost excluding prosthesis (−€1,072). |
| Year 2 | 0.063 | −€2,080 | Difference in utility in year 1 discounted by 1.5%; 2 X 6-month cost excluding prosthesis in year 1 (- €2,144) discounted by 3%. |
| Year 3 | 0.062 | −€2,017 | Difference in utility in year 2 discounted by 1.5%; 2 X 6-month cost excluding prosthesis in year 2 (- €2,080) discounted by 3%. |
| Year 4 | 0.061 | −€1,957 | Difference in utility in year 3 discounted by 1.5%; 2 X 6-month cost excluding prosthesis in year 3 (- €2,017) discounted by 3%. |
| Year 5 | 0.060 | −€1,898 | Difference in utility in year 4 discounted by 1.5%; 2 X 6-month cost excluding prosthesis in year 4 (- €1,957) discounted by 3%. |
| Year 6 | 0.059 | −€1,841 | Difference in utility in year 5 discounted by 1.5%; 2 X 6-month cost excluding prosthesis in year 5 (- €1,898) discounted by 3%. |
|
|
|
|
|
| Time frame | Accrued utility (QALYs) | Accrued cost (€) | ICUR (€ per QALY) |
|---|---|---|---|
| Year 1 | 0.045 | 14,460 | 321,333 |
| Year 2 | 0.089 | 12,380 | 138,599 |
| Year 3 | 0.133 | 10,363 | 77,926 |
| Year 4 | 0.176 | 8,406 | 47,765 |
| Year 5 | 0.218 | 6,508 | 29,806 |
| Year 6 | 0.260 | 4,667 | 17,945 |
| Time frame | Accrued utility (QALYs) | Accrued cost (€) | ICUR (€ per QALY) |
|---|---|---|---|
| 6 months | 0.032 | 14,626 | 457,063 |
| Year 1 | 0.064 | 14,460 | 225,938 |
| Year 2 | 0.127 | 12,380 | 97,452 |
| Year 3 | 0.189 | 10,363 | 54,792 |
| Year 4 | 0.250 | 8,406 | 33,585 |
| Year 5 | 0.310 | 6,508 | 20,957 |
| Year 6 | 0.369 | 4,667 | 12,618 |
Peer Reviews
No public reviews on file for this paper yet. If you reviewed it on a platform where reviews are public (OpenReview, ICLR, NeurIPS, ICML), you can paste yours below so the community can read it here.
Videos
No videos yet. Explain this paper in a talk, walkthrough, or lecture? Add one.
Taxonomy
TopicsProsthetics and Rehabilitation Robotics · Total Knee Arthroplasty Outcomes · Muscle activation and electromyography studies
INTRODUCTION
In times of aging populations and rapid advancements in medical technologies, health-economic analyses are crucial for evaluating the value for money of healthcare interventions and supporting optimal resource allocation. A recent study of Bosman et al.,^1^ published in the Canadian Prosthetic and Orthotic Journal, and their response to a letter to the editor criticizing its methodology^2,3^ has questioned the health-economic value of microprocessor-controlled prosthetic knees (MPK) for individuals with unilateral above-knee amputations under the conditions of the healthcare system in the Netherlands. Though the effort and most of the methodology is commendable, the authors chose to select an extremely short evaluation period of only 6 months, while the useful lifetime and replacement cycle of MPKs in the Netherlands is 6 years. As the useful lifetime of an intervention or device is a crucial parameter that interacts directly with the evaluation process, the longevity of a medical device or the durability of an intervention's effect determines the time horizon over which costs and benefits accrue.
According to good practice recommendations^4^ and the new national Dutch guideline for health-economic evaluations,^5^ the time horizon must be long enough to capture the difference between all costs and effects associated with the intervention. Hence, for interventions with long-lasting effects, a longer time horizon is necessary to capture all relevant costs, benefits, and consequences. Ultimately, accurately defining the useful lifetime and applying suitable discount rates for future benefits and cost along with sensitivity analyses to test the robustness of results against different rates is essential for a reliable health-economic evaluation. These methods ensure that decision-makers have a comprehensive understanding of the long-term value and resource implications of an intervention or device, balancing immediate investments against future health gains and cost or savings.^6–9^
A critical and often complex aspect of these evaluations is the necessity to extrapolate short-term clinical trial data, typically gathered over 6 or 12 months, to longer time horizons. This is necessary because the long-term impact of a treatment on costs, survival, and quality of life can often not be fully observed within the limited duration of a trial.^10,11^
Bosman et al.^1^ chose a 6-month evaluation period to avoid a recall bias for data collection beyond 6 months in the past and did not extrapolate the data into the future. Criticized for this methodology,^2^ they argue that any “proposed corrections to our ICUR [incremental cost-utility ratio] are based on assumptions beyond our dataset; they illustrate the sensitivity of ICUR to prosthesis life-cycle assumptions”.^3^ However, evaluating the health-economic value of any advanced medical intervention over such short period of time would probably result in most non-life-saving interventions being considered not cost-effective. For example, a study evaluated the health-economic value of a total knee replacement (TKA) over an average timeframe of 11 years (deducted from the data reported) in a Medicare population with an average age of 74 years (range 68-70 years) and found an incremental cost-utility ratio (ICUR) of the TKA of US18,300 per QALY.^[12](#R12)^ However, shortening the evaluation window to 1/12 of that reasonable timeframe as done by Bosman et al.^[1](#R1)^ would have inflated the ICUR to US155,756 per QALY in 11 months. Contrary to the claim of Bosman et al. that assumptions were beyond their dataset,^3^ extrapolation of utility and cost data into the future is an established and accepted method of health-economic analyses,^8,9^ In fact, we are not aware of any health-economic analysis that collected utility and cost data over the entire evaluation period. Nevertheless, Bosman et al.^1^ could have inaugurated an innovative way of approaching health-economic analyses by answering the legitimate research question: After what duration of use are MPKs cost-effective, if any? However, this question was not addressed in their analysis. Therefore, this professional opinion article attempts to answer this question using their reported data.
METHODOLOGY
Basic Cost-Utility Analysis
Based on the data of Bosman et al.,^1^ we performed a “basic” cost-utility analysis of the MPKs with extrapolation and discounting over a period of 6 years, the typical useful lifetime and replacement cycle of MPKs in the Netherlands. In this basic analysis, we did not consider mortality or sensitivity of data variation as factors. The base data was extrapolated from 6 months to a full year for year 1 and then for years 2 to 6 with two scenarios:
In scenario 1, we chose the originally reported utility difference of 0.045 in favor of the MPKs as the basis. We multiplied the utility difference of 0.045 with 1 year resulting in 0.045 QALY gained by the MPKs in year 1.In scenario 2 we chose the reported 6-month QALY difference after bootstrapping of 0.032 QALY in favor of the MPKs as the basis. We multiplied the 6-month QALY difference of 0.032 QALY by 2 resulting in 0.064 QALY gained by MPK use in year 1.
For years 2-6, the utility/QALY gained in year 1 was discounted by 1.5% per year using the official Dutch guideline.^5^ Discounting is a core principle in health-economic analyses as it makes future costs, benefits, and health outcomes comparable to those occurring in the present. This process acknowledges the “time value of money” and reflects that people generally prefer benefits sooner rather than later (time preference). More fundamentally, discounting accounts for the opportunity cost of capital: resources invested in a public health program could otherwise be invested in the market or other sectors, where they would accrue interest and yield a return over time.^6–9^ Costs were determined the same way for both scenarios. For year 1, the 6-month total cost including the prosthesis and the 6-month total cost excluding the prosthesis were added. For years 2-6, the 6-month total cost excluding the prosthesis was doubled. According to the official Dutch Guideline,^5^ future costs were discounted by 3% per year.
In addition to the full 6-year cost-utility analysis, we also performed an annual sensitivity analysis for both scenarios by calculating the ICUR for each year of the useful lifetime of an MPK of 6 years.
Comparative Modelling Analysis
For the comparative modelling analysis, we used existing and published German and Swedish health economic (HE) models^13,14^ as well as the basic calculation approach to investigate the impact of the time horizon and differences in input data on the results of the evaluation.
1. Germany: We used a German HE model and reported base-case parameter values to estimate the cost-utility of the C-Leg vs non-microprocessor-controlled prosthetic knees (NMPKs) in prosthesis users with diabetes mellitus (DM) and users without DM.^13^
2. Sweden: We used a Swedish HE model and reported base-case parameter values to estimate the cost-utility of the KENEVO vs NMPKs in prosthesis users (all etiologies).^14^
3. Netherlands: We performed cost-utility analyses by extrapolating data extracted from Bosman et al.^1^ (basic calculation approach).
In addition, we informed the German model with the extracted data to perform a cost-utility analysis in prosthesis users with DM. Health outcomes (QALYs) were discounted by 1.5% and costs by 3% per year.^5^ The main differences between the basic calculation approach and the modelling approach was that the basic approach was limited to the useful lifetime of an MPK in the Netherlands of 6 years and did not include user mortality, while the modelling approach included patient survival and different life cycles of the prosthesis types. For the modelling analysis, we used the (German) age distribution and survival times reported in Kuhlmann et al.^13^ and excluded the effects of falling, since these may have already been (partially) included in the cost and QALY estimates of Bosman et al.^1^
4. We varied the model period from 0.5 to 25 years to analyze the impact of the time horizon of the evaluation on the HE results.
The data extracted from Bosman et al.^1^ is shown in Table 1 and the key parameter values and assumptions of the models in Table 2.
RESULTS
Basic Cost-Utility Analysis
The results of the basic 6-year cost-utility analyses for scenarios 1 and 2 are depicted in Table 3 and Table 4. The analyses show that in both scenarios, the ICUR for MPKs is way below the applicable Dutch willingness-to-pay threshold of €50,000 per QALY.
The basic annual sensitivity analyses are depicted in Table 5 and Table 6. Applying the threshold of €50,000 per QALY, the MPK starts being cost-effective in year 4 in both scenarios.
Comparative Modelling Analysis
Impact of the time horizon on the results of the evaluation
The time horizon of the analysis had a substantial impact on the ICUR, QALYs gained and additional costs in all five modeling scenarios. Over the assumed life cycle of the MPKs, the ICUR decreased drastically from a range between €102,532 (Sweden) to €553,552 (Netherlands) per QALY gained after 6 months to a range from €11,147 (Sweden) to €37,567 (Netherlands) after 6 years (Figure 1). After seven years, the ICURs increased again in all scenarios since a new life cycle of the costlier MPKs began. Depending on the scenario, the ICURs after seven years were between estimated ICURs after three to five years. From year seven to year twelve, the ICURs decreased again in all scenarios. This pattern could be observed with each life cycle of the MPKs (Figure 1). Depending on the scenario, the ICUR estimates began to stabilize after the second or third life cycle of the MPKs for two reasons: 1. The incremental costs and benefits of another year became relatively small compared to those already accumulated, and 2. Many prosthesis users had already died which further decreases the added benefits and costs of another year.
Results for the ICUR modeling scenarios Germany (patients w/ and w/o diabetes mellitus), Sweden, Netherlands (simple calculation) and Netherlands (German population modeling). Please note that the axis “Additional costs per QALY gained” has a logarithmic scale.
Assuming an ICUR threshold of €40,000 per QALY in Sweden,^17^ the KENEVO became cost-effective after an evaluation period of two years in the Swedish setting. Assuming an ICUR threshold of €50,000 per QALY gained in the Netherlands (supplemental material), the MPKs became cost-effective after five years (German model informed by data from Bosman et al.^1^)
Scenario comparison
The comparative modelling results showed substantial variation in ICURs across countries, with the highest ICURs observed in the Netherlands and the lowest in Sweden (Figure 1, Table S1). In the Netherlands, the higher ICUR was mainly driven by lower QALY gains (Table S2) compared to other scenarios. These lower QALY gains more than offset the substantially higher savings in medical and non-medical costs (Table S3). In Sweden, the lower ICUR was primarily explained by a smaller difference in prosthesis costs (Table S4). Despite the shorter assumed life cycle of NMPKs (3.5 vs 6 years for the MPKs) in the Dutch modelling approach, the ICUR is higher than in the basic calculation approach due to the inclusion of mortality. Discount rates had a minor impact on ICURs (Table S1). However, despite differences in assumptions, MPKs types, study populations etc., ICURs were well below €50,000 per QALY in all scenarios when applying a time horizon of at least six years and showed the same trend to reduce the impact of an additional year of MPKs use over time.
The lowest QALY gains were observed in the Netherlands and the highest in Germany (Table S1). The reduced QALY gains observed in the Netherlands were driven by a smaller difference in utilities between MPKs and NMPKs users and by the exclusion of health effects related to falling. In Sweden, utility values for prosthesis use and fall-related outcomes were similar as those used in the German setting, but overall QALY gains were reduced due to higher average mortality in the population (only 65+years were included in the Swedish study).
Non-prosthesis cost savings were highest in the Dutch setting (Table S3). This was mainly because the Dutch scenario adopted a societal perspective, capturing a broader range of medical and non-medical costs, whereas other scenarios only included fall-related costs from a payer’s perspective. In addition, in the German and Swedish scenarios a reduction of falls was assumed over time, reducing the annual difference in fall costs by over 50% from year 4 onwards compared with the first year after prosthesis fitting.
DISCUSSION
Our comparative modelling analysis showed that the time horizon had a huge impact on the results of the cost-utility analysis in all scenarios. Extending the study from 0.5 to 6 or 25 years reduced the ICUR by 89% in the Swedish setting, by 92-95% in the German setting, and 93-94% in the Dutch setting. Despite differences in assumptions, MPKs types, study populations etc., ICURs were well below €50,000 per QALY in all scenarios when applying a time horizon of at least four to five years and showed the same trend to reduce the impact of an additional year of MPKs use over time.
Hence, cost-utility analysis for MPKs over their useful lifetime and replacement cycle in the Netherlands showed that MPKs are very likely cost-effective at the Dutch threshold of €50,000 per QALY as defined by the Zorginstituut Nederland (National Health Care Institute). Our findings are in line with earlier health-economic studies for Italy,^18–20^ Sweden,^14,21^ Germany,^13^ and the United States.^22,23^ The analysis of the impact of the time horizon showed that the time horizon of the study of Bosman et al., 2025,^1^ was way too short to capture the medical and cost benefits of MPK over the useful lifetime and regular replacement cycle in the Netherlands comprehensively. Our findings are especially remarkable because the differences in utility between MPK and NMPK found by Bosman et al. were lower than in previous studies,^13,14,18–24^ resulting in the accrual of lower total utility over time. However, our sensitivity analyses showed that the impact of the time horizon of the evaluation is much greater than that of utility.
As the author group is known for their expertise in providing medical care to patients with amputations and acknowledges the results of previous health-economic studies over longer periods, we find it surprising that they claimed “that assumptions about replacement cycles warrant investigation” and insisted on “very small” differences in utility as the main reason for their astronomical ICUR for 6 months.^3^ Nevertheless, Bosman et al.^1^ found lower total societal costs (excluding prosthesis costs) for the MPK group, which resulted in a reduction in the cost difference between the MPK and NMPK group over time. Though our analysis has limitations, it should be appreciated that we took a very conservative approach to account for the uncertainties of extrapolating present costs and utility values into the future that disadvantaged the MPKs. The model accepted the prosthetic cost assumption extracted from Bosman et al.^1^ and did not include fall-related reductions in hospitalization costs nor fall-related depreciation of QALYs in the NMPK group. Therefore, we are very confident that our finding that MPKs are cost-effective under the conditions of the healthcare system of the Netherlands is reliable.
Limitations
Our analysis has limitations. As we did not have access to the raw data of Bosman et al.,^1^ we could only work with aggregate data reported in the publication. Thus, sensitivity analyses, such as bootstrapping as performed by the authors of the original publication, could not be conducted. To account for this limitation, we took a very conservative approach to the analysis that disadvantaged the MPKs over time. First, we did not account for the typical replacement of an NMPKs after 3-4 years that would have added costs to the NMPKs side and, thus, further reduced the cost difference over the 6-year time horizon. Second, the costs in the MPK group showed higher costs than in the NMPK group for physical therapy, psychologist/psychiatrist, out-of-pocket cost, and presenteeism in the first 6 months. It is unlikely that these higher costs would persist over the full useful lifetime of an MPK of 6 years. However, we did not adjust these costs in the extrapolation as this would have increased the cost difference excluding the prosthesis cost in favor of the MPKs and resulted in a faster and bigger reduction of the total cost difference over time.
In the comparative modelling analysis, we used German population and mortality data for the Dutch setting. This resulted in a higher average age than in the study by Bosman et al. Increased age is associated with higher ICURs^13,14^ due to higher overall mortality. In addition, as a conservative approach, we applied mortality rates of German amputees with DM which are higher than mortality rates in amputees without DM.
CONCLUSION
The cost-utility analyses demonstrated that the MPK is likely to improve prosthesis-specific quality of life and utility, but at higher costs. However, the improvement in health-related quality of life, utility, and cost savings accumulate over time. Hence, choosing extremely short time horizons for health economic evaluations of prostheses does not show the real value for money of MPKs. Furthermore, it does neither follow good practice guidelines nor the national Dutch guideline for conducting cost-effectiveness analyses. Using an appropriate time horizon, the ICURs were well below the official willingness-to-pay threshold of €50,000 per QALY gained in all scenarios after four to five years of MPKs use.
The reference list from the paper itself. Each links out to its DOI / PubMed record.
- 1Bosman CE, van der Sluis, CK, Vrieling AH, Geertzen JHB, Groen H. Health economic evaluation of microprocessor and non-microprocessor controlled prosthetic knees. Can Prosthet Orthot J. 2025;8(2):3. 10.33137/cpoj.v 8i 2.45823 · doi ↗
- 2Brüggenjürgen B, Riemer A, Gapp M. Letter to the editor regarding “Health economic evaluation of microprocessor and non-microprocessor-controlled prosthetic knees”. Can Prosthet Orthot J. 2025;8(2):6. 10.33137/cpoj.v 8i 2.46339 · doi ↗
- 3Bosman CE, van der Sluis, CK, Vrieling AH, Geertzen JHB, Seves BL, Groen H. Response to the letter to the editor regarding “Health economic evaluation of microprocessor and non-microprocessor controlled prosthetic knees.” Can Prosthet Orthot J. 2025;(2):7. 10.33137/cpoj.v 8i 2.46486 · doi ↗
- 4Ramsey S, Willke R, Briggs A, Brown R, Buxton M, Chawla A, et al. Good research practices for cost-effectiveness analysis alongside clinical trials: The ISPOR RCT-CEA task force report. Value Health. 2005;8(5):521–533. 10.1111/j.1524-4733.2005.00045.x 16176491 · doi ↗ · pubmed ↗
- 5Geuzinge HA, El Alili M, Enzing JJ, Huis in ’t Veld LM, Knies S, de Wit GA. The new Dutch guideline for economic evaluations in healthcare: taking the societal perspective to the next level. Value Health. 2025; 28(6):930–935. 10.1016/j.jval.2025.03.00240120976 · doi ↗ · pubmed ↗
- 6Attema AE, Bleichrodt H, L’Haridon O. Ambiguity preferences for health. Health Econ. 2018 Nov;27(11):1699–1716. 10.1002/hec.379529971896 PMC 6221042 · doi ↗ · pubmed ↗
- 7Claxton K, Paulden M, Gravelle H, Brouwer W, Culyer AJ. Discounting and decision making in the economic evaluation of health-care technologies. Health Econ. 2011;20(1):2–15. 10.1002/hec.161221154521 · doi ↗ · pubmed ↗
- 8Weinstein MC, Siegel JE, Gold MR, Kamlet MS, Russell LB. Recommendations of the Panel for cost-effectiveness in health and medicine. JAMA. 1996;274(15):1253–1258.