Hand grip strength and loss of independence in Indigenous and non-Indigenous New Zealand octogenarians—the LiLACS NZ cohort study
Simon A Moyes, Vanessa Selak, Lindsay D Plank, Joanna Hikaka, Ruth Teh, Ngaire Kerse

TL;DR
This study explores how hand grip strength and muscle loss predict loss of independence in elderly New Zealanders, including Indigenous Māori.
Contribution
The study examines these relationships specifically in octogenarians, including Indigenous Māori, a population not widely studied in this context.
Findings
Hand grip strength was inversely associated with low independence in Māori women, non-Māori women, and non-Māori men.
Probable sarcopenia showed similar trends but did not reach statistical significance in the same groups.
The study highlights the potential of hand grip strength as a screening tool for independence loss in the elderly.
Abstract
The number of people losing their independence is increasing as the population ages. Sarcopenia, low muscle strength and mass, and hand grip strength (HGS) are known to predict reduced independence in people in their seventies. This paper investigates these relationships in New Zealand octogenarians, including Indigenous Māori. This study used data from Life and Living in Advanced Age: A Cohort Study in New Zealand (LiLACS NZ), which recruited 421 Māori and 516 non-Māori in 2010-2011. The Nottingham Extended Activities of Daily Living (NEADL) scale measured independence. Participants were classified by ethnicity (Māori or non-Māori) and sex into high, medium or low independence trajectory groups based on their six annual NEADL scores using group-based trajectory modelling. The associations between HGS or probable sarcopenia (a binary measure of HGS) and independence trajectory group…
Genes, proteins, chemicals, diseases, species, mutations and cell lines named across the full text — each resolved to its canonical identifier and authoritative record.
Click any figure to enlarge with its caption.
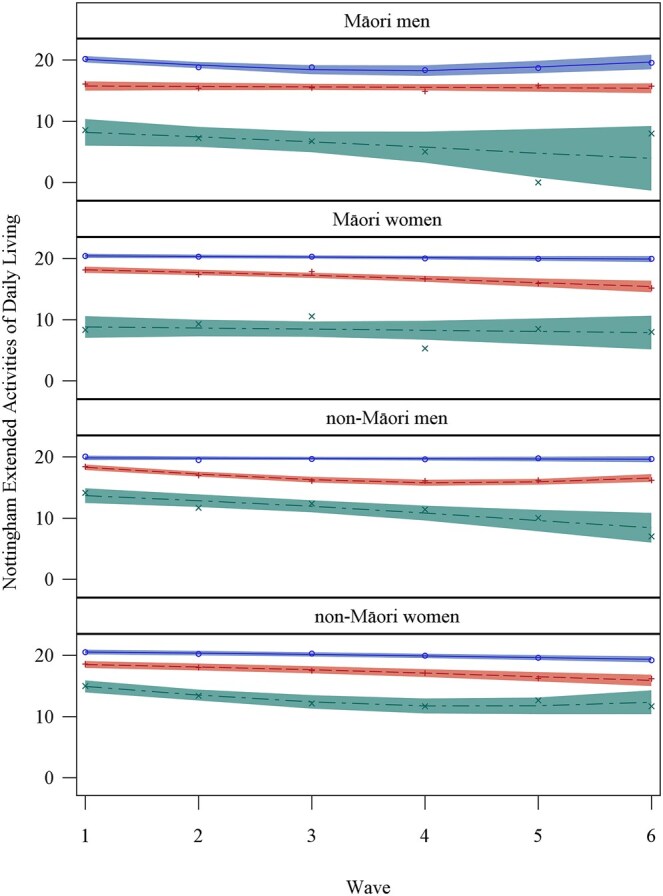 Figure 1
| Wave | Māori women | Māori men | non-Māori women | non-Māori men |
|---|---|---|---|---|
|
| 131 (100%) | 94 (100%) | 166 (100%) | 156 (100%) |
|
| 127 (97%) | 89 (95%) | 163 (98%) | 154 (99%) |
|
| 98 (75%) | 66 (70%) | 147 (89%) | 136 (87%) |
|
| 72 (55%) | 41 (44%) | 121 (73%) | 121 (78%) |
|
| 57 (44%) | 31 (33%) | 102 (61%) | 102 (65%) |
|
| 39 (30%) | 26 (28%) | 87 (52%) | 85 (54%) |
|
| 35 (27%) | 20 (21%) | 73 (44%) | 71 (46%) |
| Māori women | Māori men | non-Māori women | non-Māori men | |||||
|---|---|---|---|---|---|---|---|---|
|
| Mean (SD) |
| Mean (SD) |
| Mean (SD) |
| Mean (SD) | |
|
| 131 | 82.3 (2.6) | 94 | 81.9 (2.5) | 166 | 84.5 (0.5) | 156 | 84.6 (0.5) |
|
| ||||||||
| Māori | 131 | 131 (100%) | 94 | 94 (100%) | 166 | 0 (0%) | 156 | 0 (0%) |
| European | 131 | 66 (50.4%) | 94 | 36 (38.3%) | 166 | 165 (99.4%) | 156 | 156 (100%) |
| Pacific | 131 | 2 (1.5%) | 94 | 0 (0%) | 166 | 1 (0.6%) | 156 | 0 (0%) |
| Asian | 131 | 0 (0%) | 94 | 2 (2.1%) | 166 | 0 (0%) | 156 | 0 (0%) |
| Other | 131 | 0 (0%) | 94 | 0 (0%) | 166 | 0 (0%) | 156 | 0 (0%) |
|
| 129 | 44 (34.1%) | 93 | 31 (33.3%) | 164 | 76 (46.3%) | 156 | 76 (48.7%) |
|
| 129 | 28.9 (5.5) | 92 | 30.3 (5.2) | 166 | 27.0 (4.1) | 156 | 26.8 (3.7) |
|
| 127 | 18.0 (4.0) | 89 | 17.3 (3.8) | 163 | 18.7 (2.4) | 154 | 18.4 (2.6) |
|
| 127 | 19 [17, 21] | 89 | 18 [15, 20] | 163 | 19 [17, 21] | 154 | 19 [17, 20] |
|
| 131 | 20.0 (5.1) | 94 | 31.0 (6.9) | 166 | 18.7 (4.3) | 156 | 30.8 (5.7) |
|
| 131 | 20 [17, 23] | 94 | 30 [27, 34] | 166 | 19 [16, 22] | 156 | 31 [27, 35] |
|
| 131 | 22 (16.8%) | 94 | 21 (22.3%) | 166 | 42 (25.3%) | 156 | 39 (25.0%) |
|
| 131 | 109 (83.2%) | 94 | 73 (77.7%) | 166 | 124 (74.7%) | 156 | 117 (75.0%) |
|
| 123 | 8.2 (2.7) | 86 | 8.3 (2.7) | 147 | 7.9 (2.6) | 151 | 8.8 (2.5) |
|
| 128 | 91.0 (7.5) | 89 | 87.2 (11.9) | 163 | 93.3 (6.4) | 151 | 92.4 (8.6) |
|
| 128 | 1 (0.8%) | 89 | 6 (6.7%) | 163 | 1 (0.6%) | 151 | 3 (2.0%) |
|
| 128 | 11 (8.6%) | 89 | 14 (15.7%) | 163 | 12 (7.4%) | 151 | 12 (8.0%) |
|
| 123 | 0.3 (0.5) | 88 | 0.5 (0.8) | 163 | 0.3 (0.6) | 151 | 0.3 (0.6) |
|
| 123 | 74 (60.2%) | 88 | 38 (43.2%) | 163 | 88 (54.0%) | 156 | 93 (59.6%) |
|
| 129 | 108.0 (72.6) | 89 | 132.3 (93.2) | 163 | 90.5 (48.2) | 156 | 125.3 (72.5) |
|
| 128 | 5.0 (3.2) | 89 | 5.1 (3.3) | 163 | 5.3 (3.2) | 154 | 5.0 (3.3) |
|
| 128 | 12 (9.4%) | 89 | 7 (7.9%) | 163 | 9 (5.5%) | 154 | 8 (5.2%) |
|
| ||||||||
| Never | 129 | 68 (52.7%) | 94 | 26 (27.7%) | 166 | 116 (69.9%) | 156 | 59 (37.8%) |
| Current | 129 | 16 (12.4%) | 94 | 11 (11.7%) | 166 | 3 (1.8%) | 156 | 8 (5.1%) |
| Past | 129 | 45 (34.9%) | 94 | 57 (60.6%) | 166 | 47 (28.3%) | 156 | 89 (57.1%) |
| High independence | Medium independence | Low independence |
| |
|---|---|---|---|---|
|
| ||||
|
| 52 (40%) | 62 (47%) | 17 (13%) | |
|
| 21 {18-22} | 18 {14-22} | 7 {0-19} | |
|
| 20.5 (5.2) | 20.7 (4.6) | 15.6 (4.6) |
|
|
| 81.7 (2.3) | 82.7 (2.5) | 83.4 (3.2) |
|
|
| 0.2 (0.5) | 0.3 (0.4) | 0.9 (1.0) |
|
|
| 93.0 (5.6) | 88.5 (9.8) | 73.8 (30.0) |
|
|
| 7 (13%) | 10 (16%) | 5 (29%) | 0.322 |
|
| ||||
|
| 40 (43%) | 47 (50%) | 7 (7%) | |
|
| 20 {19-22} | 16 {12-20} | 9 {0-16} | |
|
| 33.0 (7.3) | 29.8 (6.6) | 27.9 (2.9) | 0.058 |
|
| 82.1 (2.7) | 82.1 (2.5) | 82.5 (2.9) | 0.807 |
|
| 0.4 (0.7) | 0.6 (0.7) | 1.0 (1.2) | 0.089 |
|
| 90.4 (6.2) | 85.7 (12.6) | 73.2 (18.6) |
|
|
| 8 (20%) | 11 (23%) | 2 (29%) | 0.856 |
|
| ||||
|
| 55 (33%) | 81 (49%) | 30 (18%) | |
|
| 21 {19-22} | 19 {15-22} | 15 {6-21} | |
|
| 19.2 (3.8) | 19.2 (4.4) | 16.8 (4.3) |
|
|
| 84.6 (0.5) | 84.5 (0.5) | 84.7 (0.6) | 0.336 |
|
| 0.2 (0.4) | 0.4 (0.7) | 0.6 (0.7) |
|
|
| 93.2 (8.0) | 93.6 (5.4) | 92.4 (6.6) | 0.624 |
|
| 11 (20%) | 20 (25%) | 11 (37%) | 0.244 |
|
| ||||
|
| 49 (31%) | 86 (55%) | 21 (14%) | |
|
| 20.5 {17-22} | 18 {14-22} | 13.5 {10-19} | |
|
| 31.5 (4.9) | 31.5 (5.7) | 26.5 (6.0) |
|
|
| 84.5 (0.5) | 84.6 (0.5) | 84.7 (0.5) | 0.435 |
|
| 0.1 (0.3) | 0.3 (0.5) | 0.6 (0.9) |
|
|
| 93.6 (5.1) | 92.3 (9.7) | 88.8 (9.0) | 0.168 |
|
| 8 (16%) | 21 (24%) | 10 (48%) |
|
| Predictive variable | Trajectory grouping outcome (ref Med.) | Māori women | Māori men | non-Māori women | non-Māori men |
|---|---|---|---|---|---|
|
|
|
|
| ||
|
| High | 0.99 (0.91, 1.07) | 1.05 (0.98, 1.13) | 1.00 (0.91, 1.08) | 1.00 (0.93, 1.07) |
| Low |
| 0.97 (0.83, 1.14) |
|
| |
|
| High | 0.88 (0.75, 1.03) | 1.09 (0.90, 1.33) | 1.21 (0.62, 2.33) | 1.11 (0.55, 2.22) |
| Low | 1.00 (0.80, 1.26) | 1.02 (0.68, 1.55) | 1.21 (0.52, 2.82) | 1.33 (0.47, 3.79) | |
|
| High | 0.98 (0.37, 2.60) | 0.82 (0.39, 1.74) | 0.48 (0.18, 1.27) | 0.45 (0.16, 1.27) |
| Low | 2.24 (0.84, 5.97) | 0.70 (0.11, 4.33) | 1.60 (0.85, 2.99) | 1.39 (0.59, 3.29) | |
|
| High |
|
| 0.99 (0.94, 1.04) | 1.02 (0.97, 1.08) |
| Low | 1.01 (0.93, 1.09) | 0.96 (0.90, 1.03) | 1.01 (0.94, 1.09) | 0.97 (0.93, 1.01) | |
|
|
|
|
| ||
|
| High | 0.64 (0.20, 2.02) | 0.86 (0.28, 2.68) | 0.88 (0.38, 2.07) | 0.62 (0.23, 1.66) |
| Low | 1.27 (0.26, 6.18) | 0.64 (0.05, 7.53) | 1.89 (0.75, 4.73) | 1.41 (0.45, 4.42) | |
|
| High | 0.88 (0.75, 1.03) | 1.08 (0.89, 1.31) | 1.21 (0.62, 2.34) | 1.15 (0.57, 2.29) |
| Low | 1.04 (0.83, 1.30) | 1.04 (0.69, 1.56) | 1.23 (0.54, 2.80) | 1.53 (0.55, 4.22) | |
|
| High | 1.04 (0.40, 2.73) | 0.78 (0.38, 1.62) | 0.48 (0.18, 1.27) | 0.51 (0.18, 1.42) |
| Low |
| 0.70 (0.10, 4.89) | 1.52 (0.82, 2.82) | 1.70 (0.78, 3.69) | |
|
| High |
|
| 0.99 (0.94, 1.04) | 1.02 (0.96, 1.07) |
| Low | 1.01 (0.93, 1.09) | 0.96 (0.89, 1.02) | 1.00 (0.93, 1.08) | 0.97 (0.92, 1.01) |
- —Health Research Council of New Zealand10.13039/501100001505
- —Ngā Pae o te Māramatanga then the Ministry of Health
- —Oakley Mental Health Foundation
- —National Heart Foundation, Rotorua Energy Trust
- —University of Auckland’s Faculty of Medical and Health Sciences and the Auckland Medical Research Foundation
Peer Reviews
No public reviews on file for this paper yet. If you reviewed it on a platform where reviews are public (OpenReview, ICLR, NeurIPS, ICML), you can paste yours below so the community can read it here.
Videos
No videos yet. Explain this paper in a talk, walkthrough, or lecture? Add one.
Taxonomy
TopicsNutrition and Health in Aging · Body Composition Measurement Techniques · Physical Activity and Health
Introduction
Background/rationale
Preserving the ability to perform basic tasks is crucial to maintaining independence in older age. Sarcopenia, the loss of muscle mass and strength, can impact this ability and lead to reduced independence as gauged by instrumental activities of daily living (IADL) scales.1–3
The Second European Working Group on Sarcopenia in Older People (EWGSOP2) proposed using hand grip strength (HGS) to screen for probable sarcopenia.4 Low HGS is associated with low IADL and is predictive of its deterioration.5–8
Many studies dichotomise their IADL scores into ‘can do all’ or ‘cannot do at least one task’.6^,^9 One example of an IADL score is the Nottingham Extended Activities of Daily Living (NEADL) scale.10 The NEADL scale is scored out of 22 and can be utilized as a continuous measure. While many studies have looked at the link between either sarcopenia and independence or HGS and IADL, these studies have generally focused on people in their seventies rather than their eighties and have not included Indigenous people. The present study uniquely explores these relationships in an octogenarian New Zealand population, including the Indigenous Māori. Investigating how loss of independence can be predicted in the oldest old, particularly Indigenous people, may lead to the development and prioritization of preventative interventions in the future.
Objectives
This paper examined the utility of HGS and probable sarcopenia in predicting independence in IADL, as measured by the NEADL scale, for community-dwelling Māori and non-Māori octogenarians in New Zealand over five years.
Methods
All analyses were stratified by sex and ethnic grouping, which were self-defined in the initial interview.
Study design
The data analyzed here are from LiLACS NZ, a birth cohort study conducted by researchers of the University of Auckland that followed non-Māori from their eighty-fifth year and Māori in their eighties.11
Setting
The LiLACS NZ study recruited participants from the general population in the Bay of Plenty region of New Zealand between 2010 and 2011. There were six annual waves of interviews and physical examinations from 2010 to 2016. Both were usually conducted at the participant’s home or a dedicated assessment centre, occasionally at a primary healthcare clinic.
Written informed consent was requested from study participants to access routinely collected Ministry of Health (MoH) data. These data include admission and discharge dates and any diagnoses and procedures for all publicly funded hospital admissions in the country.
Participants
All those living in the study area, either born in 1925 or self-identified as Māori and born 1920-1930, were eligible to participate in the LiLACS NZ study. The widened age range for Māori enlarged the population pool for the Indigenous participants to achieve a similar sample size to that of the non-Māori group.11 The recruitment birth year ranges were chosen from Statistics New Zealand’s life tables to have roughly 10% mortality per annum in 2010.12
Seven local primary healthcare and Māori providers undertook recruitment, interviews and physical assessments. The Electoral Roll was used as the basis for recruitment, and these organizations added those on their patient lists and advertised the study more generally to recruit participants. Each year after recruitment, a participant would be telephoned to arrange a follow-up interview and physical assessment unless they had previously declined to participate further or died.
Participants living in residential care were excluded from the analyses presented here as their domestic chores were carried out by facility staff regardless of the participants’ capabilities.
Data sources/measurement
Outcome
Trajectory groups were created using all six potentially available NEADL assessments for each participant taken in the study. Mortality was high in both non-Māori and Māori, so only a minority of participants could be assessed in the sixth annual wave. This attrition resulted in the trajectory of each group being based on a smaller sample for each wave.
Predictors
Muscle strength was assessed using HGS as part of the physical assessment. The participant squeezed the handgrip of the Takei GRIP-D dynamometer (Takei Scientific Instruments Co., Ltd, Tokyo, Japan) whilst standing with their elbow at full extension and their arm at their side three times with each hand. The highest of the six readings was used as the HGS estimate. If the participant could not stand for the test, it was performed seated with the arm in the same position as if standing. Probable sarcopenia derived from HGS was also tested as a predictor. The cut-offs used are from the EWGSOP2 and are less than 27 kg for men and 16 kg for women.4
Participants’ age at their initial interview was controlled for in all models. Potentially fatal diseases and chronic conditions could be confounders, but were observed in numbers too small to be used singly. Instead, the Multimorbidity Measure (M3) score was used as a covariate. The M3 score is derived from hospitalization data, and its development team found that in New Zealand, the M3 outperformed the Charlson and Elixhauser indices in predicting mortality.13 The M3’s creators recommend using either a one or five-year history of hospitalizations; as LiLACS NZ had a relatively small sample size, the latter was selected.
Cognition could also impact independence14; in the LiLACS NZ study, the Modified Mini-Mental State Examination (3MS) was used. The 3MS is a hundred-point scale that assesses various aspects of cognition, including short and long-term memory, verbal fluency, and temporal and spatial orientation.15 For modelling, the 3MS was kept as a continuous measure.
Bias
The LiLACS NZ team attempted to recruit as many people eligible for the study as practicable within the survey area. An examination of the differences between those recruited and those not has been published previously; non-Māori women and those in residential care were underrepresented in the total sample.16 However, non-Māori women were analyzed separately from the rest of the cohort, and those in residential care were excluded from the analyses presented here.
Study size
The sample size for the LiLACS NZ study (approximately 500 Māori and 500 non-Māori) was chosen to detect a difference in mortality rate between different levels of nutrition risk or activities of daily living, with an expected overall mortality rate of 10% per annum.11 To increase recruitment, both the full and core questionnaires were offered to participants, and a further physical assessment was optional. In this paper, the participants were restricted to those who were community-living and completed both the full questionnaire (including the NEADL) and the physical assessment (including the HGS) at baseline.
Statistical methods
Independence trajectory groupings were calculated by inverting the NEADL score, counting the number of activities not done to approximate a Poisson distribution. Māori and non-Māori, men and women participants were categorized into trajectory groups based on their inverted NEADL score over six waves using group-based trajectory modelling (GBTM). Differing numbers of trajectory groups were tested using GBTM, but more than three proved to have too few participants in the fourth group.
Baseline characteristics were described for each sex-ethnicity group, overall and by trajectory group (high, medium and low independence). Multinomial logistic regression models were then used to assess the association between baseline predictors and trajectory group membership. Independence could have been influenced by age, health and cognition, so measures of these confounders were included in modelling; first separately, then combined with HGS or probable sarcopenia. The medium independence group was used as the reference group, as it was the largest trajectory grouping.
All analyses were performed using SAS software, version 9.4 (TS1M5) for Windows (SAS Institute Inc., Cary, NC).
Group-based trajectory modelling (GBTM) utilized the PROC TRAJ package (http://www.contrib.andrew.cmu.edu/∼bjones/index.htm).
Missing data
Age, sex, and ethnicity were known for all participants. Some participants in the study did not have an initial physical assessment, so they did not have an initial HGS measurement. A few that had a physical assessment did not attempt a HGS measurement. The GBTM estimated trajectory grouping if any of the six NEADL scores were available; a few participants were excluded as they did not complete the NEADL at any stage.
Results
Participants
The study recruited 56% of eligible Māori and 59% of eligible non-Māori in the recruitment area (421/766 and 516/870, respectively).17 Of those recruited, 11% of Māori and 17% of non-Māori were excluded from these analyses as they were in residential care at some point during the study (48/421 and 90/516, respectively). A further 26% of Māori and 14% of non-Māori were excluded from these analyses as they completed the core questionnaire at baseline, which did not have the NEADL and were not expected to do the physical examination (110/421 and 71/516, respectively). Others did not complete the NEADL (3%, 11/421 of Māori; 1%, 4/516 of non-Māori) or the HGS (6%, 27/421 of Māori; 6%, 29/516 of non-Māori) despite completing the full questionnaire. When added together, these three prerequisites excluded 47% of Māori and 38% of non-Māori in the study, leaving a total of 547 participants (131 Māori women, 94 Māori men, 166 non-Māori women and 156 non-Māori men).
Participants dropped out of the study because of preference, relocating out of the study area, illness, or death. Death was the most common reason for withdrawal, followed by preference; the numbers of each have been published previously.16 Most of those included in analyses dropped out before wave 6, so all trajectories are less well defined for later time points (Table 1).
Descriptive data
Women were 54%, and Māori 41%, of participants included in modelling (297/547 and 225/547, respectively). The mean age of Māori was 82 at baseline, younger than the non-Māori mean of 85 years. Men had a greater mean HGS than women (30.9 kg (SD 6.2 kg) compared to 19.3 kg (SD 4.7 kg), respectively; tested by generalized linear model, the age-adjusted p-value was <.0001). Mean HGS in Māori was slightly higher than in non-Māori for men and women (tested by generalized linear model; the age-adjusted p-value was =.67). Most study participants had a recent history of ill health; they had been hospitalized with some morbidity within five years of starting the study (55% had an M3 score greater than zero). Overall, 23% of those tested had probable sarcopenia (Table 2). The differences in sarcopenia rate were not statistically significant (tested by logistic regression; the smallest age-adjusted p-value was for Māori versus non-Māori women at 0.15).
Trajectory groups
Although modelled separately, Māori and non-Māori men and women were divided into similar trajectory groups (Figure 1). The three trajectory groups for each ethnicity-sex combination were categorized as high, medium, or low independence. In all four ethnicity-sex combinations, the medium independence group was the largest (47-57% of the sample), with the high independence group being intermediate (29-40%) and the low independence group being the smallest (12-23%, Table 2).
Independence trajectory grouping of the LiLACS NZ cohorts by sex and ethnicity over time. Note. Lines represent the modelled trajectory of each group, with a 95% confidence interval band about them. Observed mean scores for each trajectory group at each annual interview are indicated with circles. The high independence group is blue, the medium red and the low independence group green.
For all four sex-ethnicity combinations, the high independence group started with almost total independence, having median NEADL scores of 20/22 or better. The medians for the medium independence scores were between 16 and 19, indicating some reliance on others for difficult tasks. The medians for the low independence scores were lower still, indicating much more reliance on others.
Generally, the participants’ independence, as gauged by the NEADL score, was slightly lower than their baseline after five years. The Māori women in the medium independence group had a statistically significant decline in independence over time, but high and low independence groups remained little changed over time. Function for Māori men in the medium independence group was stable, but there was a considerable deterioration over time for the low independence group. Māori men in the high independence group had an initial significant linear decline in independence over time but a significant quadratic element to their trajectory, indicating a recovery of independence after a few years. Non-Māori women in all three groups significantly declined in independence over time. However, their low independence group had a significant quadratic element to their trajectory, indicating a recovery of independence after a few years. The independence of non-Māori men in the medium and low groups significantly declined over time, with the medium group recovering independence after a few years. Function for non-Māori men in the high independent group was stable.
Predictors
The three trajectory groups differed significantly in HGS and comorbidities (M3 score) for each ethnicity-sex group (Table 3). A similar pattern was seen for Māori men, although statistical significance was not reached. Cognition (3MS score) was also significantly different between independence groups for Māori men and women, with the higher independence groups having greater cognition on average. Probable sarcopenia was inversely related to the level of independence, but this effect only reached statistical significance for non-Māori men.
Combined models
The statistical significance of HGS in predicting the independence trajectory group was reduced when combined with other significant predictors in a single model (Table 4). For Māori women, an increase in HGS lowered the odds of being in the low independence trajectory group (adjusted OR with CI of 0.84 [0.72, 0.97]) and an increase in cognition increased the odds of being in the high independence trajectory group (1.07 [1.01, 1.14]) compared to the medium independence trajectory group. For Māori men, cognition remained the sole significant predictor; an increase in cognition increased the odds of being in the high independence trajectory group (1.08 [1.02, 1.16]) compared to the medium independence trajectory group. For non-Māori women, an increase in HGS lowered the odds of being in the low independence trajectory group (0.86 [0.77, 0.96]) compared to the medium independence trajectory group. For non-Māori men, an increase in HGS lowered the odds of being in the low independence trajectory group (0.90 [0.81, 0.99]) compared to the medium independence trajectory group.
Probable sarcopenia was not a statistically significant predictor in combined models. For Māori women, cognition and comorbidities remained significant; for Māori men, cognition was the sole significant predictor. For non-Māori women and men, no predictor remained significant.
Discussion
Key results
Nearly all the trajectory groups declined for the first few years, though some groups’ scores recovered. Those with high independence initially maintained it. Māori and non-Māori men in the lowest independence group at baseline had the greatest loss of independence.
Grip strength, comorbidities and cognition predicted independence trajectory over the next five years. In the combined model, both comorbidities and cognition mediated the relationship between independence and HGS. These factors could be the drivers for both sarcopenia and HGS. Dementia makes tasks more mentally challenging and reduces HGS through poorer neuromuscular signalling, increasing the need for assistance.18 Physical illnesses can weaken muscle, impacting both HGS and the physical ability to perform tasks independently.9^,^19^,^20
Probable sarcopenia was more common in the lower independence group, but was only a statistically significant predictor of trajectory group for non-Māori men. However, when comorbidities were adjusted for, sarcopenia was no longer a significant predictor for non-Māori men. Grip strength as a continuous measure was a better predictor than probable sarcopenia.
Limitations
Data source
Participants in the study with missing data had a significantly higher mortality rate than others. This difference indicates that a disproportionate number had opted out of the full interview, part of the interview, or the physical assessment because of poor health.
The exclusion of these participants could have weakened the apparent relationship between poor health indicators, like HGS, and independence. In particular, those missing as because they were unable to perform the HGS test, unable to squeeze with either hand, or would need help with many tasks.
Outcome
The NEADL’s creators acknowledged some flaws in their design.10 The component questions are self-reported, rather than assessed. Although the questions are phrased as ‘do you’ rather than ‘can you’, respondents may answer affirmatively if they could do something rather than if they had carried out the activity. Conversely, many activities are household chores that some in perfect health may not do themselves. A later study noted that reading and writing depend on good vision and are more popular with those with higher education.21 They also noted that 81% of their participants did not wash dishes, possibly because many of their sample lived with younger family members who did many household tasks for them. Their sample was from Hong Kong and Taiwan, and the researchers noted that the NEADL valuing individual independence may reflect Western culture, which could be relevant in our study, which has different ethnic groups.
Excluding those placed into residential care removed a subset with very low independence; results do not apply to this population. However, entry into residential care would not follow a continuous trajectory; it would be a sudden change in circumstance.
Predictor
Hand grip strength
There is no universally agreed-upon method of measuring HGS; slightly higher HGS readings are observed with the test subjects standing with their arm at their side than when they were tested sitting down with their elbow at 90°.22 Readings can vary between equipment from different manufacturers.23 The EWGSOP2 cut-offs were from a paper that pooled data from twelve studies; most used the JAMAR dynamometer while seated, only the Newcastle 85+ used the same Takei device standing as used in LiLACS NZ.24 The authors checked but did not find that adjusting for the differing methods and devices was necessary when pooling the data in their paper. The LiLACS NZ study used the same dynamometer and methods with the same age group as Newcastle 85+, so the results should have a similar level of compatibility with other studies. The greater mean HGS observed in the LiLACS NZ study compared to the Newcastle 85+ is consistent with studies in Germany and the Netherlands, so it is plausibly due to population differences rather than measurement error.25^,^26 (The Newcastle 85+ study published a paper predicting disability trajectory group, but did not examine HGS as one of the predictors of group membership.27)
Probable sarcopenia
The EWGSOP2 team acknowledged that their selection of cut-offs for HGS and other measures was arbitrary and a topic of further research. The EWGSOP2 procedure for defining sarcopenia identifies probable sarcopenia using muscle strength. Then, it confirms the diagnosis by determining poor muscle mass through a body composition scan or bioelectrical impedance analysis.4 There are reasons for low strength other than sarcopenia, such as degraded neuromuscular signals.18 However, in the LiLACS NZ study, few participants had dementia, and excluding those with a 3MS below 70 (Table 2) had a negligible effect on the models.
Interpretation
Previous studies have noted that low HGS corresponds to limited IADL and is predictive of its deterioration.5–7 Sarcopenia has also been observed to predict reduced IADL.1^,^2 For Māori and non-Māori, men and women, HGS proved predictive of independence trajectory over five years. The participants with the strongest HGS at baseline, for their sex and ethnicity, generally maintained independence over the follow-up period. Probable sarcopenia, as a dichotomous variable, was not as predictive. For both ethnic groups and sexes, chronic illness was more predictive of low independence in the future than HGS. For Māori men and women, high cognition was more strongly predictive of maintaining independence. The collinearity of HGS, comorbidities and cognition meant that they all lost significance in the combined models. Cognition was the best stand-alone predictor for Māori, and the M3 comorbidity score was the best for non-Māori.
However, measuring a patient’s HGS would be quicker than testing their cognition or medical history in a clinical setting. A validated HGS cut-off would assist decision-making. The proportion of those with probable sarcopenia was higher in the low independence group than the high independence group for both sexes and ethnicities. A larger sample might have established probable sarcopenia as predictive of independence, so there is a need for further research.
Generalizability
The results here indicate that for both Māori and non-Māori in their eighties, HGS can be used to assess their current independence and the potential decline of that independence over the next five years. Grip strength can be used to gauge the independence trajectory of community-dwelling octogenarians. Those with low HGS could be identified and treated to help maintain or even improve their independence. Effective treatment of sarcopenia and low strength in older populations is a topic of much ongoing research. Various dietary supplements, exercise regimen and medications have been proposed.28–40 The benefits of screening with HGS could be investigated further as a potential low-cost, simple-to-administer screening tool. Catching sarcopenia early and starting treatment before problems manifest could help reduce healthcare inequities between Māori and non-Māori.
The reference list from the paper itself. Each links out to its DOI / PubMed record.
- 1Tanimoto Y , Watanabe M, Sun W, et al Association between sarcopenia and higher-level functional capacity in daily living in community-dwelling elderly subjects in Japan. Arch Gerontol Geriatr. 2012;55:e 9-e 13. 10.1016/j.archger.2012.06.01522795189 · doi ↗ · pubmed ↗
- 2Buchman AS , Leurgans SE, Wang T, et al Motor function is the primary driver of the associations of sarcopenia and physical frailty with adverse health outcomes in community-dwelling older adults. P Lo S ONE. 2021;16:e 0245680. 10.1371/journal.pone.024568033529220 PMC 7853482 · doi ↗ · pubmed ↗
- 3Yılmaz A , Şentürk DurmuşN, Yıldız Y, et al Sarcopenia and sarcopenic obesity in postmenopausal women: a cross-sectional study in Türkiye. Climacteric. 2026;29:61-66. 10.1080/13697137.2025.253798240811081 · doi ↗ · pubmed ↗
- 4Cruz-Jentoft AJ , Bahat G, Bauer J, et al Sarcopenia: revised European consensus on definition and diagnosis. Age Ageing. 2019;48:16-31. 10.1093/ageing/afy 16930312372 PMC 6322506 · doi ↗ · pubmed ↗
- 5Li K , Lin K, Wang T, Wu C, Huang Y, Ouyang P. Ability of three motor measures to predict functional outcomes reported by stroke patients after rehabilitation. Neuro Rehabilitation (Reading, Mass.). 2012;30:267-275. 10.3233/NRE-2012-075522672940 · doi ↗ · pubmed ↗
- 6Rijk JM , Roos PR, Deckx L, van den Akker M, Buntinx F. Prognostic value of handgrip strength in people aged 60 years and older: a systematic review and meta-analysis. Geriatr Gerontol Int. 2016;16:5-20. 10.1111/ggi.1250826016893 · doi ↗ · pubmed ↗
- 7Meskers CGM , Reijnierse EM, Numans ST, et al Association of handgrip strength and muscle mass with dependency in (instrumental) activities of daily living in hospitalized older adults -the EMPOWER Study. J Nutr Health Aging. 2019;23:232-238. 10.1007/s 12603-019-1170-530820510 PMC 6399821 · doi ↗ · pubmed ↗
- 8Moon S , Oh E, Chung D, Hong GS. Changes in instrumental activities daily living limitations and their associated factors according to gender in community-residing older adults: A longitudinal cohort study. Plo S One. 2024;19:e 0296796. 10.1371/journal.pone.029679638206920 PMC 10783775 · doi ↗ · pubmed ↗