An imbalance between CD80 and CD86 levels and CD4 regulatory T cell number and transendocytosis function exists in the liver in autoimmune hepatitis
Neil Halliday, Alan Kennedy, Cayman Williams, Blagoje Soskic, Claudia Hinze, Massimo Pinzani, Douglas Thorburn, David M Sansom

TL;DR
In autoimmune hepatitis, liver Treg cells are activated and functional, but there is an imbalance with CD80 and CD86 levels, which may affect immune regulation.
Contribution
The study reveals preserved Treg frequency and function in AIH liver, but highlights an imbalance with CD80/CD86 levels and Tcon activation.
Findings
Treg frequency is increased in AIH liver with an activated phenotype and high CTLA4 expression.
CD80 and CD86 levels on B cells and monocytes are maintained or increased despite Treg presence.
Treg transendocytosis function is preserved and enhanced by IL2 or IL10 in AIH.
Abstract
Impairment in Regulatory CD4 T cells (Treg) number and function have been implicated in autoimmune hepatitis (AIH). Treg are critical regulators of CD28 costimulation through CTLA4-mediated CD80 and CD86 control. We sought evidence for hepatic Treg frequency, phenotype, and function, and CD80/CD86 availability in AIH. Hepatic immune cells were isolated from eight patients with AIH and compared with cirrhotic and non-cirrhotic controls. Cells were assessed by flow cytometry and function was assessed by acquisition of CD80 from model antigen-presenting cells (APCs). We observed that Treg frequency was increased in AIH liver. Treg had an activated phenotype with a high CTLA4 expression and higher frequency of CTLA4 + PD1+ cells compared to non-AIH. Conventional CD4 T cells (Tcon) had an activated phenotype with increased HLA-DR expression, despite patients being in biochemical and…
Genes, proteins, chemicals, diseases, species, mutations and cell lines named across the full text — each resolved to its canonical identifier and authoritative record.
Click any figure to enlarge with its caption.
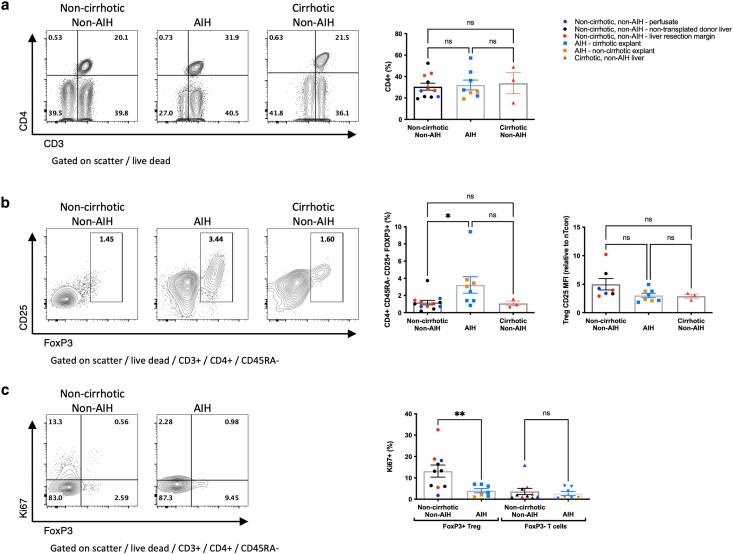 Figure 1
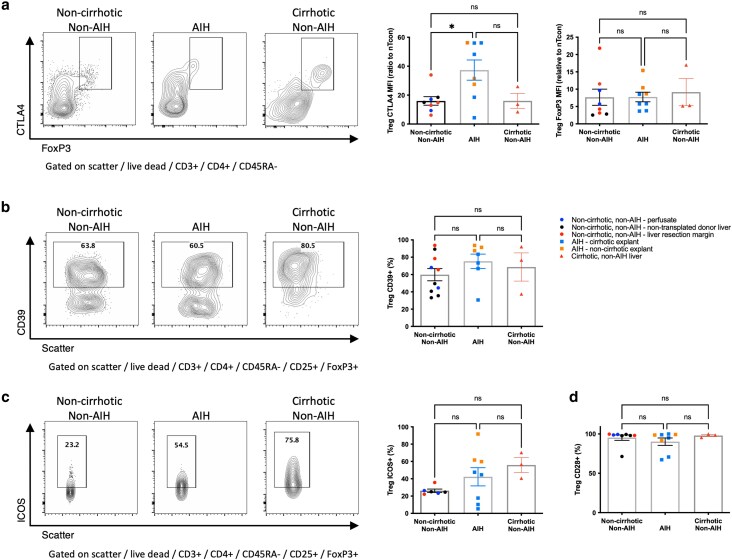 Figure 2
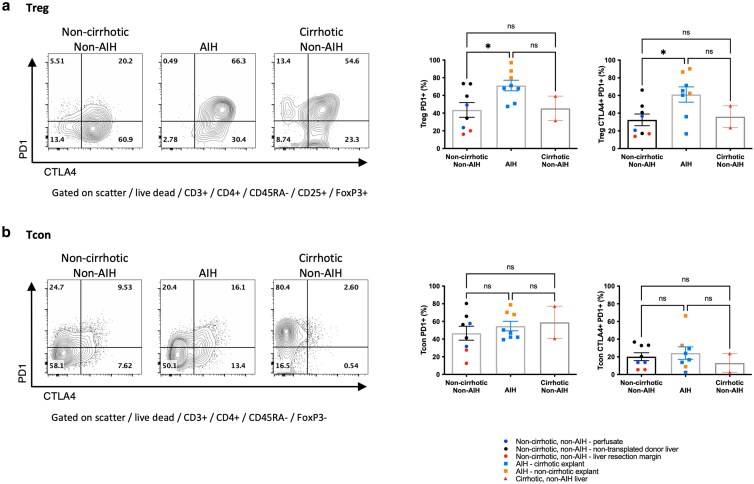 Figure 3
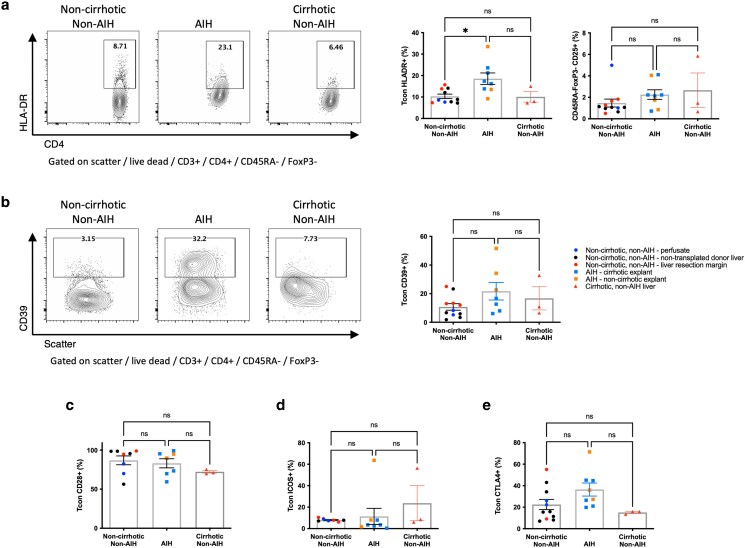 Figure 4
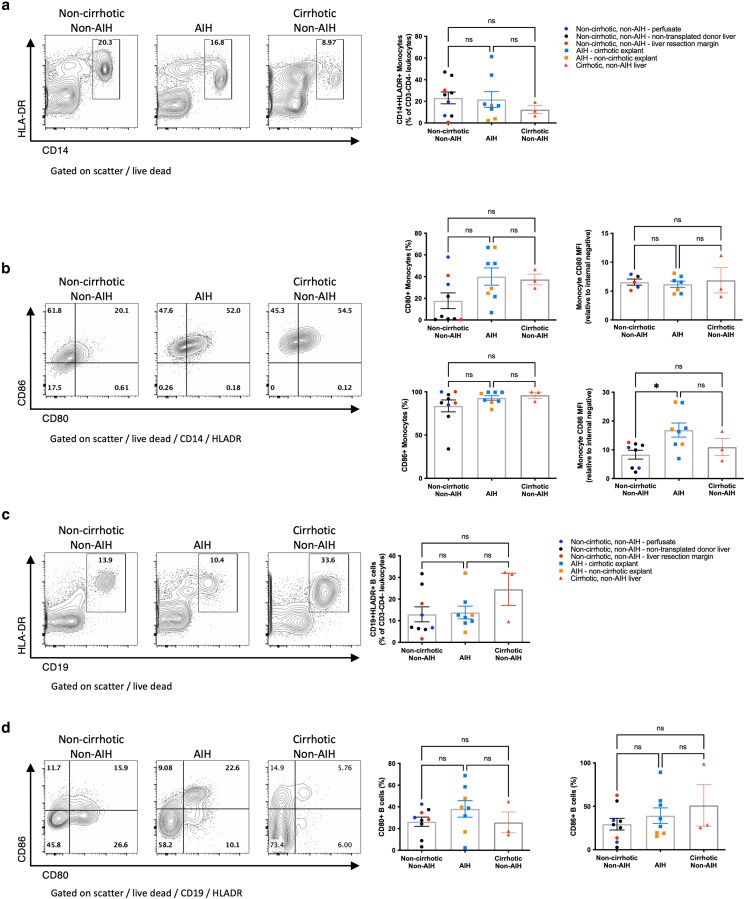 Figure 5
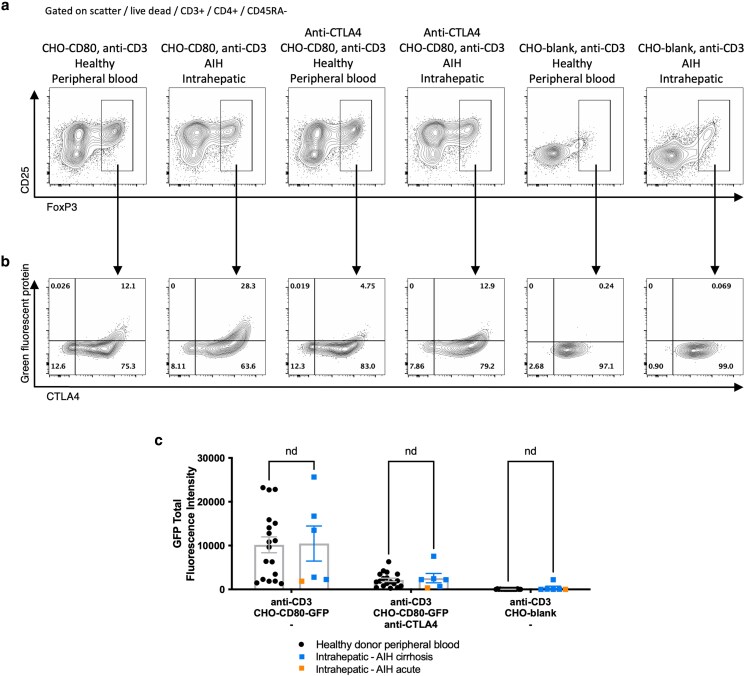 Figure 6
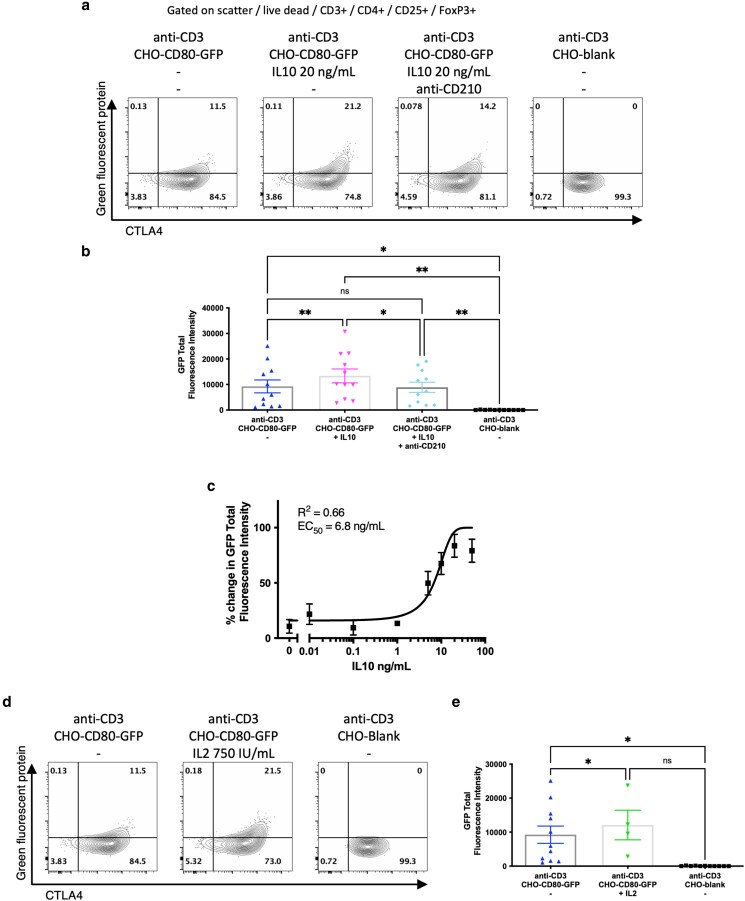 Figure 7
| Age | Gender | Modified disease score | Serum autoantibodies | Medication | ALT | IgG | Bilirubin | INR | Clinical presentation | Explant histology | ||
|---|---|---|---|---|---|---|---|---|---|---|---|---|
| ANA | aSMA | aLKM | ||||||||||
| 47 | F | 6 | +++ | − | − | Aza, Pred | 20 | na | 25 | 1.2 | Cirrhotic type 1 AIH | Cirrhosis, minimal interface hepatitis |
| 42 | F | 8 | na | +++ | − | Tac, Aza, Pred | 309 | 40 | 380 | 2.4 | Subacute fulminant AIH | Severe acute hepatitis, panacinar necrosis |
| 25 | F | 6 | na | − | + | MP, Pred | 44 | 6.1 | 34 | 1.2 | Cirrhotic type 1 AIH | Cirrhosis, no interface hepatitis, mild lymphocytic infiltrate |
| 32 | F | 6 | na | − | ++ | Aza, Pred | 27 | 12.2 | 34 | 1.2 | Cirrhotic type 2 AIH | Cirrhosis, no interface hepatitis, mild lymphocytic infiltrate |
| 33 | F | 6 | na | Na | na | Aza | 16 | 10 | 78 | 1.2 | Cirrhotic type 1 AIH | Cirrhosis, no interface hepatitis, mild lymphocytic infiltrate |
| 27 | M | 7 | + | − | − | HC, Tac | 284 | 18.3 | 478 | 1.7 | Cirrhotic type 1 AIH | Cirrhosis, no interface hepatitis, mild lymphocytic infiltrate |
| 57 | F | 8 | 1:160 | 1:80 | — | Aza, Pred | 227 | 8.6 | 480 | 1.2 | Subacute fulminant AIH | Bridging necrosis, mild lymphocytic infiltrate |
| 45 | F | 7 | 1:320 | — | — | Nil | 1898 | 22.6 | 684 | 3.1 | Acute fulminant AIH | Lobular necroinflammation, lymphoplasmacytic infiltrate |
- —Wellcome Trust10.13039/100010269
- —Academy of Medical Sciences10.13039/501100000691
Peer Reviews
No public reviews on file for this paper yet. If you reviewed it on a platform where reviews are public (OpenReview, ICLR, NeurIPS, ICML), you can paste yours below so the community can read it here.
Videos
No videos yet. Explain this paper in a talk, walkthrough, or lecture? Add one.
Taxonomy
TopicsLiver Diseases and Immunity · Liver physiology and pathology · T-cell and B-cell Immunology
Introduction
Autoimmune hepatitis (AIH) is a disorder that results in parenchymal liver inflammation and can result in acute liver failure or chronic liver disease resulting in cirrhosis [1]. AIH is characterized by genetic associations with variants in class I and class II HLA and immune regulatory genes, including cytotoxic T lymphocyte antigen 4 (CTLA4) and SH2B3 [2, 3]. Patients with AIH typically have circulating autoantibodies, including anti-nuclear, anti-smooth muscle, and anti–liver–kidney microsomal antibodies and raised polyclonal immunoglobulin G [1]. Treatment is conventionally with immunosuppressive medications, although advanced chronic liver disease and acute liver failure may require liver transplantation (LT).
Regulatory CD4 T cells (Treg) have been implicated in the pathogenesis of AIH, with evidence for Treg dysfunction, impaired Treg frequency, and an imbalance in Treg:T helper (Th)17 ratios in peripheral blood [4–8]. CD25 + FoxP3+ Treg are critical for the maintenance of self-tolerance by restraining autoreactive immune responses by various effector mechanisms [9, 10]. Loss or deficiency of Treg results in widespread autoimmunity, including AIH-like syndromes, in both animal models and humans [11–13].
The associations of Treg and genetic polymorphisms in CTLA4, including an enhancer variant that results in low CTLA4 expression [3], with the onset and progression of AIH suggest that alterations in the control of CD28 costimulation by Treg may underlie the pathogenesis of AIH. CTLA4 is a critical effector for Treg control of autoimmune responses by regulation of the ligands for CD28. CD28 provides the dominant costimulation signal for CD4 and CD8 T cells following engagement with the ligands CD80 or CD86, which are expressed on APCs [14], and uniquely to the liver, on the liver sinusoidal endothelium [15] and hepatocytes [16, 17]. CTLA4 is a high-affinity receptor for CD80 and CD86, resulting in the suppression of CD28 signals by competitive binding and removal and destruction of CD80 and CD86 by transendocytosis [18]. CTLA4 is constitutively expressed by Treg, and loss of CTLA4 in animal models and human haploinsufficiency results in lymphoproliferation, solid organ inflammation, and autoimmunity, including liver pathology [19]. Similarly, direct CD28 agonism has been shown to induce an AIH-like phenotype in a mouse model [20], thus supporting a model where defective Treg or CTLA4 function leads to excessive CD28 costimulation, T cell activation, and autoimmunity within the liver.
Studies of Treg number, phenotype, and function in AIH have mainly relied upon the examination of peripheral blood Treg from patients, which may not reflect the biology occurring at the site of inflammation. We therefore undertook an assessment of the intrahepatic Treg and conventional CD4 T cell (Tcon) (non-Treg CD4 T cells) populations from explanted liver tissue at the time of LT, compared with liver tissue from noncirrhotic, non-AIH liver (as a proxy for ‘healthy’ liver) and from cirrhotic liver tissue from non–immune-mediated liver disease. Defining the immune perturbations in AIH has the potential to identify new biomarkers of disease activity and prognosis, to explore new treatment targets, and to enhance our understanding of the pathogenesis of autoimmune liver conditions. Here, we report changes in the frequency and phenotype of Treg, evidence for chronic activation of Tcon, and preserved or elevated levels of CD80 and CD86, suggesting a possible imbalance in Treg and control of CD80 and CD86 in AIH. Ex vivo testing of intrahepatic Treg demonstrated preserved capacity for activation and CD80 transendocytosis, suggesting that Treg retain functional capability with respect to control of ligands of CD28 in AIH.
Materials and methods
Patient samples
Patients with a diagnosis of AIH based on a modified International Autoimmune Hepatitis Group (IAIHG) score of 6 or more, undergoing liver transplantation, were included [21]. Explanted livers were collected in phosphate-buffered saline (PBS) and, after clinical pathological assessment, excess liver tissue was processed for study. AIH liver samples included those with cirrhosis and those undergoing LT for (sub)acute liver failure, representing severe or end-stage AIH disease. Due to the rarity of samples, both acute and chronic AIH samples were combined for analysis.
Noncirrhotic, non-AIH liver tissue was obtained from several sources, including (i) livers offered as donor organs for transplantation but not used for logistical or clinical indications (e.g. extensive vascular or capsular injury on retrieval), (ii) liver perfusion fluid from donor-transplanted livers (which provides a population of immune cells reflective of the intrahepatic immune environment [22]), and (iii) distal margins from liver resections of colorectal metastases from patients without background liver disease. Cirrhotic, non-AIH tissue was obtained from explanted livers from patients with alcohol-related liver disease, who were abstinent in line with transplant guidance, undergoing liver transplantation for chronic liver disease.
Isolation of intrahepatic mononuclear immune cells
Liver tissue was prepared by washing twice in ice-cold PBS, followed by maceration in 0.001% bovine pancreas DNase 1 (Sigma-Aldrich) and 0.01% type IV collagenase (ThermoFisher Scientific) containing Hanks’ Balanced Salt Solution with added calcium, magnesium, and phenol red (Life Technologies). Macerated tissue was incubated with regular agitation at 37°C for 30 minutes. Cells were collected after straining macerated tissue through a metal sieve, with the breakdown of residual tissue by pressure through the sieve, followed by a 70-μm cell strainer (Fisher Scientific). The cell suspension was diluted in Roswell Park Memorial Institute media (RPMI) (Invitrogen) containing 10% fetal calf serum (LabTech), 1% penicillin and streptomycin (Invitrogen), and 2 mM glutamine (Sigma-Aldrich) (complete RPMI). Samples were centrifuged for 2 minutes at 50 × g to remove hepatocytes, then layered 1:1:1 over 40% isotonic Percoll (GE Healthcare), Ficoll-Paque PLUS (GE Healthcare) gradients, and centrifuged at 1060 × g for 25 minutes without brake. Mononuclear cells were collected from the interface and resuspended in complete RPMI or in 0.5% bovine serum albumin and 2 mM EDTA in PBS (MACS buffer) at 1 × 10^8^ cells/ml for negative selection of CD4 T cells.
Immune cells from transplant perfusion fluid were isolated by centrifugation at 750 × g for 15 minutes, followed by density gradient centrifugation over Ficoll-Paque PLUS at 400 × g for 20 minutes without a brake. The mononuclear cell layer was collected and washed with PBS and then centrifuged for 15 minutes at 750 × g and resuspended in complete RPMI.
Peripheral blood mononuclear cell isolation
Healthy donor peripheral blood was obtained from leukodepletion cones (NHS Blood and Transplant) or from fresh blood draws from healthy donors. Leukocyte cones were diluted 1:6, and fresh blood 1:2 with PBS and mononuclear cells were isolated by density gradient centrifugation over Ficoll-Paque PLUS gradients following centrifugation at 1060 × g for 25 minutes without brake. The mononuclear cell layer was retrieved and washed using PBS with centrifugation for 10 minutes at 1060 × g, 5 minutes at 60 × g and 5 minutes at 490 × g. Mononuclear cells were resuspended in MACS buffer at 1 × 10^8^ cells/ml for CD4 T cell–negative selection.
CD4T cell isolation
Total CD4 T cells were isolated from liver or peripheral blood mononuclear cell populations by immunomagnetic negative selection using the EasySep Human CD4+ T cell Enrichment Kit (StemCell Technologies), as per the manufacturer’s instructions. Briefly, mononuclear cells in MACS buffer were incubated with 50 μl of enrichment cocktail per 1 × 10^8^ cells for 10 minutes at room temperature. Following this, 100 μl EasySep D Magnetic Particles were added per 1 × 10^8^ cells and incubated for 5 minutes at room temperature. The cells were transferred to EasySep magnets for 5 minutes, and non–bound cells were poured off for collection, washed twice in PBS, and then resuspended in complete RPMI. Purity assessed by flow cytometry routinely exceeded 95% CD4 T cells.
Flow cytometry
Multicolour flow cytometry was performed on isolated cells after staining with Fixable Viability Dye eF780 (eBiosciences) and surface staining with anti-CD3 V500 (clone UCHT1; BD Biosciences), anti-CD4 AF700 (RPA-T4; BD Biosciences), anti-CD25 BV605 (2A3; BD Biosciences), anti-CD45RA Percp-Cy5.5 (HI100; eBiosciences), anti-CD39 PE-Cy7 (A1; Biolegend), anti-ICOS (CD278) BUV395 (DX29; BD Biosciences), anti-PD1 (CD279) BV786 (EH12.2HZ; BD Biosciences), anti-HLA-DR FITC (G46-6; BD Biosciences), anti-CD28 PE-Cy7 (CD28.2; BD Biosciences), anti-CD14 AF700 (M5E2; BD Biosciences), anti-CD86 BV421 (IT2.2; Biolegend), anti-CD80 PE (L307.4; BD Biosciences), and anti-CD19 BV786 (SJ25C1; BD Biosciences). Staining of intracellular antigens was performed after fixation and permeabilization using the FoxP3 Staining Kit (eBiosciences) with anti-FoxP3 APC (236A/E7; eBiosciences), anti-Ki67 FITC (B56; BD Biosciences), and anti-CTLA4 (CD152) PE (BNI3; BD Biosciences).
Flow cytometry was performed with an LSRFortessa (BD Biosciences) and analysed using FlowJo version 10.8.1 (Treestar). The gating strategy to identify populations of interest is shown in Supplementary Figure S1. Variation in fluorescence intensity between runs was controlled for by the use of Application Settings at the time of acquisition to account for drift in cytometer settings. To further ensure standardization for variation in baseline autofluorescence from different tissue preparations, relative median fluorescence intensity (MFI) was calculated. Within each sample, a recognized population of cells known not to express the marker of interest was selected, and the MFI of the positive population was expressed as a ratio of the MFI of the negative population. This standardization to an internal negative population reduces variation further. Negative and positive populations were defined based on the known internal negative population (Supplementary Figure S1c).
CD80 transendocytosis assays
In total, 2 × 10^5^ freshly isolated CD4 T cells from peripheral blood or liver tissue were co-cultured in complete RPMI with 1 μg/ml anti-CD3 (OKT3; BioXCell) for 16 hours alongside Chinese Hamster Ovary (CHO) cells either transduced to express human CD80 labelled with a C-terminal Green Fluorescent Protein (GFP) tag (CHO-CD80) or not (CHO-Blank) at 1:1 ratio. Anti-CTLA4 (ticilimumab was a gift from Pfizer) was added at 20 μg/ml, and recombinant human interleukin (IL) 2 or IL10 (both Peprotech) was added at stated concentrations with or without 20 μg/ml anti-CD210 (anti-IL10RA) (clone 3F9, BD Biosciences), as stated. CD80 acted as both a CD28 costimulatory ligand for activation and a target for transendocytosis. Cells were collected, and GFP acquisition was assessed by flow cytometry. GFP acquisition was determined as the total fluorescence intensity (TFI) of GFP, defined as the frequency of GFP-containing FoxP3+ Treg multiplied by the mean GFP fluorescence intensity of GFP-containing Treg.
Statistical analysis
Statistical analysis was conducted using Prism version 10.10 (GraphPad Software). One-way analysis of variance (ANOVA) test was used when comparing multiple groups of continuous variables, with Tukey’s multiple comparison tests of significance. Independent t tests were applied to compare the means of independent continuous variables for GFP TFI. Statistical significance was indicated by P values ≤0.05.
Results
Patient cohort
Liver explant samples were obtained from eight patients undergoing orthotopic liver transplantation for liver failure due to AIH. Seven patients were female with an average age at transplantation of 38.5 years (range: 25–57 years). Three patients did not have evidence of chronicity on histological examination of their explant and were indicated for transplantation for (sub)acute liver failure. The remaining five patients had cirrhosis with end-stage liver disease, of whom four met the criteria for complete biochemical response (ALT and immunoglobulin G within the normal laboratory range) at the time of transplantation [23], and all five had minimal inflammatory activity in the explanted liver. All patients except for one were taking immunosuppressive medications at the time of transplantation. Patient clinical characteristics, biochemistry, and explant histological findings are summarized in Table 1.
Intrahepatic Treg frequency is higher in AIH
We first examined the frequency of Treg in the intrahepatic mononuclear cell population isolated from all three groups of liver tissue. We observed that the frequency of CD4 + CD45RA− memory T cells within the CD3+ T cell population was the same in non-AIH noncirrhotic, cirrhotic, and AIH liver (Fig. 1a). However, CD4 + CD45RA-CD25 + FoxP3+ Treg frequency, as a percentage of CD3 T cells, was significantly higher in AIH liver compared with noncirrhotic, non-AIH liver and cirrhotic liver (3.3%, 1.18%, and 1.08%, respectively, P < 0.05) (Fig. 1b). Within the Treg populations, CD25 expression was similar in all groups (Fig. 1b), although Ki67 expression was significantly lower in AIH Treg compared with noncirrhotic, non-AIH liver Treg (3.98% vs 13.19%, P < 0.01) (Fig. 1c). However, Ki67 expression was similar in Tcon in both groups (3.63 vs 2.65%, P = 0.9) (Fig. 1c). Subanalysis, separating (sub)acute AIH from cirrhotic AIH, showed similar trends; although a statistically significant increase in Treg frequency in AIH was not observed, the trend remained (Supplementary Figure S2). Taken together, these observations suggested a preserved or higher frequency of Treg in the liver in AIH compared with both non-AIH chronic liver disease and non-cirrhotic, non-AIH liver, despite relatively low levels of cell proliferation.
Comparison of T cell frequency and proliferation in liver tissue. a: Comparison of CD4+ T cell frequency within the CD3+ T lymphocyte population, comparing liver tissue from patients with AIH to those without. b: Comparison of Treg frequency, demonstrating the percentage of CD4 + CD45RA-CD25 + FoxP3+ within CD3+ T lymphocyte population, illustrates a higher Treg frequency in AIH liver tissue compared to non-AIH liver tissue. c: Ki67 expression was lower in Treg from AIH liver tissue compared with non-AIH liver tissue, but similar when comparing Tcon. Flow cytometry plots show a representative sample from each group, graphs show aggregate data for all samples tested. ns, non-significant, * P < 0.05, ** P < 0.01 by one way ANOVA with Tukey’s multiple comparison test or by unpaired t-test for comparisons of 3 or 2 groups, respectively.
Intrahepatic Treg in AIH have enhanced the expression of CTLA4 and PD1
We next assessed the phenotype of Treg from AIH, non-AIH noncirrhotic, and non-AIH cirrhotic liver. We observed significantly higher CTLA4 expression in AIH compared with non-AIH non-cirrhotic or cirrhotic liver [CTLA4 average MFI (ratio to CTLA4 MFI of naïve Tcon), 37.31, 15.96, and 16.05, respectively, P < 0.05] (Fig. 2a). Otherwise, expressions of other functional markers, including FoxP3, CD39, ICOS, and CD25 (Figs 1b and 2a–c), were broadly similar. Likewise, CD28 expression was maintained (Fig. 2d), suggesting that despite the high expression of CTLA4, potential costimulation via CD28 may still be possible. Further subanalysis, separating (sub)acute AIH from cirrhotic AIH, showed similar trends, although with a trend to greater FoxP3, CD39, and ICOS expression in the acute setting and a trend of reduced CD28 in Treg in cirrhotic AIH (Supplementary Figure S3).
Comparison of the phenotype of CD4 + CD45RA-CD25 + FoxP3+ Treg from liver tissue. Comparison of a: CTLA4 expression between liver tissue from patients with AIH to those without. b: CD39 expression c: ICOS expression d: CD28 expression. Flow cytometry plots show a representative sample from each group, graphs show aggregate data for all samples tested with MFI normalized to an internal negative population (naive Tcon (CD3 + CD4 + CD45RA + FoxP3−)) where stated. ns, non-significant, * P < 0.05, by one way ANOVA with Tukey’s multiple comparison test.
PD1 expression was enhanced in Treg from AIH livers compared with non-AIH noncirrhotic and cirrhotic liver; on average, 71.2% of Treg expressed PD1 vs 43.6% and 45.4%, respectively (P < 0.05). This suggested that in AIH, the majority of Treg express PD1 and CTLA4 to a higher level compared with non-AIH settings (Fig. 3a). This observation was specific to Treg and not seen in Tcon populations from the same liver samples (Fig. 3b). The principle elevation in Treg PD1 was seen in those with active inflammation, compared with less active, cirrhotic AIH (Supplementary Figure S4).
Comparison of Treg and Tcon CTLA4 and PD1 expression in liver tissue. a: CD4 + CD45RA-CD25 + FoxP3+ Treg and b: CD4 + CD45RA-FoxP3− memory Tcon expression of PD1 and the frequency of CTLA4 + PD1+ subsets, comparing AIH to noncirrhotic, non-AIH, or non-AIH cirrhotic liver. Flow cytometry plots show a representative sample from each group, graphs show aggregate data for all samples tested. ns, non-significant, * P < 0.05, by one way ANOVA with Tukey’s multiple comparison test.
In AIH, hepatic Tcon had elevated HLA-DR expression
We next tested whether Tcon had differences in phenotype comparing AIH and non-AIH liver. We observed a significant increase in HLA-DR expression in AIH compared with non-AIH noncirrhotic and cirrhotic Tcon (mean: 18.6%, 10.3%, and 10.1%, respectively, P < 0.05) (Fig. 4a), suggesting chronic Tcon activation in AIH. Notably, this was observed in the AIH cirrhosis patients undergoing transplantation for chronic liver disease, all but one of whom met conventional complete biochemical response criteria and had minimal inflammatory activity on histological examination (Table 1). While there was a trend toward increased CTLA4 and CD39 in the AIH group, which may suggest evidence of recent activation, no significant differences in CD39, CD28, ICOS, CTLA4, or PD1 expression in Tcon were observed (Figs 3b and 4a–e). Subanalysis, separating (sub)acute AIH from cirrhotic AIH, showed similar trends (Supplementary Figure S5), and in acute AIH, Tcon more frequently expressed CD39, with a trend increasing for CTLA4, again likely representing acute activation.
Comparison of CD4 + CD45RA-FoxP3− memory Tcon activation and phenotype between AIH liver and noncirrhotic, non-AIH, and cirrhotic liver. Frequency of a: HLA-DR expression b: CD39, c: CD28, d: ICOS, and e: CTLA4 expression. Flow cytometry plots show a representative sample from each group, graphs show aggregate data for all samples tested. ns, non-significant, * P < 0.05, by one way ANOVA with Tukey’s multiple comparison test.
CD28 ligand availability on circulating immune cells isolated from the liver
As we had observed an increase in Treg frequency and expression of CTLA4, which have a major role in the control of availability of CD80 and CD86, and evidence of ongoing Tcon stimulation in AIH, we next explored whether there were differences in the availability of CD80 and CD86 on monocytes and B cells that had been exposed to the liver microenvironment. We observed that CD14 + HLADR+ monocyte frequencies were similar in AIH and non-AIH liver samples (Fig. 5a). However, CD80, which is typically absent or minimally expressed in peripheral blood monocytes [24], was commonly observed on hepatic monocytes with a trend to a greater frequency of CD80-positive monocytes in AIH compared with non-AIH, noncirrhotic liver, suggesting differentiation and activation in tissues that was more pronounced in AIH. As expected, CD86 expression was near universal in monocytes, but with significantly higher MFI in AIH compared with non-AIH liver (normalized against internal negative population MFI) (Fig. 5b). Subanalysis, separating (sub)acute AIH from cirrhotic AIH, showed similar trends (Supplementary Figure S6a–e).
Comparison of intrahepatic monocyte and B cell populations between AIH liver and noncirrhotic, non-AIH, and cirrhotic liver. a: frequency CD14 + HLA-DR+ monocytes. b: CD80 and CD86 expression by monocytes demonstrating maintained frequency and intensity of CD80 expression and maintained frequency and increased intensity of CD86 expression by monocytes in AIH liver. c: Frequency CD19 + HLA-DR + B cells; b: CD80 and CD86 expression in B cells demonstrating maintained frequency of CD80 and CD86 expression by B cells in the liver in AIH. Flow cytometry plots show a representative sample from each group, graphs show aggregate data for all samples tested with MFI normalized to an internal negative population (CD80/CD86-negative CD3+ T lymphocytes) where stated. ns, non-significant, * P < 0.05, by one way ANOVA with Tukey’s multiple comparison test.
Similar to monocytes, B cell frequencies in AIH and non-AIH liver were similar, and B cells had preserved levels of CD80 and CD86 in AIH compared with non-AIH tissue (Fig. 5c and d), again with similar trends when subgrouped by (sub)acute and chronic AIH (Supplementary Figure S6f–h). Overall, these observations implied that there was a relative excess of Treg and the effector molecules capable of controlling CD80 and CD86 in AIH, but nonetheless, CD80 and CD86 levels were maintained, suggesting a possible imbalance in Treg CD80 and CD86 control and inflammatory drivers of CD80 and CD86.
Intrahepatic Treg from patients with AIH remained functionally capable of CD80 transendocytosis
As we had demonstrated continued CD80 and CD86 availability in AIH despite high levels of phenotypically active Treg, we tested whether the Treg had the capacity to transendocytose CD80 from model APCs, a critical strategy for CD80 control. In our assay, acquisition of GFP-labelled CD80 from CHO cells by FoxP3+ Treg was assessed. We observed that Treg from AIH liver were readily stimulated with CD80 and soluble anti-CD3, upregulating CD25 expression, suggesting that even in the presence of high CTLA4 expression, they remained responsive to CD28 costimulation (Fig. 6a). Hepatic Treg from AIH liver tissue acquired GFP-CD80 at a level similar to healthy peripheral blood Treg (total GFP fluorescence intensity: 10 173 vs 10 458, P = 0.94) (Fig. 6b and c). This acquisition was suppressed by blocking with anti-CTLA4 antibody and abrogated in the absence of CD80, demonstrating the specificity of the assay (Fig. 6b and c).
Functional assessment of CD80 transendocytosis by Treg comparing intrahepatic Treg from patients with AIH to peripheral blood Treg from healthy donors. a: Total memory CD4 T cell expression of FoxP3 and CD25 after 16 hours stimulation in vitro with anti-CD3 antibody with and without CD80 and with and without blocking anti-CTLA4 antibody b: representative flow cytometry plots from each set of conditions, demonstrating CD80-green fluorescence protein (GFP) uptake, as a marker of transendocytosis, and CTLA4 expression within FoxP3+ Treg Treg after 16 hours stimulation in vitro. c: Total fluorescence intensity of GFP in CD4 + CD45RA-CD25 + FoxP3+ Treg after 16 hours stimulation, reflecting acquisition of CD80-GFP from donor CHO cells. Flow cytometry plots show a representative sample from each group, graphs show aggregate data for all 18 peripheral blood samples and 6 liver samples tested. nd, no difference by multiple independent T tests.
CD80 transendocytosis was enhanced by IL10 or IL2
We had observed preserved functional capacity for CD80 transendocytosis in hepatic Treg from patients with AIH. Impaired IL10 production and IL2 availability in the liver have been demonstrated in AIH [4, 25], and in murine models, an IL2-mutein increases Treg transendocytosis of CD80 and CD86 [26]. Therefore, we next tested whether CD80 transendocytosis activity could be modulated by these cytokines. We observed that peripheral blood Treg from healthy donors had significant increases in CD80-GFP acquisition from model APCs with the addition of 20 ng/ml IL10 (TFI 9253 vs 13,368, P < 0.01), which was abrogated by the presence of blocking anti-IL10 receptor (anti-CD210) antibody (Fig. 7a and b). IL10’s effect on TE was dose-dependent with an EC50 of 6.8 ng/ml (Fig. 7c). Similarly, addition of 750 IU IL2 was associated with a significant increase in CD80-GFP acquisition (TFI 9253 vs 12 087, P < 0.05) by Treg from model APCs (Fig. 7d and e).
Effect of IL10 and IL2 on CD80 transendocytosis by peripheral blood CD3 + CD4 + CD25 + FoxP3+ Treg from healthy donors. a: Representative flow cytometry data demonstrating green fluorescent protein (GFP)-labelled CD80 acquisition by transendocytosis in Treg after 16 hours stimulation in vitro with and without 20 ng/ml IL10, 20 ng/ml IL10 and 20 μg/ml anti-CD210 (IL10 receptor blocking antibody) and in the absence of CD80 as GFP intensity against total cell CTLA4, as stated. b: Aggregate data from 11 independent experiments. c: Dose response curve of IL10 concentration and total CD80-GFP acquisition by Treg after 16 hours stimulation. d: Representative flow cytometry data, and e: Aggregate data from at least four independent experiments demonstrating CD80-GFP uptake in Treg after 16 hours, similarly to (a) but comparing with and without 750 IU/ml IL2. ns, non-significant, * P < 0.05, ** P < 0.01 by one way ANOVA with Tukey’s multiple comparison test.
Discussion
Treg are critical for the maintenance of self-tolerance, and their dysfunction or depletion has been implicated in many autoimmune conditions, including AIH. However, data regarding Treg frequency in AIH are contradictory; they differ with treatment, disease stage, degree of inflammation, and potentially ethnicity, and reports have been based on peripheral blood analyses [4–7, 27–30]. Assessment of hepatic Treg in AIH by immunohistology techniques has demonstrated increased Treg frequency in AIH, which falls with immunosuppressive treatment and treatment response [27, 31–33]. Notably, changes in intrahepatic Treg frequency and phenotype are not reflected in peripheral blood analyses [32]; hence, it is important to study liver-derived Treg directly. Functional defects in peripheral blood Treg have been reported in AIH, including defective IL10 production, impaired IL2 responses, and defective adenosine production through impaired upregulation of CD39, an ectonucleotidase involved in the production of immunosuppressive adenosine [4, 6, 28, 34]. However, dissecting the impact of pharmacological treatment on Treg from inherent Treg (dys)function and understanding whether these peripheral blood Treg changes are relevant in the liver environment remains a challenge. Here, we report the phenotype of intrahepatic Treg and Tcon in advanced stages of AIH with (sub)acute liver failure or cirrhosis when patients were undergoing liver transplantation, compared with non-AIH liver both with and without underlying liver disease. We also demonstrate functional assessment of Treg from the intrahepatic compartment in AIH, with respect to their capacity for CD80 transendocytosis.
In the advanced AIH liver tissue assessed, Treg were increased as a proportion of the total lymphocyte pool compared with other liver tissue settings, with trends to increase in both acute and chronic AIH, implying that a paucity of Treg in the liver microenvironment is not an obvious feature of AIH. This is consistent with a prior study reporting greater frequencies of FoxP3+ Treg from the liver of patients with AIH and other inflammatory conditions, compared with normal liver tissue [35]. In our study, Treg frequencies were maintained irrespective of the presence of histological or biochemical inflammatory activity. It is unlikely this was due to changes associated with cirrhosis, as it was not observed in cirrhotic alcohol–related liver disease tissue, and a similar pattern was seen in actively inflamed noncirrhotic AIH (acute disease) and cirrhotic AIH. These observations suggest that in advanced stages, AIH is not characterized by a numerical deficiency of Treg nor a failure of Treg to home to the liver.
The phenotype of Treg from cirrhotic or (sub)acute liver failure liver tissue with AIH differed from that of noncirrhotic, non-AIH liver tissue and cirrhotic, non-AIH liver tissues. We observed a significant increase in Treg CTLA4 and PD1 in hepatic Treg in AIH compared with both cirrhotic and noncirrhotic non-AIH liver. This suggests that the observed expression of PD1 and CTLA4 in peripheral blood Treg in AIH [8] is both present at the site of active inflammation and significantly different from non-AIH contexts. Furthermore, our data suggest that the PD1 + CTLA4 high Treg phenotype persists in the liver, despite the proposed reduction in PD1 expression observed following immunosuppressive treatment in peripheral blood [8]. We observed that Treg display a broadly activated memory Treg phenotype with preserved expression of ICOS, CD39, CD25, FoxP3, and CD28 and preserved functional activity with the capacity to activate and undertake CD80 transendocytosis, strongly implying that they are not exhausted. PD1 expression is known to enhance the development, homeostasis, and function of Treg [36, 37], suggesting a critical role for PD1 in competent Treg function. The maintained expression of CD39 in hepatic Treg in AIH suggested that although previously shown to be low in peripheral blood [6], populations of these cells are preserved in the liver microenvironment in AIH. However, their reduction in the periphery and failure to adequately control Th17 cells [6] may still be important in the initiation or potentiation of autoreactive immune responses outside of the liver.
The capacity of Treg freshly isolated from tissue to perform transendocytosis of CD80 from a model APC represents a useful, reproducible measure of Treg stimulation and one axis of Treg function [38, 39]. It allows ex vivo assessment of cells isolated from different disease states and reflects one of the critical effector mechanisms that are employed by Treg in maintaining tolerance [18].
CTLA4 is strongly implicated in the maintenance of self-tolerance in the liver. CTLA4 is a homolog of CD28, and both receptors share the same two ligands, CD80 and CD86, although CTLA4 binds both with higher affinity than CD28. CTLA4 negatively regulates CD28 function by competing with CD28 to bind the ligands and by physical removal of CD80 and CD86 from APCs, reducing the costimulation signals available to T cells [40]. Genetic studies have demonstrated an association between AIH and an enhancer variant that reduces the expression of CTLA4 [3], and targeted gene studies support associations between CTLA4 variants and AIH [41–43]. Furthermore, both treatment with anti-CTLA4 immunotherapy for cancer and CTLA4 haploinsufficiency are associated with inflammatory liver complications [19, 44], demonstrating the importance of CTLA4 in immune control in the liver. Further evidence of the importance of this regulatory locus is seen with a murine model of CD28 agonism resulting in an immune-mediated hepatitis [20]. Therefore, the balance of CTLA4 and the CD28 costimulation pathway appears to be critical in the regulation of immune tolerance in the liver. Treg in the liver are found in close physical association with dendritic cells [35], one of several APCs in the liver that express CD80 and CD86, and are appropriately localized in tissues.
We observed that immune cells circulating to the liver, which typically express CD80 and CD86, had at least maintained or increased expression of CD80 and CD86 in these states of advanced AIH disease. Due to the presence of a higher proportion of Treg with greater CTLA4 expression, it might be expected that these levels would be lower, and this observation suggests a possible imbalance between the availability of CD80 and CD86 and Treg function. A similar observation in another autoimmune liver disease, primary biliary cholangitis (PBC), where greater hepatic APC expression of CD80 and CD86 was reported [45], suggests that this may be a feature of hepatic autoimmunity. In future work, the factors regulating CD80 and CD86 should be explored in autoimmune hepatitis, as the upregulation of CD80 and CD86 is part of the inflammatory response to enable T cell costimulation [46]. Why CD80 and CD86 levels are preserved or relatively elevated could be related to genetic variants [47, 48], the treatments received by patients, the result of chronic inflammatory stimulation, and liver-specific expression (CD80 and CD86 are expressed and dynamically regulated by IL10 in liver-specific cells such as liver sinusoidal endothelial cells [15, 49, 50]). Elevated CD86 expression in PBC was inversely associated with Treg frequency, and in vitro Treg were less capable of controlling CD86 levels [45]. Although we demonstrated preserved Treg transendocytosis capacity, these data support the concept of Treg control of costimulation being critical in the regulation of immune responses in the human liver. However, the pathogenesis of AIH is likely multifactorial, and the observed imbalance of CD80 and CD86 availability and Treg activity and ligand control is likely one aspect of a complex series of immunological and other factors resulting in disease.
Our study demonstrated nonexhausted, active Treg, which were competent at CD80 transendocytosis, but a relative excess of CD80 and CD86 in AIH; therefore, we studied the potential impact of environmental cytokines on Treg transendocytosis activity. In AIH, levels of IL2 in the liver are low, and Treg have impaired responses to IL2, and low levels of IL10 are secreted [4, 25]. We demonstrated that CD80 transendocytosis can be increased following treatment with IL2 or IL10, which suggests a potential mechanism that may either underlie the imbalance between Treg frequency and phenotype compared with CD80 and CD86 availability or may serve as potential therapeutic avenues. Although we have not demonstrated that there is aberrant signalling in the IL2 or IL10 pathways in the liver in AIH there is interest in therapeutic manipulation of these pathways. Low-dose IL2 treatment selectively enhances Treg phenotype and function in autoimmune liver diseases [51, 52] hence have efficacy in the management of AIH [53]. Interestingly, a role for IL2 in upregulating transendocytosis by Treg illustrates the important interactions between the CD25-IL2 pathway and the regulation of CD80 and CD86 and IL10. Recent data have shown that long-lived potent IL2 muteins can enhance Treg transendocytosis in vivo and impair dendritic cell maturation by the downregulation of class II MHC via an IL10-dependent pathway [26]. These observations suggest complex proregulatory interactions between the CTLA4, IL2, and IL10 pathways, which may have the potential to restore control of the activated, proinflammatory environment seen in the liver in AIH.
We demonstrated that hepatic Tcon in AIH had evidence of recent, chronic activation with high levels of HLA-DR expression and trends towards more CD25, CD39, and CTLA4 expression, particularly in the acute setting. However, these trends were observed even in patients meeting histological remission and biochemical response criteria, demonstrated by the absence of significant inflammatory infiltrate on histological assessment and normal ALT and IgG [23]. Others have previously reported that ongoing inflammatory activity can be identified in patients reaching conventional biochemical treatment response criteria and that this is associated with progressive disease and elevated mortality risk [54]. Furthermore, alterations in circulating immune cell populations in AIH are not necessarily restored with conventional treatments, despite achieving biochemical response [55], implying persistent immunological changes in AIH. These observations imply that immunological activity persists despite patients meeting conventional treatment response criteria. Therefore, improved biomarkers of treatment response, including intrahepatic immune parameters, should be sought with the aim of defining deep immunological remission and testing whether this is associated with differences in treatment outcome.
This study is not an exhaustive characterization of the intrahepatic immune microenvironment in AIH due to the small amounts of tissue available. We focused on specific markers relevant to the CD28 axis in CD4 T cells; hence, wider perturbations of Treg, CD4, CD8, and other immune cell subsets may exist. Additionally, due to the destructive nature of immune cell isolation from these samples, we were unable to assess the phenotype and expression of costimulatory and other proteins in liver-specific cells, such as hepatocytes, LSEC, Kupffer cells, and hepatic dendritic cells. However, the observations here suggest that there is an imbalance in the control of the CD28 pathway in AIH that warrants further exploration as both a route to understanding disease pathogenesis and potential druggable treatment targets. The tissue available for study was for patients undergoing liver transplantation and therefore represents an advanced stage of AIH. Therefore, it is possible differing immune phenotypes and dysregulation may occur at the initiation of disease, in earlier phases or in milder disease.
We did not explicitly demonstrate tissue residency of the Treg assessed in these experiments, and some of the isolated Treg may represent transient cells from the hepatic circulation. However, due to the flushing and rinsing of samples this is likely to be a minority of the cells. Tissue-resident Treg, typically defined by markers such as CD69 and CD103, show a similar range of transcriptional profiles across different nonlymphoid organs, and there is evidence for transience of tissue residency [56], suggesting that disease-specific Treg changes are either induced in situ at the site of disease or represent a generalized Treg difference in patients. Within the broad group of CD25 + FoxP3+ Treg, significant heterogeneity exists from circulating vs tissue-resident Treg, thymic vs peripherally derived Treg, and differing functional states such as naive, effector, central memory, and effector memory Treg [57]. Future work will be required to explore specific subsets of tissue Treg in AIH.
In this study, we compared the phenotype of intrahepatic T cells from patients with AIH (both cirrhotic and noncirrhotic) with two control groups. Noncirrhotic, non-AIH liver tissue represents the absence of both features, which could influence phenotype, and cirrhotic, non-AIH to account for the influence of cirrhosis. The noncirrhotic, non-AIH liver tissue was derived from sources that may not represent truly healthy liver, including deceased donors (perfusate or donated but nontransplanted liver) or from patients often with malignancy (surgical resection margins). However, no consistent differences were observed between the tissue sources, suggesting comparable phenotypes. The use of alcohol-related cirrhosis as a cirrhotic control was selected as the patients were abstinent from alcohol use to be eligible for transplantation; hence, the influence on immune cell phenotype from alcohol consumption should be minimized. A further caution in the interpretation of these data is that there is interindividual variability in some observations, and the number of samples in the study is small. Although variation may be expected due to the variation in disease activity, course, and stage between individuals, the overall observations are suggestive of patterns of difference in the phenotype of immune cells in the liver in AIH.
There is an unmet need for new biomarkers to risk-stratify patients with AIH and to identify predictors of incomplete response to treatment (both conventional and novel immunological markers) to allow treatment intensification in those who require it and avoidance of excess treatment in those who do not. Approximately 20% of patients have inadequate response or intolerance to currently available treatments, and in real-world studies >40% of patients are not in remission, despite pharmacotherapy [58], illustrating the need for better monitoring and therapeutics. Understanding the immunopathogenesis of AIH may identify potential new treatment targets, such as the CD28 pathway, new measures of remission, and prognostic markers, thereby allowing personalization of treatment for patients with AIH.
In summary, we have demonstrated that in hepatic tissue from patients with advanced AIH, there is a relative excess of Treg, with a PD1, CTLA4 bright phenotype. These Treg are functional, stimulate readily, and can perform CD80 transendocytosis in a model system, implying that they have the capacity to competently regulate the CD28 costimulation axis. However, we observed an excess of CD80 and CD86 on immune cells in the liver, implying a functional imbalance in the control of costimulatory ligands. This suggests possible mechanistic and therapeutic targets to be explored, including targeting of CD80 and CD86, CD28 signalling, and enhancing Treg function to improve control of costimulation ligand availability. However, AIH has multiple pathogenic mechanisms, and these observations likely represent one of many contributing pathways.
Supplementary Material
uxag013_Supplementary_Data
The reference list from the paper itself. Each links out to its DOI / PubMed record.
- 1Heneghan MA, Yeoman AD, Verma S, Smith AD, Longhi MS. Autoimmune hepatitis. Lancet (London, England) 2013, 382, 1433–44.23768844 10.1016/S 0140-6736(12)62163-1 · doi ↗ · pubmed ↗
- 2de Boer YS, van Gerven NMF, Zwiers A, Verwer BJ, van Hoek B, van Erpecum KJ, et al Genome-wide association study identifies variants associated with autoimmune hepatitis type 1. Gastroenterology 2014, 147, 443–52.e 5.24768677 10.1053/j.gastro.2014.04.022 · doi ↗ · pubmed ↗
- 3Li Y, Sun Y, Liu Y, Wang B, Li J, Wang H, et al Genome-wide meta-analysis identifies susceptibility loci for autoimmune hepatitis type 1. Hepatology 2022, 76, 564–75.35184318 10.1002/hep.32417 · doi ↗ · pubmed ↗
- 4Liberal R, Grant CR, Holder BS, Cardone J, Martinez-Llordella M, Ma Y, et al In autoimmune hepatitis type 1 or the autoimmune hepatitis-sclerosing cholangitis variant defective regulatory T-cell responsiveness to IL-2 results in low IL-10 production and impaired suppression. Hepatology 2015, 62, 863–75.25953611 10.1002/hep.27884 · doi ↗ · pubmed ↗
- 5Longhi MS, Ma Y, Bogdanos DP, Cheeseman P, Mieli-Vergani G, Vergani D. Impairment of CD 4(+)CD 25(+) regulatory T-cells in autoimmune liver disease. J Hepatol 2004, 41, 31–7.15246204 10.1016/j.jhep.2004.03.008 · doi ↗ · pubmed ↗
- 6Grant CR, Liberal R, Holder BS, Cardone J, Ma Y, Robson SC, et al Dysfunctional CD 39(POS) regulatory T cells and aberrant control of T-helper type 17 cells in autoimmune hepatitis. Hepatology 2014, 59, 1007–15.23787765 10.1002/hep.26583 PMC 6377365 · doi ↗ · pubmed ↗
- 7Liu Y, Yan W, Yuan W, Wang P, Huang D, Luo X, et al Treg/Th 17 imbalance is associated with poor autoimmune hepatitis prognosis. Clinical Immunology 2019, 198, 79–88.30453094 10.1016/j.clim.2018.11.003 · doi ↗ · pubmed ↗
- 8Jeffery HC, Braitch MK, Bagnall C, Hodson J, Jeffery LE, Wawman RE, et al Changes in natural killer cells and exhausted memory regulatory T cells with corticosteroid therapy in acute autoimmune hepatitis. Hepatol Commun 2018, 2, 421–36.29619420 10.1002/hep 4.1163 PMC 5880196 · doi ↗ · pubmed ↗