Measuring Party Identification in Public Opinion Surveys of Americans
Joshua J Dyck, Jack Santucci

TL;DR
This paper examines how different survey methods affect the measurement of political independents in the U.S., finding that self-administered surveys may better capture true independents.
Contribution
The study introduces evidence that explicit response options in self-administered surveys yield more accurate measures of pure independents.
Findings
Self-administered surveys report higher numbers of pure independents compared to live-interview surveys.
Explicit response options correlate more strongly with latent ideology and party ratings.
The study suggests that including explicit options improves the accuracy of measuring party identification.
Abstract
How should we measure “pure” or “true” independents? For years, the respective item required a respondent to volunteer that answer. Recent surveys have moved toward presenting it explicitly. Those that do produce estimates of pure independents that are much larger than in past surveys. We present evidence of this phenomenon across multiple surveys and ask: Are self-administered surveys overcounting independents, or are traditional live-interviewer surveys undercounting independents? We answer that question by comparing live-interview and self-administered samples from the 2012 and 2016 American National Election Studies, by undertaking tests to rule out mode effects (including an experiment), and by seeing which question wording correlates more strongly with measures of latent ideology, vote choice, and ratings of the parties. Our findings suggest that surveys that include an explicit…
Click any figure to enlarge with its caption.
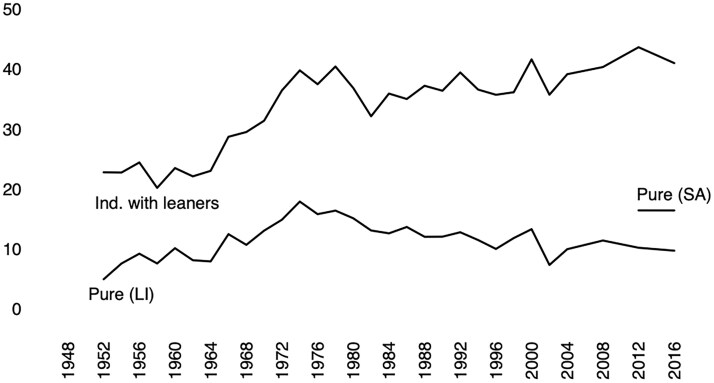 Figure 1
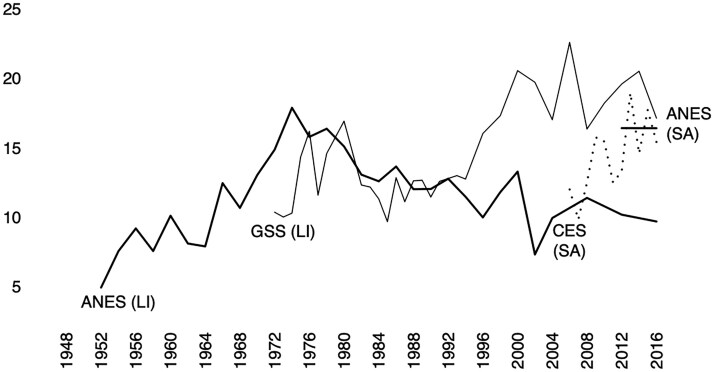 Figure 2
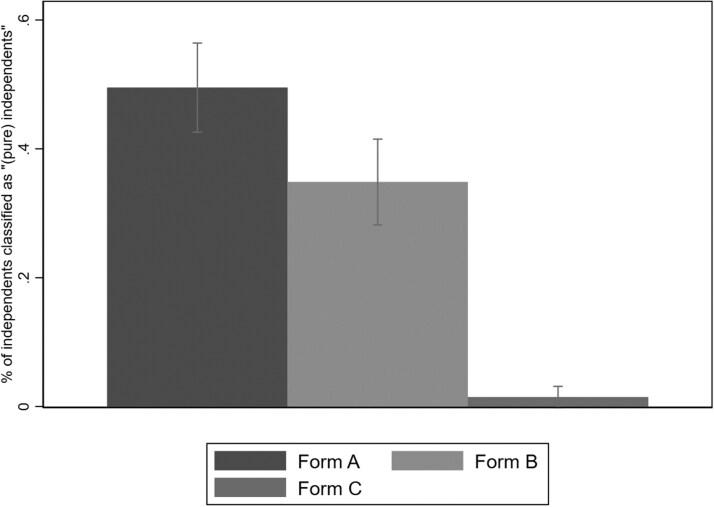 Figure 3
| When measuring 7-point Party ID, the branching question for independents codes “(pure) independents” using a… | ||
|---|---|---|
| Survey type |
Forced-choice option (e.g., “neither” is a listed response option) |
Volunteered response (e.g., respondents must volunteer a response other than those offered to them or skip the question) |
| Live interviewer |
A (e.g., GSS) |
B (e.g., most live-interviewer phone surveys, including the ANES) |
| Self-administered |
C (e.g., ANES web sample since 2012, CES/CCES) |
D (e.g., Pew American Trends Panel) |
| Treatment | Follow-up question text | Response options |
|---|---|---|
| Form A | Do you think of yourself as closer to the Democratic or Republican Party? |
The Democratic Party The Republican Party Neither Not sure |
| Form B | Do you think of yourself as closer to the Democratic or Republican Party? |
The Democratic Party The Republican Party Not sure |
| Form C | Do you think of yourself as closer to the Democratic or Republican Party? |
The Democratic Party The Republican Party |
| 2012 (f2f sample) | 2012 (internet sample) | ||||||
|---|---|---|---|---|---|---|---|
| Obama | Romney | Other | Obama | Romney | Other | ||
| Strong Dem | 98.5 | 1.3 | 0.2 | Strong Dem | 97.8 | 1.2 | 1.0 |
| Weak Dem | 83.5 | 15.0 | 1.5 | Weak Dem | 82.9 | 14.9 | 2.1 |
| Ind, leans Dem | 85.2 | 12.5 | 2.3 | Ind, leans Dem | 90.1 | 5.6 | 4.2 |
| Pure Ind | 43.8 | 51.1 | 5.1 | Pure Ind | 46.3 | 37.1 | 16.6 |
| Ind, leans Rep | 12.9 | 83.8 | 3.2 | Ind, leans Rep | 5.0 | 87.9 | 7.0 |
| Weak Rep | 12.6 | 85.9 | 1.5 | Weak Rep | 11.7 | 85.4 | 2.9 |
| Strong Rep | 3.8 | 96.2 | 0.0 | Strong Rep | 2.2 | 97.2 | 0.6 |
| LI 2012 | SA 2012 | LI 2016 | SA 2016 | |
|---|---|---|---|---|
| Ideology (1st dimension) | 1.047 (0.083) | 1.509 (0.056) | 0.644 (0.108) | 0.971 (0.062) |
| Ideology (2nd dimension) | 0.373 (0.074) | 0.812 (0.046) | 0.663 (0.103) | 0.794 (0.059) |
| R2 | 0.074 | 0.192 | 0.050 | 0.098 |
| Adjusted R2 | 0.073 | 0.191 | 0.048 | 0.098 |
| N | 2033 | 3857 | 1166 | 3081 |
| Live interviewer (Pure Ind is a volunteered response) | Self-admin (Pure Ind is a forced-choice option) | Point change | % change | |
|---|---|---|---|---|
| Gender | ||||
| % Female | 11.1 | 16.0 | 4.9 points | 44.1 |
| % Male | 9.2 | 16.9 | 7.6 points | 82.6 |
| Race | ||||
| % White | 9.4 | 15.6 | 6.2 points | 65.9 |
| % Black | 4.2 | 10.4 | 6.3 points | 150.0 |
| % Hispanic | 14.6 | 22.5 | 7.9 points | 54.1 |
| Education | ||||
| No HS degree | 18.3 | 27.2 | 8.9 points | 48.6 |
| HS degree | 14.5 | 17.3 | 2.8 points | 19.3 |
| Some college | 8.5 | 15.3 | 6.8 points | 80.0 |
| College degree | 4.3 | 13.6 | 9.2 points | 214.0 |
| Graduate degree | 5.6 | 12.6 | 7.0 points | 125.0 |
Peer Reviews
No public reviews on file for this paper yet. If you reviewed it on a platform where reviews are public (OpenReview, ICLR, NeurIPS, ICML), you can paste yours below so the community can read it here.
Videos
No videos yet. Explain this paper in a talk, walkthrough, or lecture? Add one.
Taxonomy
TopicsElectoral Systems and Political Participation · Survey Methodology and Nonresponse · Survey Sampling and Estimation Techniques
Introduction
“Do you think of yourself as closer to the Republican Party or the Democratic Party?”
Journalists and political scientists think about political independents in very different ways. In journalistic accounts, independents decide elections and are growing in number (Siders 2024). Political scientists generally see such accounts as sensationalism. Most independent identifiers “lean” toward either the Democratic or Republican Party (Keith et al. 1992), and independent identification for them is a way to hide their political commitments from friends (Klar and Krupnikov 2016). True or pure independents are actually scant in number and among the least-informed and -participatory groups in the electorate. What if the journalists are on to something? Might we have been measuring party identification poorly, pushing people into “leaner” bins who do not in fact lean? This paper presents evidence in favor of this “undercounting” claim. Said claim goes beyond the quality of journalism; partisanship may be the most important concept in the field of American political behavior (Campbell et al. 1960; Green, Palmquist, and Schickler 2002; Huddy, Mason, and Aaroe 2015).1
We use variation in survey practice to ask which way of measuring party identification is more accurate: putting the “(pure) independent” option before respondents or forcing them to offer it on their own.2 Assuming the centrality of party identification to people’s belief systems, this research question requires us to do two things. First, we need to show that larger shares of “(pure) independents” are not due to mode effects (i.e., using the internet). Second, we need to show that a measure based on an independent-inclusive item correlates more strongly with outcomes that are downstream of partisanship.
As we show below, surveys with the “(pure) independent” option systematically return much larger such populations than those without. To rule out mode effects, we point to the GSS (General Social Survey), which gives independents a “neither” option but uses live interviewers. Similarly, the CES (Cooperative Election Study) presents a “neither” option yet uses a self-administered (internet) format. We also summarize a survey experiment in which all respondents use the internet, but the treatment is the “neither” option. All of this casts doubt on mode effects.3 Then we use a 2012 switch in the way that the American National Election Study (ANES) asked about party ID to see which approach produces stronger correlates thereof. We find that the ANES item permitting independents to reject both parties is more strongly correlated with voting behavior, attitudes toward the parties, and a measure of latent ideology. These results suggest that it is a good idea to give respondents a “neither” or “independent” option at the second stage of standard party-ID questions, and it does not matter whether the survey is done online or with a live interviewer.
More broadly, as social scientists, we have been undercounting the share of “pure” independents for some time, pushing people into Democratic and Republican “leaner” categories. We mostly leave this measurement problem’s implications to the reader. However, we conclude with a call to pay more scholarly attention to independents, with the cautionary note that they are more numerous than commonly acknowledged in the literature.
The Evolving Measurement and Interpretation of Party Identification
The rise of online/self-administered surveys in the last twenty years has created variation in how party identification is measured. For more than 60 years, political scientists used the following branching item or something similar to it. First, respondents are asked:Generally speaking, do you usually think of yourself as a Republican, a Democrat, an independent, or what?
Those that answer Republican or Democrat are then asked about the strength of their identification:Would you call yourself a strong [Democrat/Republican] or not a very strong [Democrat/Republican]?
Those who identify as Independents or something else are asked a different question:Do you think of yourself as closer to the Republican Party or the Democratic Party?
Strong/Not Strong Democrats and Republicans form the outer bounds of the scale, points 1, 2, 6, and 7, respectively, in their answers to the first two questions. The third question fills out the middle of the scale. An independent or other-party identifier who says they lean toward the Democratic Party is a 3, and one who says they lean toward the Republican Party is a 5. Someone who volunteers the answer “no,” “neither,” “I’m an independent,” and so on, is classified as a 4, or what we normally call a “(pure) independent.”
The rise of online surveys created four possible states of the world for measuring party identification, and specifically for measuring “(pure) independents.” A survey can either be self-administered or have a live interviewer. Then, the branching question asked of independents can either put the option “no/neither/etc.” in front of respondents, or it can rely on the respondent to volunteer that answer. These states of the world are presented in table 1.
We call attention to cell D, when a survey is self-administered and the researcher wants to preserve the legacy surveys’ reliance on the volunteered response. This combination requires the researcher to give the respondent an alternative way to reject the binary choice of leaning. One way would be to provide the respondent with an open-ended option, while another would be to simply allow the respondent to skip the question. In practice, this has meant coding only skips as “pure independents,” effectively treating them as equivalent to the volunteered response in a live interview (Keeter 2019).
Most of what is written about independents is based on the approach in cell B. However, many researchers have begun using data based on the cell-C approach. Moreover, the field has not thought through the implications of variation in measurement of party identification, which is at the heart of the study of American political behavior (Campbell et al. 1960).
The distinction between “(pure) independents” and leaners is fundamental in public opinion research. In the 1970s, there was a growing trend in independent identification in the wake of the Vietnam War and Watergate scandal. Scholars posited a dealignment; Wattenberg (1998) argued that frustrated partisans began to shed their party identification as a rejection of both parties. Figure 1 shows the basic insight of the dealignment theorists. Americans increasingly began identifying as independent in the 1970s, and this trend has been relatively static over several decades, at least when we look only at the initial 3-point party identification response (ignoring the follow-up branch).
Percent of Americans who identify as Independent, 3-point and 7-point PID, 1952–2016 ANES (LI denotes a sample of respondents who were interviewed by a live interviewer, and SA denotes a sample who completed a self-administered survey. The graph distinguishes between Independents (with leaners included) and “(pure) independents.”
To be sure, political scientists have questioned much of dealignment theory. Keith et al. (1992) argued for a qualitative distinction between “leaning” and “pure” independents. Leaners, they argued, are better characterized as closet partisans because their voting behavior is not especially different from that of weak partisans. Independents who lean toward the Democratic Party act like Democrats, and those who lean toward the Republican Party act like Republicans. It is only those who are truly independent, the so-called “pure independents,” who act independently by voting for candidates of both parties and demonstrate unstable and inconsistent party loyalty rates. They also tend to act against stereotype by being the least informed and participatory group in American politics (Keith et al. 1992). This characterization, however, only holds for “(pure) independents,” not independent leaners. Leaners are partisans who are highly invested in keeping their partisanship a secret, and so they tend to be concerned with what others think and take steps to obfuscate their political identity (Klar and Krupnikov 2016).
Figure 1 begins to illustrate the measurement problem. Between 1952 and 2016, “(pure) independents” routinely have been estimated as 10–15 percent of the American public, as demonstrated in the lower time trend in figure 1.4 While the upper trend in the figure shows steep increase in independent identification starting in the 1970s (when we use the 3-point scale), pure-independent identification does not follow this same pattern (when we use the 7-point scale). Using the 3-point scale, we see that about 24 percent of Americans identified as independent between 1952 and 1968. However, after 1970, independent identification has averaged 36 percent of the public. But we do not see “(pure) independents” follow this pattern when we move to the 7-point scale. “(Pure) independents” were 9 percent of all Americans from 1952 to 1968, 13 percent of all Americans from 1970 to 2016, and 11 percent from 2000 to 2016.
Now consider the short trend beginning in 2012. This represents a move by the ANES to a two-pronged sampling approach with some respondents interacting with live interviewers and others filled out a self-administered web survey. This means that some respondents had their party identification measured using a cell-B approach (live-interview/volunteered-response) and others using a cell-C approach (self-administered/forced-choice).5 There is a clear difference in both years between “(pure) independents” in the self-administered/forced-choice (cell C) and live-interviewer/volunteered-response (cell B) versions of the ANES. “(Pure) independents” make up 16 percent of respondents in 2012 and 2016 in the self-administered/forced-choice sample (cell C) but just 10 percent in the live-interviewer/volunteered-response sample (cell B).
As a comparison point, the Cooperative Election Study (CES) codes party identification in the same way as the ANES online survey (i.e., table 1, cell C). Although the sampling strategy is slightly different,6 CES counts of “(pure) independents” look similar to those of the self-administered web version of the ANES, varying between 13 and 20 percent, depending on the year. This again suggests that self-administered and live-interviewer surveys are providing different measurements of party identification, particularly of “(pure) independents.”
The question remains: are differences in the estimates due to survey mode (self-administered vs. live-interview) or question wording (forced-choice vs. volunteered-response)? In the next section, we provide both observational and experimental evidence that this is a question-wording effect.
Are Different Estimates of Pure Independents Due to Question Wording or Mode?
We take two approaches to determining whether the root cause of the measurement difference in “(pure) independents” in 2012 and 2016 is the nature of the questionnaire or the survey mode. First, we compare the ANES measurement of party ID to other data collections with and without live interviewers, including the CES, GSS, and Pew. Second, we present data from an experimental approach to measuring party ID using an original survey that we commissioned from YouGov. Overall, we find strong support for a question effect. Self-administered survey modes constrain how party ID may be asked, but it is the question, not the actual survey mode, that appears to be leading to differences in the measurement of party ID. When a forced-choice response option is offered that can be coded as “(pure) independent,” rather than when it is a volunteered response option, surveys are likely to report more independents. This is true of both online surveys and those administered by live interviewers (i.e., cells A and C). Our experimental evidence also suggests that it is difficult to replicate the conversational structure of branching party identification in web or self-administered surveys: offering the “neither” option leads to more respondents identifying as “(pure) independents,” and counting only skips almost entirely eliminates the category.
Comparing the ANES to Other Surveys
As it turns out, there is a lot to be learned by looking at the variation in how survey organizations have approached measuring party identification. As survey organizations like Pew and the ANES have dealt with the move to online/web self-administered surveys, they faced the question of how to adjust their measurement strategy for party identification. Different organizations came to different conclusions. Additionally, the GSS stands as a bit of an outlier as a live interviewer survey. GSS respondents are provided a forced-choice response option of “neither,” allowing them to identify as “(pure) independents,” departing from the ANES and others who require a volunteered response. Returning to table 1, this places Pew’s American Trends Panel in cell D and the GSS in cell A, allowing for meaningful comparisons across surveys.
In figure 2, we present a comparison of the ANES data with both the CES archive (back to 2006) and the GSS archive from 1970 to 2016. The ANES (LI) sample codes “(pure) independents” through a volunteered response, while ANES (SA), CES (SA), and GSS (LI) all provide an option for respondents to self-identify as pure independents by selecting “neither” in response to the branching question “Do you lean more toward the Democratic or Republican Party?” As you can see, little difference results from the approaches of the GSS (cell A) and ANES (cell B) through the 1970s and 1980s. However, starting in the 1990s, we see a clear divergence. Surveys that let respondents self-categorize explicitly as pure independents routinely have 50–100 percent more such people than surveys using a volunteered response.
Pure Independents in the ANES, GSS, and CES, 1952–2016 (LI denotes a sample of respondents who were interviewed by a live interviewer, and SA denotes a sample who completed a self-administered survey).
The Pew Research Center’s data offer more evidence for a question-wording effect. Pew’s online survey is called the American Trends Panel (Pew Research Center 2019). In it, Pew does not provide respondents who say they are independent with an option to report “no,” “neither,” or “pure independent” in the subsequent branching question. Respondents are forced to choose Democrat, Republican, or to skip the question. The result has been a drastic decrease in the already small percentage of respondents classified as pure independent, from 7–10 percent in live interviewer surveys to typically less than 5 percent of the data in their self-administered web surveys. Using some recent Pew data,7 those who are classified as party ID refusals/skips make up only 271 of the 12,045 responses, 2.3 percent.8 Because of this choice, Pew no longer reports “(pure) independent” in their cross-tabulation reports in data that uses their web surveys since their measurement strategy (self-administered web survey, no forced-choice response option given for “(pure) independent”) does not allow for the meaningful classification of this category.
Examining the strategies of various survey research organizations provides evidence for a question effect, not a mode effect. To be sure, the need to change the party ID question approach stems from mode limitations for self-administered surveys, but the results of the various strategies to measure partisanship suggest that variations in question wording are meaningfully changing aggregate estimates of the size of the independent population.
Experimental Evidence
Although evidence from the prior section strongly supports that differences in measurement of “(pure) independents” between surveys are being driven by question-wording and not mode effects, we use an experiment to bolster the case.9 Our experiment holds mode constant and varies the sets of response options offered on the independent follow-up question.
As part of a 2019 survey conducted by YouGov, 1,800 respondents answered an initial party identification question that asked, “Generally speaking, do you think of yourself as a …?” and were offered the following as response options: Democrat, Republican, Independent, Other, and Not sure. Another possible response was skipping this question altogether. Those selecting Democrat or Republican were then questioned on whether they call themselves strong or not-so-strong partisans. All other subjects (those selecting Other, Not sure, or skipping) were randomly assigned with equal probability (p = 1/3) to three different follow-up question formats. These formats varied by which combination of Neither and/or Not sure response options were included, alongside closeness to the major parties. Table 2 illustrates the question format treatments, referred to as Form A, Form B, and Form C.
Form A shows two ways to avoid major-party identification, Form B offers one, and Form C does not list any non-major-party options (though in the latter, along with Forms A and B, respondents are coded as “(pure) independents” when they skip the question). A total of 605 respondents did not identify with either of the major parties on the initial partisanship question. Only these individuals were involved in the treatment assignment process, which resulted in 203 in Form A (includes “neither” and “not sure”), 198 in Form B (includes “not sure”), and 204 in Form C (excludes both). Those who answered as seeing themselves closer to the Democratic (Republican) Party were coded as Democrat (Republican) on the outcome variable for this experiment. Common partisanship coding practices dictate that these “leaners” are treated as partisans. Subjects answering with Neither or Not sure, as well as those showing up as missing after having answered the initial partisanship question (i.e., skipping the follow-up question), were coded as “(pure) independent.”
In figure 3, we show the percentage of independent identifiers from the 3-point party ID scale who are then subsequently coded as true or pure independents, split out by treatment status. Bars include 95 percent confidence intervals. The results from this experiment offer evidence that question format matters tremendously for rates of independent identification on partisanship survey questions. In form A, when those initially identifying as independent are offered lean options and also both Neither and Not sure as responses, nearly half (49.3 percent) are classified as “(pure) independents.” That independent identification rate drops to 34.8 percent in Form B when Neither is no longer offered and plummets further to a mere 1.5 percent in Form C, when subjects can only escape major-party identification by skipping the follow-up question entirely.10
Question design affects how many independents are classified as “pure independents.” Data are from a 2019 survey conducted by YouGov. Percent of Independents who identify as “(pure) independents” by Question Format Treatments from table 2 (with 95 percent confidence intervals). N = 605 independents (Form A = 203, Form B = 198, Form C = 204).
The key takeaway from this experiment is that the nature of the partisanship-question format affects the share of “(pure) independents” in surveys. When “neither” is provided as an option, more respondents ended up classified as “(pure) independents.” Furthermore, we clarified the insights of what happens in cell D from table 1; when respondents in a self-administered/forced-choice survey are given a binary option (Democrat/Republican) and only skips are coded as “(pure) independents,” the category is effectively eliminated.
As a final illustration of measurement sensitivity to question wording, we can calculate the partisanship distribution under different question formats by extrapolating partisan rates by treatment form to the entire pool of initial independent identifiers. Under Form A, a distribution of 47 percent Democratic, 36 percent Republican, and 17 percent independent results; for form B, it is 47 percent Democratic, 41 percent Republican, and 12 percent independent; and for form C, it is 51 percent Democratic, 48 percent Republican, and 1 percent independent.
Notably, offering neither provides a higher estimate of pure independents than has traditionally been found in live interviewer data that relies on the volunteered response. However, eliminating the “neither” response option and requiring a skip, as some organizations like the Pew Research Center do, provides a much smaller, almost negligible, estimate of “(pure) independents.” More research is needed here, but the self-administered version of the survey that produced an estimate of “(pure) independents” more in line with ANES live-interviewer, face-to-face estimates is one that omits the response option “neither” but offers “not sure” instead.
Overall, the experimental evidence supports what was gleaned by comparing the rates of independent identification across different survey collections (figure 2). The measurement of 7-point party ID, especially the measurement of “(pure) independent,” is highly sensitive to question wording. We conclude that it is very likely that the differences observed in the measurement of party identification between recent self-administered web surveys and those conducted with live interviewers (like the ANES) are the result of question wording. This is because, when we hold mode constant, “(pure) independent” identification is extremely sensitive to the instrument.
External Validity—How Should We Measure Party Identification?
Theoretical Perspectives
Our objective now turns to assessing the relative validity of a more inclusive measurement of “(pure) independents.” The case for measuring “(pure) independents” with a volunteered response has roots in two basic concepts in survey research design. One source of potential bias is the social desirability to appear independent, even if one is not particularly independent, given the widespread disdain Americans express toward parties (Hibbing and Theiss-Morse 2002; Klar and Krupnikov 2016). This point is made strongly by Baker and Renno (2019), who argue that offering independent as an option when respondents are first asked, “Generally speaking, do you usually think of yourself as a Republican, a Democrat, an independent, or what?” produces many false positives (partisans identifying as independents). Another potential form of response bias is that citizens who express any sort of ambivalence often pick the middle response (Tourangeau, Rips, and Rasinski 2000). The availability of no opinion/don’t know/neither are often the most desirable response options among respondents who (1) are trying to conceal their answers, (2) are attempting to expend the least amount of energy on a survey, and (3) have the lowest levels of educational attainment (Krosnick et al. 2001).
There are, however, some potential problems with the live-interviewer question approach. First, the reliance on a volunteered answer may introduce a different kind of bias; some respondents may believe that the question is simply a forced-choice question between Democrat and Republican. There also may be certain types of people that are less likely to challenge survey interviewers, thus creating a classification bias in who is identified as a “(pure) independent.” This could be due to group attachments, social identity, and/or socio-economic status. Furthermore, some of the concerns about social desirability bias that motivated the question approach for a live-interviewer survey are mitigated simply by moving from a live-interviewer survey to a self-administered survey. There is no interviewer to appease when a respondent is answering questions on a self-administered survey, and so those effects may be lessened or even completely attenuated.
Ultimately, the question of whether providing “neither” as a response option or relying on volunteered responses produces less bias is an empirical one. The task before us is to design a test or tests that allow for comparison of the measures of party identification. To do this, we take advantage of the natural experiment built into the 2012 and 2016 American National Election Study cross-sections.
Leveraging the variation in ANES in 2012 and 2016, we look at the simple relationships between party identification and: voting behavior, attitudes toward the parties, and latent ideology. The idea is that a more accurate measure of party ID leads to tighter correlations with attitudes toward “idea elements” downstream of party (Converse 1964). We also ask whether there are group-based and/or socioeconomic differences in the shares of “(pure) independents” in the two samples. The reason is that the live-interviewer/volunteered-response approach (again, cell B) may produce bias in who does and who does not identify as an independent based on who is willing to volunteer a response to the interviewer.11 Our empirical tests generally find that a more inclusive measure of party identification, like the ones used by the CES, GSS, and web portion of the ANES, are more strongly correlated with all three outcomes. Furthermore, we find some interesting demographic differences between the self-administered and live-interviewer sample of pure independents that lend further support to this perspective.
Empirical Test 1—Party ID and Vote Choice
For several decades, it has been conventional wisdom in political behavior that independent leaners appear to be partisan because their behavior is partisan. That is, there is a stark contrast between independents who lean toward one of the two major parties and unattached, or pure independents. “(Pure) independents” have lower levels of general political knowledge, are less participatory, and leaners tend to be as supportive of their party nominees as weak partisans (Keith et al. 1992; Klar and Krupnikov 2016; Dyck and Pearson-Merkowitz 2023).
In table 3, we examine the difference in self-reported voting behavior in 2012 and 2016 by 7-point party ID using the ANES. In 2012, leaning Democrats and Republicans are more supportive of their party nominee in the self-administered/forced-choice sample than in the live-interviewer/volunteered-response sample. Additionally, a greater number of “(pure) independents” (16.6 percent vs. 5.1 percent) in the self-administered sample note that they voted for someone other than one of the two major-party candidates. In the 2016 data, leaning Republicans are more partisan in the self-administered sample, and there is no difference between leaning Democrats in the two samples.
Overall, then, the results for independents point to the self-administered sample as providing a measure of party identification that more accurately captures its relationship to voting behavior. That is, there is a stronger relationship between party ID and vote choice, particularly among leaners, in the sample that allows respondents to choose “neither” and thus self-select into the “(pure) independent” category. Furthermore, “(pure) independents” look more like a group that is truly uncertain or undecided in the self-administered sample, with a higher proportion of these respondents casting ballots for alternative/third-party candidates.
We get a similar result from another validity check using data from our 2019 YouGov survey. That survey lets us look at vote choice in 2016. We report those results in Appendix table C2. Also in Appendix C (table C1) are the ANES correlations between party ID (from each sample) and the party feeling thermometers. Again, the self-administered version of party identification produces a tighter correlation.
Empirical Test 2—Ideology and Party ID
Our next validity check involves regressing each version of ANES party identification (7-point) on latent/operational ideology. The ideology score is constructed from 13 policy items that, through factor analysis, acceptably reduce to two dimensions (Treier and Hillygus 2009; Lupton, Myers, and Thornton 2015). Then we compare these regressions to see which version of party ID produces a better fit with ideology. We have an a priori expectation that party ID and ideology are strongly related (Carsey and Layman 2006; Chen and Goren 2016; Dyck and Pearson-Merkowitz 2023) and hence expect the better measure to be more strongly correlated with ideology.
Table 4 presents our results.12 The estimation approach is simple OLS, but we have suppressed the intercept, since we are only interested in the relationship between the two dimensions of ideology and party identification. Any additional factors affecting partisanship, such as political fundamentals or “valence” (Macdonald and Rabinowitz 1998; Schofield, Miller, and Martin 2003), would constitute the intercept term and thus could contaminate our test.
The test shows that ideology in both dimensions is more strongly associated with 7-point party identification in the self-administered samples in both 2012 and 2016. We see this both from the beta coefficients and overall fit statistics, which show a greater percentage of variance explained in self-administered/forced-choice than live-interviewer/volunteered-response models. These results again suggest that offering “neither” as a response option correctly classifies more “(pure) independents” and allows for a more precise measurement of 7-point party identification, one that shows a stronger overall relationship with latent ideology.
Empirical Test 3—Differences by Group Identity and Education
Finally, we look for differences in the makeup of “(pure) independent” populations by examining differences in race, gender, and education. Our analysis here is admittedly somewhat exploratory. However, we include this analysis because we believe there may be systematic differences in the underlying populations of pure independents between the live-interviewer/volunteered-response and self-administered/forced-choice versions of the survey. From a validity standpoint, we would want the underlying subgroup differences to be relatively innocuous, as large differences in “(pure) independents” moving from cell B to C from table 1 may reveal that the subpopulations are fundamentally different (and therefore that one should be preferred to the other). Additionally, probing by education allows us to see if there is a significant problem related to uncertainty and response bias. This is the central reason that “(pure) independent” has always been defined as a volunteered response; researchers worried that providing the category would misclassify partisans as “(pure) independents.”
In table 5, we present the differences in “(pure) independent” identification from the self-administered and live-interviewer samples of the 2012 ANES by gender, race, and education. What can we glean from this simple analysis? Notably, the differences are not monotonic in any of the categories. The largest percentage changes occur among respondents who identify as male, Black, and those with particularly high levels of education. That is, proportionally, there are more “(pure) independents” who are men, Black, and highly educated in the self-administered/forced-choice sample than in the live-interviewer/volunteered-response sample. There are a few interesting notes here. Perhaps the most relevant is the result for education. Recall that the literature on neutral response bias notes that picking the middle answer because of its convenience is most likely to occur among respondents with low levels of education. But here, we see independent identification as two to three times higher (the biggest difference) among those with the highest levels of education when neither is offered as an available forced-choice response option. This strongly cuts against the notion that offering respondents the option to clearly identify as a “(pure) independent” in the question (rather than requiring a volunteered response) would create a misclassification problem.
Taking stock of all three findings, providing neither as a forced-choice response option appears to more accurately capture party identification. It provides a measure that is more strongly related to both vote choice and ideology, and there is some evidence that those who pick neither in the self-administered over the live-interviewer versions of the ANES are more highly educated.
Conclusion
As costs have soared and response rates have declined for live-interviewer surveys, pollsters, academics, campaigns, and market researchers increasingly have turned to online formats as a cost-effective and accurate way to conduct survey research (Ansolabehere and Schaffner 2014). However, unbeknownst to many, the move to web surveys has changed the way that researchers measure party identification. We have shown that there is a fundamental difference in the population of “(pure) independents” when we shift to measuring them with a forced-choice question option as opposed to a volunteered response. The shift is important, as it leads to 50–100 percent more respondents in this category, and consequently, fewer leaning independents. Therefore, much of what we know about this population may be based on a biased undercount of the true independent population.
The fact that the population of “(pure) independents” is potentially much larger than previously thought is a finding that, in and of itself, deserves additional inquiry. Studies often disregard the importance of independents or swing voters, and a larger independent population might mean more persuadable voters in an election than previously thought. We also suspect our findings matter for polarization research. This is because the relationships between party identification and latent ideology, vote choice, and party affect, respectively, are all stronger when we use the forced-choice independent-inclusive measurement approach. Note that these measurement changes coincide with increasing attention to mass polarization in American politics. Studies that claim temporal increases in polarization may want to consider the underlying measurement strategy for party identification.
Given our findings, we end with a series of practical recommendations for researchers looking to properly measure party identification using a web survey:
Our evidence suggests that the method of measuring party ID in the CES and web version of the ANES, which provides respondents the opportunity to identify as a pure independent in a forced-choice question format, produces the more empirically valid measure. It also produces higher estimated counts of independents in the population.Using the forced-choice option between Democrat and Republican and coding skips as “pure independent” essentially discards the concept, as well as that of independents generally. Surveys using this approach often categorize fewer than 5 percent of respondents as pure independents, and we have strong theoretical and empirical reasons to suggest that number is considerably higher.More research on independents is needed. We have an opportunity to now understand if independent identification has been misunderstood because of historical mismeasurement. This includes a need to more systematically study “(pure) independents,” a group that has been historically undercounted and is generally characterized as disaffected and not prone to political participation.Finally, from a measurement perspective, more needs to be done to understand just how sensitive party identification is to question wording effects.
The reference list from the paper itself. Each links out to its DOI / PubMed record.
- 1Ansolabehere Stephen , Schaffner Brian F. 2014. “Does Survey Mode Still Matter? Findings from a 2010 Multi-Mode Comparison.” Political Analysis 22:285–303.
- 2Baker, Andy and Lucio Renno. 2019. “Nonpartisans as False Negatives: The Mismeasurement of Party Identification in Public Opinion Surveys.” The Journal of Politics, 81:906–922.
- 3Bankert Alexa , Huddy Leonie, Rosema Martin. 2017. “Measuring Partisanship as a Social Identity in Multi-Party Systems.” Political Behavior 39:103–32.
- 4Campbell Angus , Philip E. Converse, Warren E. Miller, Donald E. Stokes. 1960. The American Voter. University of Chicago Press.
- 5Carsey Thomas M. , Layman Geoffrey C. 2006. “Changing Sides or Changing Minds? Party Identification and Policy Preferences in the American Electorate.” American Journal of Political Science 50:464–77.
- 6Chen Philip G. , Goren Paul N. 2016. “Operational Ideology and Party Identification: A Dynamic Model of Individual-Level Change in Partisan and Ideological Predispositions.” Political Research Quarterly 69:703–15.
- 7Converse Philip E. 1964. “The Nature of Belief Systems in Mass Publics.” In Ideology and Its Discontents, edited by David E. Apter. The Free Press of Glencoe.
- 8Dyck Joshua J. , Pearson-Merkowitz Shanna. 2023. The Power of Partisanship. Oxford University Press.