Phylogeography of the widely distributed John Dory ( Zeus faber , Actinopterygii: Zeiformes) reaffirms the prevalence of at least two deeply divergent clades
João Tadeu Fontes, Kenza Mokhtar‐Jamaï, Zakariya Nchioua, Jean‐Dominique Durand, Monica Landi, João Meira, Luís Machado, Ayoub Baali, Ignacio Sobrino, Iça Barri, Emmanuel Kouamé, Béatrice Abouo Adepo‐Gourène, Mamadou Diop, Néné Gallé Kidé, Austin Saye Wehye, Zacharie Sohou

TL;DR
The John Dory fish species is divided into two genetically distinct groups, which has implications for conservation and management.
Contribution
The study confirms two deeply divergent clades in Zeus faber and identifies a transition zone along the Atlantic coast of Morocco.
Findings
Two highly divergent mitochondrial clades (Clade A and Clade B) were identified with a mean K2P distance of 7.4%.
Clade B contains four geographically structured subclades extending from Morocco to Japan and New Zealand.
The transition zone between the clades is located along the Atlantic coast of Morocco.
Abstract
The John Dory Zeus faber is a commercially exploited demersal fish species with a known distribution ranging from the Northeast Atlantic to parts of the Indian and Pacific oceans. A previous genetic survey using cytochrome c oxidase subunit I (COI) DNA barcodes suggested the presence of two geographically segregated taxonomic units within Z. faber. We revisit this hypothesis by expanding the number and geographic coverage of DNA barcodes, addressing a major data gap along parts of the Atlantic coast of Africa and conducting a comprehensive phylogeographic analysis. Our findings consolidated the existence of two highly divergent mitochondrial clades, Clade A and Clade B (mean K2P distance: 7.4%), with the transition zone between them located along the Atlantic coast of Morocco. Clade A exhibited no phylogeographic structure, with haplotypes shared between Northeast Atlantic and…
Genes, proteins, chemicals, diseases, species, mutations and cell lines named across the full text — each resolved to its canonical identifier and authoritative record.
Click any figure to enlarge with its caption.
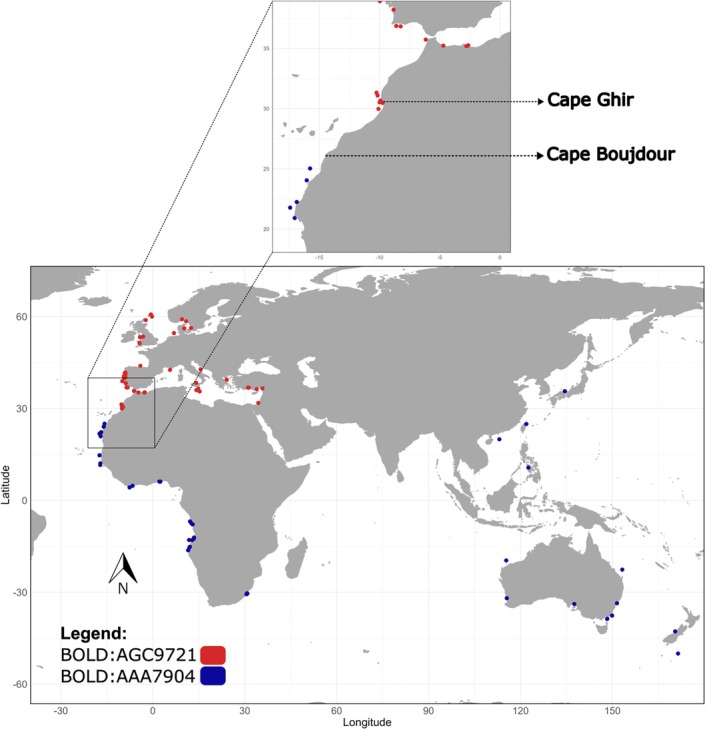 FIGURE 1
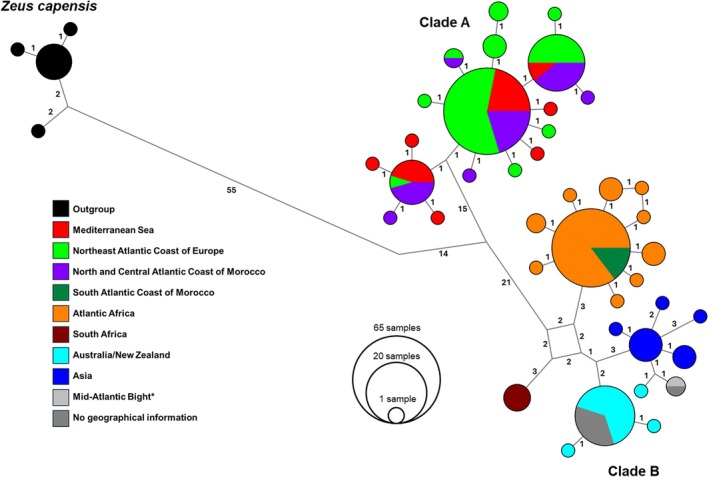 FIGURE 2
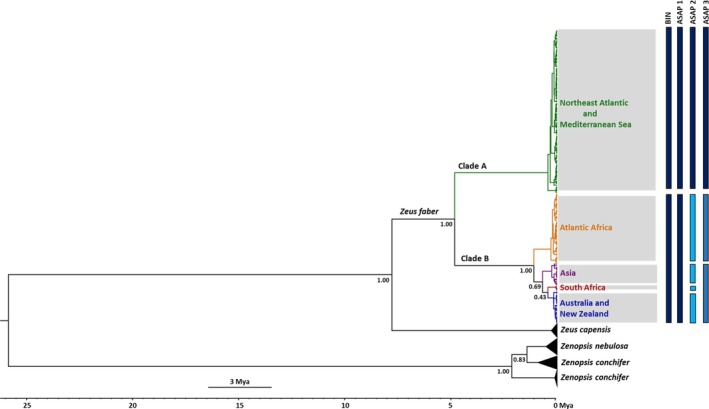 FIGURE 3
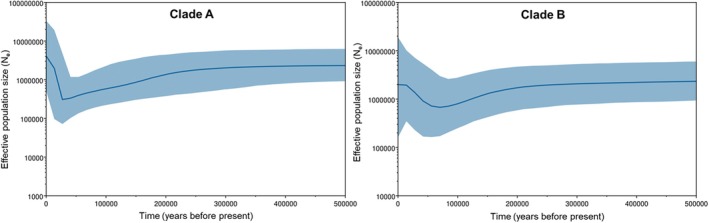 FIGURE 4
| Clade A | Clade B | Overall | |
|---|---|---|---|
|
| 112 | 89 | 201 |
| S | 17 | 31 | 73 |
| PIS | 6 | 20 | 56 |
| H | 18 | 21 | 39 |
| Hd | 0.641 | 0.800 | 0.850 |
|
| 0.0018 | 0.0091 | 0.0365 |
| Mean K2P (%) | MED | AUS | NEA | ASI | AFR |
|---|---|---|---|---|---|
| MED | – | ||||
| AUS | 7.7 ± 0.006 | – | |||
| NEA | 0.2 ± 0.004 | 7.7 ± 0.004 | – | ||
| ASI | 7.9 ± 0.012 | 0.9 ± 0.015 | 7.9 ± 0.007 | – | |
| AFR | 7.1 ± 0.004 | 1.4 ± 0.005 | 7.1 ± 0.002 | 1.6 ± 0.008 | – |
| SA | 7.4 ± 0.009 | 1 ± 0.016 | 7.3 ± 0.006 | 1.2 ± 0.021 | 1.7 ± 0.007 |
|
| S | PIS | H | Hd |
| D |
| |
|---|---|---|---|---|---|---|---|---|
| Raw data | ||||||||
| Mediterranean | 26 | 7 | 3 | 8 | 0.686 | 0.0021 | −0.879 | 0.409 |
| Northeast Atlantic | 86 | 13 | 6 | 13 | 0.627 | 0.0016 | −1.686 | 0.069 |
| Atlantic Africa | 48 | 8 | 4 | 10 | 0.496 | 0.0010 | −1.826 | 0.046 |
| Australia and New Zealand | 16 | 9 | 0 | 4 | 0.350 | 0.0018 | −2.149 | 0.008 |
| Asia | 12 | 7 | 1 | 5 | 0.727 | 0.0023 | −1.534 | 0.114 |
| South Africa | 4 |
|
| 1 |
|
|
|
|
| Subsampled data | ||||||||
| Mediterranean | 12 | 4.6 | 2.1 | 5 | 0.688 | 0.0021 | −0.452 | 0.633 |
| Northeast Atlantic | 12 | 4.3 | 1.5 | 4.4 | 0.626 | 0.0016 | −0.981 | 0.369 |
| Atlantic Africa | 12 | 3.2 | 0.5 | 4.1 | 0.501 | 0.0010 | −1.365 | 0.204 |
| Australia and New Zealand | 12 | 6.8 | 0 | 3.2 | 0.353 | 0.0028 | −1.838 | 0.06 |
| Asia | 12 | 7 | 1 | 5 | 0.727 | 0.0023 | −1.534 | 0.114 |
| South Africa |
|
|
|
|
|
|
|
|
| Source of variation | Df | Sum of squares | Variance components | Percentage of variation (%) |
|
|---|---|---|---|---|---|
| Among clades | 1 | 1981.5 | 20.1 | 88.4 | 0.067 |
| Among geographic groups | 4 | 187.4 | 2.1 | 9.5 | <0.0001 |
| Within geographic groups | 186 | 89.7 | 0.5 | 2.1 | <0.0001 |
Peer Reviews
No public reviews on file for this paper yet. If you reviewed it on a platform where reviews are public (OpenReview, ICLR, NeurIPS, ICML), you can paste yours below so the community can read it here.
Videos
No videos yet. Explain this paper in a talk, walkthrough, or lecture? Add one.
Taxonomy
TopicsIdentification and Quantification in Food · Genetic diversity and population structure · Ichthyology and Marine Biology
INTRODUCTION
1
Marine environments encompass vast geographic ranges and diverse ecological regions, providing opportunities to explore unique patterns of genetic divergence and phylogeographic structure within species (Avise et al., 2016; Dalongeville et al., 2022; Grant & Bowen, 1998; Palumbi, 1997). Despite being highly interconnected, marine ecosystems are influenced by a combination of historical, oceanographic and ecological factors that can promote geographic isolation and, therefore, shape complex patterns of intraspecific genetic divergence and speciation (Martins et al., 2022; Salmenkova, 2011). Historically, marine fishes were considered capable of maintaining genetic connectivity across large distribution ranges due to their high dispersal abilities, particularly during the pelagic larval phase. However, phylogeographic studies and DNA barcoding surveys have increasingly revealed cryptic diversity in species once thought to have broad distribution ranges (Arroyave et al., 2019; Guimarães et al., 2022; Jamaludin et al., 2020). In recent years, several species complexes have been unravelled, including, for instance, Omobranchus punctatus (Valenciennes 1836), Lampris guttatus (Brünnich 1788) and Mugil cephalus L. 1758 (Cabezas et al., 2022; Crosetti et al., 1993; Hyde et al., 2014; Whitfield et al., 2012). Indeed, a notable study compared species occurring on opposite sides of the Indian Ocean and found that one‐third of these species may individually represent two distinct taxonomic units (Zemlak et al., 2009).
Marine fishes, due to their wide distributions and exposure to diverse ecological pressures, are well‐suited models for the study of marine phylogeography (Avise et al., 2000; Grant & Bowen, 1998; Kottillil et al., 2023). Phylogeographic analysis helps distinguish evolutionarily significant units (ESUs), which may represent reproductively isolated populations. Identifying these units can ensure that conservation and fisheries management efforts, such as setting appropriate fishing restrictions or protecting vulnerable populations, are accurately designed (Ferrette et al., 2021; Hüne et al., 2021; Ollé‐Vilanova et al., 2024). Furthermore, identifying potential phylogeographic discontinuities in marine fishes helps understand how past events could have shaped current distributions (Arroyave et al., 2019; Shen et al., 2011). Particularly, the cytochrome c oxidase subunit I (COI) DNA barcode region has been extensively used to identify marine fish species, particularly in cases where taxonomic ambiguities required resolution (Bingpeng et al., 2018; Chang et al., 2017; Landi et al., 2014; Liu et al., 2022; Oliveira et al., 2016). It has also proven to be an effective marker for delimiting divergent genetic lineages through phylogeographic analysis and detecting hidden diversity in fishes (Arroyave et al., 2019; Cabezas et al., 2022; Guimarães et al., 2022; Nneji et al., 2020; Vilasboa et al., 2022).
The John Dory Zeus faber L. 1758 is a commercially important demersal marine fish species, prominently for human consumption (Giarratana et al., 2018; Iwamoto, 2015). It is typically captured as by‐catch during bottom trawls and occasionally targeted seasonally (Dunn, 2001; Ismen et al., 2013; Kim et al., 2020). Despite reports of heavy exploitation (Gascuel et al., 2007; Vrgoč et al., 2006), the International Union for Conservation of Nature (IUCN) Red List of Threatened Species categorizes the species as ‘data deficient’ as of 13 January 2025 (Iwamoto, 2015). This species has a vast geographic distribution spanning European, African, Asian and Australian coastal regions (Janssen, 1979; Ward et al., 2008; Yoneda et al., 2002) separated by several well‐known biogeographic barriers. The pelagic larval duration of Z. faber remains unknown, limiting our ability to predict its dispersal potential. Pelagic larval duration is a key determinant of genetic structure in marine species, with longer durations usually promoting gene flow between distant populations (Treml et al., 2012). Interestingly, Ward et al. (2008) observed deep genetic divergence in the COI DNA barcode region for Z. faber. This divergence was observed between specimens collected in Australia and New Zealand versus those collected in the Northeast Atlantic Ocean and Mediterranean Sea. These two clades currently correspond to two distinct barcode index numbers (BINs; Ratnasingham & Hebert, 2013) in the Barcode of Life Data Systems (BOLD; Ratnasingham et al., 2024; accessed 13 January 2025), which are generally considered distinct molecular operational taxonomic units (MOTUs). Nonetheless, the distribution of the two clades, particularly along the Atlantic coast of Africa, has remained largely unexplored. Moreover, since the study by Ward et al. (2008), additional DNA barcodes for this species have been added to public databases, enriching the dataset available for phylogeographic analysis.
In this study, we investigated the genetic divergence and evolutionary history of Z. faber by expanding the geographic coverage of the study by Ward et al. (2008). We addressed the large barcode data gap along the Atlantic coast of Africa, namely Angola, Benin, Côte d'Ivoire, Liberia, Guinea‐Bissau, Senegal, Mauritania and Morocco. By generating new COI sequences from specimens collected in the coastal waters of these countries and integrating them with publicly available data, we aimed to perform a comprehensive phylogeographic analysis to deepen our understanding of this species' diversity and evolutionary history. Our goal was to elucidate the geographic span of the two previously detected deeply divergent clades identified by Ward et al. (2008), map the transition region and screen for genetic structure. Such information is relevant for unravelling Z. faber's evolutionary history, as well as for accurate and reliable stock assessments and fisheries management. Additionally, the findings of this study will enhance our understanding of the evolutionary history of fish species in the Eastern Atlantic Ocean, a region where phylogeographic breaks have been reported (Bargelloni et al., 2003; Caballero‐Huertas et al., 2022; Catarino et al., 2017; Chahdi Ouazzani et al., 2017; Cunha et al., 2022).
MATERIALS AND METHODS
2
Specimen collection and sequence generation
2.1
A total of 100 Z. faber specimens were collected from the coastal waters of Angola, Benin, Côte d'Ivoire, Guinea‐Bissau, Liberia, Mauritania, Morocco, Portugal and Senegal. All specimens were identified morphologically, and a small portion of skeletal muscle tissue (~0.5–1 cm^3^) was extracted from each for genetic analysis. Collection metadata, GenBank accession numbers and BOLD process IDs are provided in Table S1. A ~ 652‐bp fragment of the 5′ end of the COI gene (COI‐5P), corresponding to the DNA barcode region (Ivanova et al., 2007; Ward et al., 2005), was amplified and Sanger sequenced following standard DNA barcoding protocols. Laboratory‐specific procedures used for sequence generation are detailed in Table S2.
All specimens used in this study were obtained in accordance with applicable national and international laws, including access and benefit‐sharing (ABS) frameworks where relevant. Eight samples were sourced from artisanal fish landings in Côte d'Ivoire, Mauritania and Senegal, from publicly accessible markets where no formal collection permits were required under local regulations. The remaining 92 specimens were collected during authorized research surveys conducted by institutional partners in Angola, Benin, Liberia, Guinea‐Bissau, Morocco and Portugal. Tissue samples were taken post‐mortem from fish already captured through legal fishing activities. No live animals were handled or killed for the purposes of this study.
Dataset compilation
2.2
The identity of the generated sequences was confirmed using the BOLD identification tool, and the absence of stop codons in all sequences was confirmed within the BOLD workbench (Ratnasingham et al., 2024). Subsequently, the dataset was enriched with 122 Z. faber sequences downloaded from BOLD. During the preliminary analysis, 21 of the mined sequences introduced a disproportionate number of reticulations (i.e., loops or conflicting connections) in the reduced‐median network (Bandelt et al., 1995). Such patterns are often caused by artefactual mutations occurring inconsistently across sequences, which create multiple, equally plausible evolutionary pathways. This interpretation is consistent with the unusually high number of mutations observed in these sequences, raising concerns about their quality and suggesting potential sequencing or base‐calling errors. As access to the sequencing trace files was unavailable, preventing further quality verification, these sequences were excluded from subsequent analyses. The sampling locations for all Z. faber records utilized in this study with available geographic information are displayed in Figure 1. World map data were obtained using the maps package version 3.4.1 (Becker et al., 2022), originally retrieved from the Natural Earth data project (1:50 m, version 2.0, 2015, https://www.naturalearthdata.com). For specimens without geographic co‐ordinates, approximate locations were assigned based on the most‐detailed available information, such as seas, regions or countries; these cases are provided in Table S3. Additional DNA barcode sequences belonging to the family Zeidae, specifically Zeus capensis Valenciennes 1835, Zenopsis conchifer (Lowe 1852) and Zenopsis nebulosa (Temminck & Schlegel 1845), were also retrieved from BOLD to be incorporated in the analysis as out‐groups. The total number of mined Z. faber DNA barcodes included in this study was 101, with 43 additional sequences from the out‐groups. The BOLD process IDs and corresponding species names for the mined DNA barcodes used in this study are provided in Table S3.
Sampling locations for the Zeus faber specimens, including the newly generated sequences and records mined from BOLD. Point colours in the legend correspond to the barcode index number (BIN) assigned to each record in the BOLD database.
Data analysis
2.3
All sequences were aligned using ClustalW (Thompson et al., 1994) with default parameters in Mega 11 (Tamura et al., 2021). To reconstruct the phylogeny and analyse the evolutionary relationship between haplotypes, polymorphisms were identified using mtDNA‐GeneSyn (Pereira et al., 2009), and a haplotype network was constructed using the reduced‐median algorithm (Bandelt et al., 1995) in Network version 10.2.0.0 (www.fluxus-engineering.com). The multiple sequence alignment included sequences varying in length, resulting in gaps at the extremities. To avoid losing valuable genetic information and geographic coverage, we used a reconstruction approach based on the definition of the most parsimonious missing segments of DNA for each sequence. Missing segments for shorter sequences were reconstructed using shared or most closely related haplotypes based on the phylogenetic reconstruction provided by the reduced‐median network. Overall, 2.6% of the alignment matrix (i.e., calculated as 201 sequences × 620 positions) was reconstructed, with 9.4% of the reconstructed positions being polymorphic. This approach resulted in a multiple sequence alignment of 620 positions used in downstream analyses. Supplementary analyses were conducted by trimming the original non‐reconstructed alignment to match the shortest sequence, resulting in a multiple sequence alignment of 408 bp. The results showed that the key trends and relative differences were unchanged compared to the reconstructed alignment and did not alter the interpretation or discussion of the results. These supplementary results are detailed in Tables S4–S8.
To measure genetic divergence, a Kimura‐2‐Parameter (K2P; Kimura, 1980) distance matrix was computed in Mega 11. Polymorphic (segregating) sites (S), and parsimony‐informative sites (PIS) were determined using the ape R package version 5.5 (Paradis & Schliep, 2019), whereas the number of haplotypes (H), haplotype diversity (Hd) and nucleotide diversity (π) were calculated using the pegas R package version 1.1 (Paradis, 2010). These analyses were performed overall for the entire dataset, for each main clade identified, and separately for different geographic groups. The geographic groups were defined as follows: (1) the Northeast Atlantic, which included samples from Europe, as well as the Northern and Central Atlantic regions of Morocco (bounded north by Cape Spartel and south by Cape Boujdour); (2) the Mediterranean Sea, comprising samples from its western, central and eastern regions; (3) Atlantic Africa, which comprised samples from the western coast of Africa, including only the Southern Atlantic region of Morocco (bounded north by Cape Boujdour and south by Cape Blanc); (4) South Africa, encompassing samples from the Indian Ocean; (5) Australia (from the Indian and Pacific Ocean regions) and New Zealand; and (6) Asia, comprising samples from Japan, China, Taiwan and the Philippines. To calculate genetic diversity metrics, the dataset for each geographic group was normalized by subsampling to match the second smallest sample size (Asia, n = 12). The smallest group (South Africa, n = 4) was excluded because it was too small to yield robust estimates and contained only a single haplotype, preventing the calculation of haplotype and nucleotide diversity. Subsampling was repeated 10,000 times without replacement, and mean values for each genetic diversity metric were calculated. Tajima's D was calculated for each geographic group to test deviations from neutrality, using the pegas R package. An analysis of molecular variance (AMOVA) was conducted using Arlequin version 3.5.2.2 (Excoffier et al., 1992, 2007) with 100,000 permutations, utilizing K2P distances. The analysis was performed to assess the genetic structure of Z. faber at two hierarchical levels: among clades and among geographic groups. For analysis using the previously defined geographic groups, we excluded sequences without geographic origin information, as well as one sequence labelled as being collected in the Mid‐Atlantic Bight (see Supplementary Text S1 for details).
A Bayesian phylogenetic tree was constructed using BEAST version 1.10.4 (Suchard et al., 2018), employing the HKY + I + G evolutionary model, which was selected based on the Bayesian information criterion (BIC) analysis performed using jModeltest version 2.1.10 (Darriba et al., 2012). The Bayesian analysis ran for 100 million Markov chain Monte‐Carlo (MCMC) iterations, sampling every 10,000th generation. A mutation rate of 1.2% per million years (with a standard error of 10%) was set as a prior based on previous estimations for marine bony fishes (Bermingham et al., 1997; Hüne et al., 2021; Reece et al., 2010). Additionally, a fossil calibration prior was applied to the crown node of the Zeidae family, using an estimated age of 32.02 million years as described in the phylogeny by Rabosky et al. (2018); https://fishtreeoflife.org/taxonomy/family/Zeidae/. The Bayesian analysis estimated a mutation rate of 9.94 × 10^−9^ substitutions per site per year (0.994% per million years), with a 95% credible interval (CI) of 7.87–12.0 × 10^−9^ substitutions per site per year. The coalescence time for Z. faber was estimated at 4.81 million years (95% CI: 3.89–5.84 million years). For the Zeidae family, the coalescence time was estimated at 25.7 million years (95% CI: 18.6–33.0 million years). To estimate population expansions associated with each major clade, we calculated two Bayesian Skyline Plots (BSPs) in BEAST using the previously obtained substitution rate (9.94 × 10^−9^ substitutions per site per year). BSPs were visualized using Tracer version 1.7.2 (Rambaut et al., 2018). For MOTU delimitation, two methods were used. The Refined Single Linkage algorithm (RESL) was applied as implemented in the BOLD databased through the BIN system (Ratnasingham & Hebert, 2013), and the automatic Assemble Species by Automatic Partitioning (ASAP; Puillandre et al., 2021) was employed on https://bioinfo.mnhn.fr/abi/public/abgd/abgdweb.html with default parameters using K2P distances.
RESULTS
3
We analysed a total of 201 Z. faber COI sequences, using a 620‐bp alignment with 73 polymorphic sites and 56 PIS (Table 1). Both the reduced‐median haplotype network (Figure 2) and the Bayesian tree (Figure 3) revealed two main highly divergent clades, referred to hereafter as Clade A and Clade B. The two clades displayed a mean K2P distance of 7.4% and a maximum of 8.8% between them. As observed in Table 2, the mean K2P distance was lowest between samples from the Mediterranean and samples from the Northeast Atlantic, with 0.2%. Conversely, the highest mean K2P distances were observed between samples from Asia and the Mediterranean, as well as between Asia and the Northeast Atlantic, both with 7.9%.
Reduced‐median haplotype network for Zeus faber based on 620 bp of the COI barcode region. The size of the circles is proportional to the number of individuals sharing the haplotype. The numbers on the edges indicate the number of mutational steps connecting haplotypes and median vectors. An asterisk () indicates that additional information regarding the sample annotated as having been collected in the Mid‐Atlantic Bight is provided in Data S1.*
Bayesian tree generated in BEAST for Zeus faber based on 620 bp of the COI barcode region. Divergence dates scale are represented in millions of years ago (Mya), whereas node values indicate posterior probabilities. The coloured bars on the right indicate the barcode index number (BIN) partition according to the Refined Single Linkage (RESL) algorithm implemented in the BOLD database and the three Assemble Species by Automatic Partitioning (ASAP) partitions with the lowest ASAP score (2.5).
Overall, we found 39 different Z. faber haplotypes, with haplotype diversity (Hd) of 0.850 and nucleotide diversity (π) of 0.0365 (Table 1). Clade A had a total of 112 sequences and 18 different haplotypes, whereas in Clade B there were 89 sequences and 21 haplotypes. Haplotype diversity (Hd) and nucleotide diversity (π) were higher in Clade B compared to Clade A. The genetic diversity metrics calculated for the different geographic regions, as well as the results for Tajima's D test, are represented in Table 3. Haplotype diversity was lowest in the Australia/New Zealand group and highest in the Asia group for both the raw and subsampled data (excluding the South Africa group, which had only one haplotype). In the raw data, nucleotide diversity was lowest for Atlantic Africa and highest for Asia. Conversely, in the subsampled data, nucleotide diversity was lowest for Atlantic Africa but highest for Australia/New Zealand. Statistically significant Tajima's D values (p < 0.05) were found solely for Atlantic Africa and Australia/New Zealand in the raw data. In the AMOVA (Table 4), 88.4% of the total genetic variance was attributed to differences between clades A and B, although this was not statistically significant (p = 0.067). In contrast, 9.5% of the total variance was attributed to differences among geographic groups within clades, demonstrating highly significant genetic structure (p < 0.0001).
The maximum K2P distance within Clade A was 0.8%, with a mean of 0.2%. This clade included exclusively sequences from the Northern Hemisphere, namely the Northeast Atlantic Coast of Europe (i.e., Portugal, Spain, United Kingdom, Germany, Denmark, Norway and Sweden), North and Central Atlantic Morocco and the Mediterranean Sea (i.e., France, Greece, Israel, Italy, Malta, Morocco and Turkey). There was no geographic sorting of the haplotypes in Clade A, with the three largest haplogroups including sequences from both aforementioned regions (Figure 2). Maximum K2P within Clade B was 2.3%, with a mean of 0.9%. Clade B comprised sequences from both the Northern and Southern Hemispheres, although with an overall more southern distribution than Clade A. The haplotypes for this clade were, in great part, geographically sorted between four regions (Figure 2). All sequences from Asia (China, Japan, the Philippines and Taiwan) clustered together, along with one sequence lacking geographic information, one from Northwestern Australia and one annotated as originating from the Mid‐Atlantic Bight (a region where Z. faber's distribution is not reported; see Supplementary Text S1 for details). The remaining sequences from Australia and New Zealand formed a cluster that included seven sequences without geographic information. The sequences from South Africa, specifically from the Indian Ocean, formed a group with one haplotype. Sequences from the Atlantic coast of Africa (Angola, Benin, Côte d'Ivoire, Liberia, Guinea‐Bissau, Senegal and Mauritania), including only the South Atlantic region of Morocco, clustered together. The transition zone between the two clades was found along the Atlantic coast of Morocco, approximately extending from south of Cape Ghir (30.63° N, 9.89° W) to Cape Boujdour (26.13° N, 14.50° W) (Figure 1).
Species delimitation analyses supported the existence of distinct genetic groupings (Figure 3). In the BOLD database, Clade A corresponded to BIN BOLD:AGC9721, whereas Clade B corresponded to BOLD:AAA7904 (BOLD accessed 15 January 2025). The ASAP analysis produced three optimal partitions based on the lowest ASAP score (2.5): Partition 1 identified two MOTUs, corresponding to clades A and B; partition 2 identified five MOTUs, corresponding to Clade A plus the four lineages within Clade B (Atlantic Africa, South Africa, Australia/New Zealand and Asia); and partition 3 identified three MOTUs, representing Clade A, the Atlantic Africa lineage within Clade B and a subclade encompassing the Asia, Australia/New Zealand and South Africa lineages.
BSPs were used to estimate changes in effective population size over time for clades A and B based on coalescent data derived from DNA barcodes (Figure 4). The analysis focused on the last 500,000 years, as no coalescent points were observed beyond this period. For Clade A, the BSP revealed a sharp expansion in effective population size, beginning approximately 20,000 years ago, whereas Clade B showed a more gradual increase starting around 70,000 years ago.
*Bayesian Skyline Plots (BSPs) for Clade A and Clade B of Zeus faber based on 620 bp of the COI barcode region. The x‐axis represents years before present, and the y‐axis represents effective population size (N
e ).*
DISCUSSION
4
This phylogeographic study provided novel insights into the evolutionary history and genetic structure of Z. faber, a widely distributed and commercially important marine fish species. To conduct the analyses, we employed the COI DNA barcode region, a well‐established marker with recognized merits for fish identification (Arroyave et al., 2019; Bingpeng et al., 2018; Guimarães et al., 2022; Landi et al., 2014; Shakouri et al., 2023). The vast public availability of DNA barcodes from specimens collected worldwide (Porter & Hajibabaei, 2018; Ratnasingham et al., 2024) allowed us to conduct this study on a geographically wide scale, which would have been logistically more challenging using other genetic markers. Our investigation was prompted by Z. faber's previously observed high intraspecific genetic divergence, along with its wide geographic distribution and large DNA barcode data gap along the Atlantic coast of Africa.
The phylogeographic reconstruction revealed the presence of two deeply divergent clades – Clade A and Clade B – with a mean K2P of 7.4%. This level of genetic divergence largely surpassed the levels of genetic variation generally observed in marine fish species (Costa et al., 2012; Dettai et al., 2011; Knebelsberger et al., 2014; Ward et al., 2005). Our results confirmed and expanded on the previous screening for genetic divergence of Z. faber by Ward et al. (2008), incorporating sequences from additional geographic regions and a robust phylogeographic analysis. These findings clearly suggested that specimens identified morphologically as Z. faber belong to at least two sister taxa, with the widely distributed Clade B exhibiting a clear phylogeographic pattern. Moreover, by expanding DNA barcode sampling along Africa's Atlantic shores, we clarified the mitochondrial clade of these specimens and mapped the transition zone along Morocco's Atlantic coast. This has improved our understanding of the distribution of both clades in the Eastern Atlantic Ocean.
Regarding Z. faber's evolutionary history, according to the reduced‐median network and the Bayesian analysis (Figures 2 and 3), the two clades likely diverged from a common ancestor in the Eastern Atlantic Ocean. Clade A lacked geographic structure and exhibited a high degree of haplotypes shared between specimens from the Northeast Atlantic Ocean and the Mediterranean Sea, along with a comparatively lower mean K2P distance between the two regions (0.2%, Table 2). These patterns suggested some degree of genetic connectivity, potentially indicating gene flow between the two regions. On the contrary, Clade B exhibited a considerable degree of phylogeographic structure with four distinct lineages identified (Figures 2 and 3). Moreover, Clade B showed moderate divergence between geographic regions (Table 2), with the maximum K2P distance having been observed between a sequence from China and a sequence from Angola (2.3%). Comparatively, the Bayesian analysis indicated that Clade B began diverging at an earlier stage than Clade A, which was consistent with its more defined geographic structure. This structure was further supported by the AMOVA (Table 4), which revealed that 9.5% of the total genetic variance was attributed to differences among the previously defined geographic groups. Although this percentage was relatively low compared to the variance observed between clades, it was statistically significant, demonstrating consistent and detectable geographic differentiation. The variance between clades A and B was non‐significant (p = 0.067) likely due to the limited degrees of freedom (df = 1). However, it still accounted for 88.4% of the total genetic variance, suggesting strong genetic differentiation despite not reaching statistical significance.
The reduced‐median network and Bayesian tree presented differing perspectives on the relationships within Clade B. In the network, Australia/New Zealand and Asia appeared more closely related, whereas the Bayesian tree showed Australia/New Zealand grouping with South Africa. These differences could have been attributed to the distinct analytical approaches used. The reduced‐median network relied on parsimony, favouring the simplest explanation with the fewest evolutionary changes, whereas the Bayesian tree employed a probabilistic framework. The lower posterior probabilities for the Clade B branches in the tree further indicated uncertainty in these specific evolutionary relationships, suggesting that they were unresolved with the current dataset. Indeed, one of the MOTU partitions found by ASAP (Figure 3) clustered the three lineages from Australia/New Zealand, South Africa and Asia into a single MOTU, reflecting this uncertainty. Thus, future research incorporating additional genetic markers could improve resolution and clarify the evolutionary history of this taxon, similar to efforts in the M. cephalus species complex (Thieme et al., 2025).
Although the divide between the Northeast Atlantic Ocean and the Mediterranean Sea has been reported as a phylogeographic break for fish species (Bargelloni et al., 2003; Larmuseau et al., 2009; McKeown et al., 2020; Patarnello et al., 2007), this pattern did not occur for Z. faber. Similarly, Cunha et al. (2022) found haplotype sharing between samples from the Atlantic Ocean and the Mediterranean for the bogue Boops boops (L. 1758) while reporting genetic structure within the Eastern Atlantic. This parallel suggested that, like B. boops, Z. faber did not exhibit a phylogeographic break between these two regions. Alternatively, the transition zone between the two Z. faber clades occurred within the Atlantic coast of Morocco, approximately extending from south of Cape Ghir to Cape Boujdour (Figure 1). This phylogeographic break has already been noticed for species such as Sardina pilchardus (Walbaum 1792), M. cephalus or close to this area for Engraulis encrasicolus (L. 1758) (Chahdi Ouazzani et al., 2017; Chlaida et al., 2009; Thieme et al., 2025).
Based on our sampling, Clade A and Clade B appeared to exist in allopatry, with no evidence of overlap between their distributions. Moreover, we were unable to find records of Z. faber from the transition zone along the Atlantic coast of Morocco. Yet, it was unclear whether this reflected a true absence or insufficient exploration of the area, particularly in deeper habitats beyond the usual survey depths. This sharp geographic isolation between the clades was unusual for marine fishes, and the complex upwelling systems along the Moroccan Atlantic coast may have contributed to this separation. Seasonal upwelling around Cape Ghir and more persistent upwelling further South, around Cape Juby (Makaoui et al., 2012, 2015), likely created dynamic environmental gradients that maintained the separation of the two clades. By altering water temperature and nutrient availability (Barton et al., 1998), these upwelling systems can influence marine habitat structure (Largier, 2020; Tapia et al., 2009). This may have limited the geographic overlap between the two clades and contributed to their genetic separation. In addition, the increased biological productivity associated with these upwelling systems (Moore et al., 2004; Radenac et al., 2020) may have further enhanced habitat variability in the region. This, in turn, could have contributed to shaping the distribution patterns and genetic differentiation observed between the two Z. faber clades. Similar oceanographic processes have been shown to sustain genetic structure across large geographic areas. For instance, in the M. cephalus species complex in the Northwest Pacific, significant genetic differentiation has been documented between cryptic species likely influenced by strong current systems, temperature gradients and different reproductive behaviour that have maintained the genetic integrity of these species despite secondary contact after Pleistocene vicariant events (Shen et al., 2011, 2015).
Although the upwelling systems likely contributed to maintaining or reinforcing the geographic separation between Clade A and Clade B, it was uncertain whether these oceanographic features were present during their initial divergence from a common ancestor. This suggested that other historical factors may have influenced this divergence. One hypothesis is the potential role of the Messinian salinity crisis (MSC), which took place between 5.96 and 5.33 million years ago (Briand, 2008; Krijgsman et al., 1999). The coalescence time for the two Z. faber clades, estimated at 4.81 million years ago (95% CI: 3.89–5.84 million years), coincided with the aftermath of this event. Although the MSC primarily affected the Mediterranean basin, it also disrupted the hydrological balance in adjacent Atlantic waters (Blanc & Duplessy, 1982; Mascle & Mascle, 2019). These environmental changes, particularly after the reopening of the Gibraltar Strait, would have reshaped marine habitats and contributed to the genetic isolation of marine populations. The MSC could have contributed to the divergence of Clade A and Clade B from a common ancestor in the tropical‐subtropical Northeast Atlantic. However, this hypothesis requires further investigation to assess its validity. To evaluate the plausibility of this hypothesis, future studies could use additional genetic markers to refine divergence time estimates, model paleoclimate and oceanographic changes during the MSC, examine sediment and fossil records for evidence of habitat shifts and compare biogeographic patterns across taxa in the region.
The BSP (Figure 4) for Clade A indicated a rapid population expansion starting approximately 20 thousand years ago, a pattern that coincided with the environmental changes of the Last Glacial Maximum (LGM), occurring between 19 and 26.5 thousand years ago (Clark et al., 2009). The significant shifts in sea levels and rising ocean temperatures during this period likely expanded habitat availability and created more favourable environmental conditions. This would have allowed populations to colonize previously inaccessible or unfavourable areas, particularly in the Northeast Atlantic and Mediterranean regions. This pattern, along with considerable haplotype sharing and a lack of clear geographic structure in Clade A, suggested that the expansion could have originated from a smaller founding population that was constrained by prior conditions. In contrast, the BSP for Clade B indicated a more gradual population growth beginning around 70 thousand years ago, possibly shaped by more stable environmental conditions and subtle ecological pressures across its broader and more southern geographic range. Although statistical significance was found only in the raw data, negative Tajima's D values were observed in Clade B for regions such as Australia/New Zealand and Atlantic Africa, consistent with signals of population expansion within these areas. Together, these patterns further suggested distinct demographic histories for clades A and B shaped by differing environmental conditions and pressures.
Genetic diversity metrics revealed some regional differences (Table 3). Due to limited sampling, no definitive conclusions could be drawn about genetic diversity in South Africa, where only four samples were analysed, represented by a single haplotype. Australia and New Zealand exhibited the lowest haplotype count and haplotype diversity in both the raw and subsampled data. Despite comparable nucleotide diversity, the reduced haplotype diversity in these regions suggested that, although the few haplotypes exhibited some genetic variation, the population's overall genetic diversity was reduced. Similarly, Atlantic Africa was comparatively low in terms of genetic diversity metrics (both raw and subsampled) despite the considerable number of samples collected from different sites along the West African coast. Reduced genetic diversity can limit adaptability to environmental changes, necessitating targeted management strategies for certain regions (Domingues et al., 2018; Ferrette et al., 2021; Frankham, 2005). Future studies should focus on expanding sampling efforts across underrepresented regions to enhance resolution and enable a more comprehensive assessment of population stability and genetic diversity.
CONCLUSIONS
5
Our study reinforced the presence of two highly divergent clades for the Z. faber morphospecies, with distinct geographic distributions and evolutionary histories. Moreover, it showed that Clade B consisted of at least four lineages with noteworthy phylogeographic structure. By mapping the transition zone between the two clades along the Atlantic coast of Morocco and considerably increasing the sampling across several African countries on the Eastern Atlantic, we have provided a clearer understanding of their distribution and evolutionary history. Although DNA barcodes suggested the presence of at least two species under Z. faber, further studies using morphological analysis, nuclear markers and techniques like restriction site‐associated DNA markers (Jones et al., 2013; Labrador et al., 2022) are needed to confirm its taxonomic status and clarify evolutionary relationships. Even though Z. faber is a commercially important species, its distinctive morphology – an unusual body shape, very long dorsal‐fin rays and an iconic large dark spot surrounded by a light ring on each side – may have occasionally facilitated its identification worldwide through superficial visual inspections. Thus, considering the genetic differentiation reported in this study, synonymized and invalid Zeus species’ names likely deserve a closer morphological re‐inspection. Moreover, expanding the sampling and generating DNA barcodes from additional regions will help refine the delimitation of the two clades and may uncover additional ones. Independently of the conclusions on the species status, the genetic structure here reported has potential implications for fisheries management and conservation that must be considered. Particularly in Morocco, recognizing the existence of these two clades in stock assessment is crucial, as overlooking their genetic distinction could lead to inaccurate evaluations of population health and overestimation of stock sizes (Hutchings & Reynolds, 2004; Ruzzante et al., 1997). Fisheries management in other regions should also consider these findings, as the clades and lineages here reported may have relevance for stock delimitation, fisheries sustainability, global fisheries statistics and seafood authentication.
AUTHOR CONTRIBUTIONS
Conceptualization: João Tadeu Fontes, Kenza Mokhtar‐Jamaï, Jean‐Dominique Durand, Pedro Soares and Filipe Oliveira Costa; methodology: João Tadeu Fontes, Kenza Mokhtar‐Jamaï, Jean‐Dominique Durand, Pedro Soares and Filipe Oliveira Costa; formal analysis: João Tadeu Fontes and Pedro Soares; data acquisition and processing: João Tadeu Fontes, Kenza Mokhtar‐Jamaï, Zakariya Nchioua, Jean‐Dominique Durand, Monica Landi, João Meira, Luís Machado, Ayoub Baali, Ignacio Sobrino, Emmanuel Kouamé, Béatrice Abouo Adepo‐Gourène, Mamadou Diop, Néné Gallé Kidé, Austin Saye Wehye and Zacharie Sohou; resources: Kenza Mokhtar‐Jamaï, Jean‐Dominique Durand, Iça Barri, Ignacio Sobrino, Miguel Carneiro, Rogélia Martins and Filipe Oliveira Costa; writing – original draft: João Tadeu Fontes; writing – review and editing: João Tadeu Fontes, Kenza Mokhtar‐Jamaï, Jean‐Dominique Durand, João Meira, Luís Machado, Ayoub Baali, Emmanuel Kouamé, Zacharie Sohou, Pedro Soares and Filipe Oliveira Costa. All authors reviewed and approved the final version of the manuscript.
FUNDING INFORMATION
This work was funded by the project ‘FISH‐DNA‐MONITOR: Supporting monitoring and management of fisheries resources in Guinea‐Bissau through capacity‐building on cutting‐edge DNA‐based approaches’ (FCT AGA‐KHAN/541703280/2019) funded by the Portuguese Foundation of Science and Technology (FCT, I.P.) and Aga Khan Development Network, by the CBMA ‘Contrato‐Programa’ (UIDB/04050/2020; https://doi.org/10.54499/UIDB/04050/2020), and by the ARNET ‘Contrato‐Programa’ (LA/P/0069/2020; https://doi.org/10.54499/LA/P/0069/2020), funded by national funds through FCT I.P. J.T.F. (UI/BD/150910/2021; https://doi.org/10.54499/UI/BD/150910/2021) was supported by the Collaboration Protocol for Financing the Multiannual Research Grants Plan for Doctoral Students with financial support from FCT I.P. and the European Social Fund under the Northern Regional Operational Program – Norte2020. The generation of sequence data from specimens collected in Senegal, Mauritania and Côte d'Ivoire was funded by IRD through the WAMBA‐Net International Research Network.
Supporting information
Data S1. Supporting information.
The reference list from the paper itself. Each links out to its DOI / PubMed record.
- 1Arroyave, J. , Martinez, C. M. , & Stiassny, M. L. (2019). DNA barcoding uncovers extensive cryptic diversity in the African long‐fin tetra Bryconalestes longipinnis (Alestidae: Characiformes). Journal of Fish Biology, 95, 379–392.31001832 10.1111/jfb.13987 · doi ↗ · pubmed ↗
- 2Avise, J. C. , Bowen, B. W. , & Ayala, F. J. (2016). In the light of evolution X: Comparative phylogeography. Proceedings of the National Academy of Sciences of the United States of America, 113, 7957–7961.27432955 10.1073/pnas.1604338113 PMC 4961136 · doi ↗ · pubmed ↗
- 3Avise, J. C. , Brick, K. , & Fisher, M. (2000). Phylogeography: The history and formation of species. Harvard University Press.
- 4Bandelt, H.‐J. , Forster, P. , Sykes, B. C. , & Richards, M. B. (1995). Mitochondrial portraits of human populations using median networks. Genetics, 141, 743–753.8647407 10.1093/genetics/141.2.743PMC 1206770 · doi ↗ · pubmed ↗
- 5Bargelloni, L. , Alarcon, J. , Alvarez, M. , Penzo, E. , Magoulas, A. , Reis, C. , & Patarnello, T. (2003). Discord in the family Sparidae (Teleostei): Divergent phylogeographical patterns across the Atlantic–Mediterranean divide. Journal of Evolutionary Biology, 16, 1149–1158.14640406 10.1046/j.1420-9101.2003.00620.x · doi ↗ · pubmed ↗
- 6Barton, E. D. , Arístegui, J. , Tett, P. , Cantón, M. , García‐Braun, J. , Hernández‐León, S. , Nykjaer, L. , Almeida, C. , Almunia, J. , Ballesteros, S. , Basterretxea, G. , Escánez, J. , García‐Weill, L. , Hernández‐Guerra, A. , López‐Laatzen, F. , Molina, R. , Montero, M. F. , Navarro‐Pérez, E. , Rodríguez, J. M. , … Wild, K. (1998). The transition zone of the canary current upwelling region. Progress in Oceanography, 41, 455–504.
- 7Becker, R. A. , Wilks, A. R. , & Brownrigg, R. (2022). maps: Draw Geographical Maps, 2022.
- 8Bermingham, E. , Mc Cafferty, S. S. , & Martin, A. P. (1997). Fish biogeography and molecular clocks: Perspectives from the Panamanian isthmus. In Molecular systematics of fishes (pp. 113–128). Academic Press.