Diagnostic Accuracy of the Patra Index and Red Cell Distribution Width Index in Distinguishing Beta-Thalassemia Trait From Iron Deficiency Anemia: A Retrospective Comparative Study
Satyabrata Patra, Abhirup Shome, Camellia C Patra, Sunil Kumar Mahto

TL;DR
This study compares two blood indices to help doctors tell apart beta-thalassemia trait from iron deficiency anemia, finding one to be highly specific but not perfect.
Contribution
The study evaluates the Patra index and RDWI as diagnostic tools for differentiating BTT from IDA in a real-world clinical setting.
Findings
The Patra index had 100% specificity and 83% sensitivity for identifying beta-thalassemia trait.
RDWI showed 100% sensitivity but only 81.55% specificity for the same condition.
The Patra index had a higher overall diagnostic accuracy (94.23%) compared to RDWI (87.82%).
Abstract
Background Distinguishing beta-thalassemia trait (BTT) from iron deficiency anemia (IDA) remains a clinical challenge, particularly in resource-limited settings where nutritional anemia is highly prevalent. This study aimed to compare the diagnostic accuracy of the Patra index with the red cell distribution width index (RDWI) for differentiating BTT from IDA, using high-performance liquid chromatography (HPLC) and serum ferritin as reference standards. Methods This retrospective diagnostic accuracy study was conducted at Rajendra Institute of Medical Sciences, Ranchi, India. A total of 156 patients diagnosed with either BTT or IDA were included. BTT was defined as hemoglobin A2 (HbA2) > 3.5%, and IDA as serum ferritin < 15 ng/mL with HbA2 < 3.5%. The Patra index was calculated as mean corpuscular volume divided by red cell distribution width (MCV/RDW), with a cutoff of ≥5.3 for BTT.…
Genes, proteins, chemicals, diseases, species, mutations and cell lines named across the full text — each resolved to its canonical identifier and authoritative record.
Click any figure to enlarge with its caption.
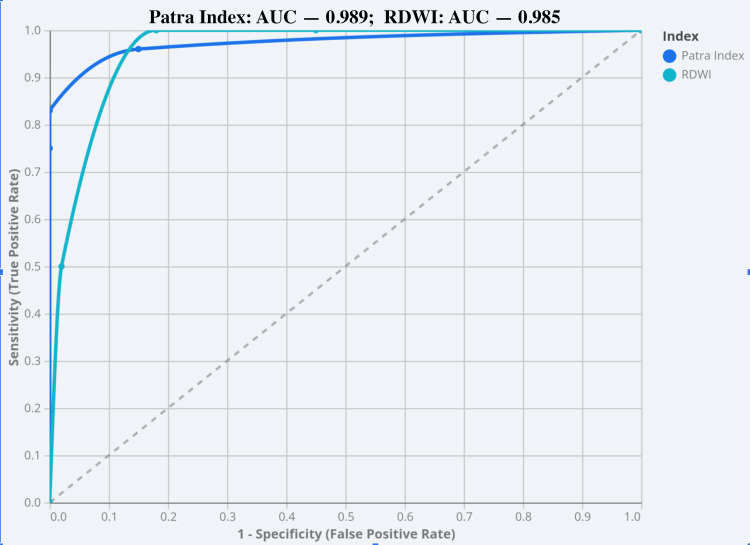 Figure 1
| Parameter | BTT (mean ± SD) | IDA (mean ± SD) |
| RBC (×10⁶/µL) | 5.81 ± 0.21 | 4.52 ± 0.64 |
| Hb (g/dL) | 10.33 ± 0.56 | 8.92 ± 0.88 |
| MCV (fL) | 63.85 ± 2.23 | 71.92 ± 3.86 |
| RDW (%) | 11.92 ± 0.47 | 17.08 ± 2.34 |
| RDWI | 131.62 ± 13.71 | 283.55 ± 74.87 |
| Patra index | 5.36 ± 0.13 | 4.27 ± 0.47 |
| Diagnostic parameter | Patra index (≥5.3) | RDWI (<220) |
| True positives (TP), n | 44 | 53 |
| True negatives (TN), n | 103 | 84 |
| False positives (FP), n | 0 | 19 |
| False negatives (FN), n | 9 | 0 |
| Sensitivity (%) | 83.02% | 100.00% |
| Specificity (%) | 100.00% | 81.55% |
| Positive predictive value (PPV) (%) | 100.00% | 73.61% |
| Negative predictive value (NPV) (%) | 91.96% | 100.00% |
| Youden index | 0.83 | 0.816 |
| Diagnostic efficiency (%) | 94.23% | 87.82% |
| Diagnostic parameter | Patra index (≥5.3) | RDWI (<220) |
| Sensitivity | 83.02% (95% CI: 70.2%-91.9%) | 100.00% (95% CI: 93.3%-100.0%) |
| Specificity | 100.00% (95% CI: 96.5%-100.0%) | 81.55% (95% CI: 72.7%-88.5%) |
| PPV | 100.00% (95% CI: 92.0%-100.0%) | 73.61% (95% CI: 62.0%-83.2%) |
| NPV | 91.96% (95% CI: 85.3%-96.3%) | 100.00% (95% CI: 95.7%-100.0%) |
| Diagnostic efficiency | 94.23% (95% CI: 89.3%-97.3%) | 87.82% (95% CI: 81.6%-92.5%) |
| Patra index result | BTT (reference +) | IDA (reference −) | Total |
| Test positive | 44 (100.0%) | 0 (0.0%) | 44 (28.2%) |
| Test negative | 9 (8.0%) | 103 (92.0%) | 112 (71.8%) |
| Total | 53 (34.0%) | 103 (66.0%) | 156 (100%) |
| RDWI result | BTT (reference +) | IDA (reference −) | Total |
| Test positive | 53 (73.6%) | 19 (26.4%) | 72 (46.2%) |
| Test negative | 0 (0.0%) | 84 (100.0%) | 84 (53.8%) |
| Total | 53 (34.0%) | 103 (66.0%) | 156 (100%) |
Peer Reviews
No public reviews on file for this paper yet. If you reviewed it on a platform where reviews are public (OpenReview, ICLR, NeurIPS, ICML), you can paste yours below so the community can read it here.
Videos
No videos yet. Explain this paper in a talk, walkthrough, or lecture? Add one.
Taxonomy
TopicsHemoglobinopathies and Related Disorders · Iron Metabolism and Disorders · Inflammatory Biomarkers in Disease Prognosis
Introduction
Differentiating beta-thalassemia trait (BTT) from iron deficiency anemia (IDA) remains a longstanding diagnostic challenge in routine clinical practice [1]. This issue is particularly pronounced in populations where both malnutrition-related IDA and BTT are prevalent, as patients often present with overlapping hematological features [2,3].
High-performance liquid chromatography (HPLC) remains the gold standard for diagnosing BTT, while serum ferritin is the reference standard for IDA [4]. However, ferritin interpretation may be confounded by inflammatory states, and both HPLC and ferritin testing are often unavailable in resource-constrained settings, including many district-level hospitals [4,5]. Consequently, clinicians in these settings frequently rely on complete blood count (CBC) parameters and derived red cell indices for preliminary evaluation [5,6].
Among these indices, the Mentzer index is the most widely used globally, followed by the red cell distribution width index (RDWI) [7,8]. Nevertheless, several studies have demonstrated that the diagnostic performance of these indices is limited in populations with a high prevalence of nutritional deficiencies, where patients may exhibit features of both BTT and IDA. This compromises their utility as standalone screening tools [5,6,9].
Given these limitations, there is a need to evaluate simpler, readily accessible indices that maintain acceptable diagnostic accuracy in resource-limited settings with overlapping BTT and IDA features. The Patra index, defined as the ratio of mean corpuscular volume (MCV) to red cell distribution width (RDW), has been proposed as a potential alternative. However, evidence regarding its performance remains limited.
The present study aims to compare the diagnostic accuracy of the Patra index with RDWI in differentiating BTT from IDA, using HPLC and serum ferritin as reference standards.
Materials and methods
Study design
This hospital-based, retrospective diagnostic accuracy study was conducted to evaluate the performance of the Patra Index and RDWI in distinguishing between BTT and IDA.
Study setting and duration
The study was carried out in the Department of Pathology at Rajendra Institute of Medical Sciences, Ranchi, India. Patient records were retrospectively reviewed over an 18-month period to ensure sufficient case accrual for diagnostic performance analysis and receiver operating characteristic (ROC) curve evaluation.
Study population and eligibility criteria
Patients evaluated for microcytic anemia and diagnosed with either BTT or IDA based on predefined reference standards were included. BTT was defined as hemoglobin A2 (HbA2) > 3.5% on HPLC, while IDA was defined as serum ferritin < 15 ng/mL with HbA2 < 3.5%. Cases meeting both biochemical criteria were excluded to maintain mutually exclusive diagnostic groups. Additional exclusion criteria were incomplete records, ongoing empirical iron therapy, and lack of informed consent.
Sample size
As a retrospective study, no formal a priori sample size calculation was performed. All eligible cases during the study period were included, resulting in a total of 156 patients: 53 with BTT and 103 with IDA. Detailed demographic and clinical variables, including age stratification, pregnancy status, inpatient versus outpatient classification, comorbidities, and recent transfusion history, were inconsistently available and therefore not included in the analysis.
Ethics statement
The study was approved by the Institutional Ethics Committee of Rajendra Institute of Medical Sciences, Ranchi, India (ECR/769/INST/JH/2015/RR-21; Letter No. 132, Dated: 10/04/2024). Patient confidentiality was maintained throughout the study.
Laboratory parameters and index calculations
Peripheral blood samples were collected in EDTA vials and analyzed using a Horiba Yumizen H2500 CBC analyzer (Horiba, Ltd., Kyoto, Japan). The recorded parameters included total red blood cell (RBC) count, MCV, mean corpuscular hemoglobin (MCH), hemoglobin (Hb), mean corpuscular hemoglobin concentration (MCHC), and red cell distribution width (RDW).
The Patra Index was calculated as MCV ÷ RDW. The RDWI was calculated as (MCV × RDW) ÷ RBC, with a predefined cutoff of <220 for BTT and >220 for IDA [7].
Reference standard
Index-based diagnoses were compared against the reference standards. BTT was confirmed by HPLC (HbA2 > 3.5%), and IDA was confirmed by serum ferritin < 15 ng/mL with HbA2 < 3.5%.
Statistical analysis
For each index, sensitivity, specificity, positive predictive value (PPV), negative predictive value (NPV), and corresponding 95% confidence intervals (CIs) were calculated. ROC curve analysis was performed, and the area under the curve (AUC) with 95% CI was estimated to assess discriminatory performance at the predefined cutoff values.
Results
A total of 156 patients were included in the study. Based on HPLC and serum ferritin measurements, 53 patients (33.97%) were diagnosed with BTT, while 103 patients (66.03%) were diagnosed with IDA. Among patients with BTT, 29 (54.7%) were male, and 24 (45.3%) were female. In contrast, the IDA group was predominantly female, comprising 74 patients (71.8%), with males accounting for 29 patients (28.2%).
Baseline CBC parameters for both groups are summarized in Table 1. Patients with BTT exhibited higher mean RBC counts and lower RDW values compared with those with IDA. Mean Hb and MCV also differed between the two groups, reflecting characteristic hematological distinctions between BTT and IDA.
At the cutoff value of ≥5.3 for the Patra index to diagnose BTT, 44 true-positive and 103 true-negative cases were observed, along with 9 false-negative and no false-positive cases. The sensitivity was 83.02% (95% CI: 70.2%-91.9%), and the specificity was 100.00% (95% CI: 96.5%-100.0%). The PPV was 100.00% (95% CI: 92.0%-100.0%), and the NPV was 91.96% (95% CI: 85.3%-96.3%), with a Youden index of 0.83.
Using a cutoff value of <220 for RDWI to diagnose BTT, 53 true-positive and 84 true-negative cases were observed, along with 19 false-positive and no false-negative cases. The sensitivity was 100.00% (95% CI: 93.3%-100.0%), and the specificity was 81.55% (95% CI: 72.7%-88.5%), with a PPV of 73.61% (95% CI: 62.0%-83.2%), an NPV of 100.00% (95% CI: 95.7%-100.0%), and a Youden index of 0.816.
The overall diagnostic efficiency was 94.23% (95% CI: 89.3%-97.3%) for the Patra index and 87.82% (95% CI: 81.6%-92.5%) for RDWI. These findings are summarized in Table 2 and Table 3.
The Patra index exhibited superior specificity, PPV, overall diagnostic efficiency, and Youden index compared to RDWI, whereas RDWI demonstrated higher sensitivity.
ROC curve analysis was performed to evaluate the discriminatory performance of both indices (Figure 1). The Patra index yielded an AUC of 0.989 (95% CI: 0.975-1.000), whereas RDWI showed an AUC of 0.958 (95% CI: 0.924-0.992), both demonstrating high statistical significance (p < 0.0001). The higher AUC and narrower CI for the Patra index indicate superior overall diagnostic performance in distinguishing BTT from IDA.
Receiver operating characteristic curve of the Patra index for differentiating beta-thalassemia trait and iron deficiency anemia
The cross-classification of index test results against the reference standard is shown in Table 4 and Table 5.
Table 5: Cross-classification of red cell distribution width index results against the reference standard diagnosisValues are expressed as number (percentage). Reference standard diagnosis was based on HPLC for BTT and serum ferritin estimation for IDA. A cutoff value of <220 was used for the RDWI to indicate BTT.BTT: beta-thalassemia trait, IDA: iron deficiency anemia, RDWI: red cell distribution width index.
Discussion
In the present study, the Patra index demonstrated high diagnostic accuracy for differentiating BTT from IDA, with particularly high specificity and overall diagnostic efficiency. The study population predominantly included individuals from a demographic in which both IDA and BTT are highly prevalent [10,11]. In this cohort of biochemically defined BTT and IDA cases, the Patra index performed well; however, cases with overlapping BTT-IDA pathology were not analyzed, and its performance in such mixed cases cannot be inferred. Previous studies have shown that overlapping pathologies may compromise the performance of many traditionally used red cell indices [5,6].
Iron deficiency, the primary cause of IDA in populations with micronutrient deficiencies, leads to increased red cell heterogeneity and elevated RDW, disproportionately affecting indices that rely heavily on RDW or complex combinations of multiple CBC parameters [12,13]. This explains the inconsistent performance of classical discriminant indices, such as the Shine and Lal index, which, despite high sensitivity, often demonstrate low specificity and a high false-positive rate for BTT [5,14,15]. Similarly, indices like Ricerca and Shine and Lal tend to overclassify IDA as BTT due to their sensitivity-weighted design [14-16].
Other indices, including the Srivastava index and England and Fraser index, have shown acceptable specificity but reduced sensitivity in nutritionally challenged populations [15,17,18]. This limitation arises from reliance on Hb and RBC counts, which fluctuate with nutritional status and inflammatory conditions. The Green and King index also demonstrates high specificity but low sensitivity, with inconsistent accuracy across different populations and regions [5,15,19,20]. Likewise, the Kerman index exhibits moderate and variable sensitivity and specificity, limiting its utility as a screening tool [19,21].
More recently proposed indices, such as the CRUISE index, show promising diagnostic accuracy; however, they incorporate multiple parameters with weighted coefficients, which limits ease of use and reproducibility in routine practice, particularly in peripheral healthcare settings [22]. Additionally, the performance of these newer indices has yet to be validated across populations with a high burden of nutritional anemia.
Systematic evaluations, including a meta-analysis by Hoffmann et al., have highlighted that indices such as the microcytic to hypochromic ratio (M/H ratio), Ehsani index, RBC count, and Sirdah index demonstrate high AUC values, whereas commonly used indices like the Mentzer index and RDWI show intermediate performance [19]. Notably, these analyses also emphasize substantial heterogeneity in index performance across age groups and populations, with poorer performance in children and nutritionally challenged cohorts.
Pediatric-specific studies indicate that while the Mentzer index may achieve the highest Youden index, Shine and Lal and Ricerca indices tend to have high sensitivity but low specificity [8,14,16,23]. These findings suggest that indices optimized for sensitivity alone may perform poorly in real-world settings, where a balanced diagnostic accuracy is critical.
In this context, the Patra index appears biologically and methodologically sound. Unlike RDWI, it does not amplify RDW-related variability, and unlike complex indices such as CRUISE, it remains simple and easy to calculate. By retaining sensitivity to microcytosis while attenuating the confounding effects of iron deficiency-induced anisocytosis, the Patra index achieves higher specificity and overall diagnostic efficiency in populations with prevalent iron deficiency. Moreover, it relies on universally reported CBC parameters and does not require analyzer-specific or advanced red cell measurements, making it suitable for implementation in primary health centers and district hospitals with limited laboratory resources.
This study has several limitations. First, the retrospective, single-center design may limit generalizability. Second, detailed baseline clinical variables, such as age stratification, pregnancy status, comorbidities, and recent transfusion history, were inconsistently available and may influence RDW values. Third, while the proposed cutoff of ≥5.3 yielded high specificity, sensitivity remained moderate, which may result in missed BTT cases in high-prevalence regions. Finally, this study utilized a single hematology analyzer, and inter-analyzer variability in RDW and MCV measurements may affect index performance; external validation across diverse laboratory platforms is therefore warranted.
In conclusion, the Patra index may serve as a cost-effective and simple adjunct or triage tool for differentiating BTT from IDA in resource-limited settings. However, it cannot replace confirmatory biochemical testing, including HbA2 estimation. Future prospective studies with well-defined inclusion criteria and broader population representation are necessary to further validate the reliability and diagnostic performance of the Patra index.
Conclusions
The Patra index is a simple, cost-effective tool that demonstrates high specificity for differentiating biochemically confirmed BTT from IDA in this cohort. However, its moderate sensitivity limits its utility as a standalone screening test, and it cannot replace confirmatory biochemical evaluation. When applied as an adjunct or triage tool, particularly in resource-limited settings, it may help stratify patients and prioritize those requiring further confirmatory testing. Larger, prospective, multicenter studies are needed to validate its generalizability across diverse populations and laboratory platforms.
The reference list from the paper itself. Each links out to its DOI / PubMed record.
- 1Diagnostic potential of haematological indices (Mentzer index and RDWI) to distinguish iron deficiency anemia and βTTJ Fatima Jinnah Med Univ Munir A Rahim A Zafar F Haseeb H Zahid R 7881182024 https://www.jfjmu.com/index.php/ojs/article/view/1245
- 2Utility of blood indices and parameters for differentiating iron deficiency anaemia and β-thalassemia trait by calculating various discriminant functions Paripex Indian J Res Davda M Patel S Chothani K Upadhyay J 144146102021 https://www.worldwidejournals.com/paripex/recent_issues_pdf/2021/February/utility-of-blood-indices-and-parameters-for-differentiating-iron-deficiency-anaemia-and-thalassemia-trait-by-calculating-various-discriminant-functions_February_2021_9167713934_3911810.pdf
- 3Evaluation of the discrimination between beta-thalassemia trait and iron deficiency anemia using different indexes Int J Biomedicine Elshaikh RH Amir R Ahmeide A 375379122022 https://www.ijbm.org/articles/i 47/ijbm_12(3)_oa 4.pdf
- 4Discriminant indices for screening beta thalassemia trait: an illusion of choice Indian J Hematol Blood Transfus Kakkar N Sharma A 3243253720213386774110.1007/s 12288-020-01330-8PMC 8012444 · doi ↗ · pubmed ↗
- 5Patra index and Mentzer index - a retrospective comparative study to differentiate beta-thalassemia trait from iron deficiency anemia J Family Med Prim Care Patra S Shome A Patra CC Mahto SK 456845731420254140352610.4103/jfmpc.jfmpc_2075_24PMC 12705022 · doi ↗ · pubmed ↗
- 6Diagnostic performance of hematological discrimination indices to discriminate between βeta thalassemia trait and iron deficiency anemia and using cluster analysis: introducing two new indices tested in Iranian population Sci Rep Jahangiri M Rahim F Malehi AS 18610920193181907810.1038/s 41598-019-54575-3PMC 6901548 · doi ↗ · pubmed ↗
- 7Red cell distribution width as a measure of severity of iron deficiency in iron deficiency anaemia Indian J Med Res Das Gupta A Hegde C Mistri R 1771831001994 https://pubmed.ncbi.nlm.nih.gov/7851969/7851969 · pubmed ↗
- 8Differentiation of iron deficiency from thalassemia trait Lancet Mentzer WC Jr 8823011973 https://www.thelancet.com/journals/lancet/article/PIIS 0140-6736(73)91446-3/fulltext 10.1016/s 0140-6736(73)91446-34123424 · doi ↗ · pubmed ↗