Plant responses to gaseous pollutants, biochemical and transcriptomic insights
Malik Urfa Gul, M. Junaid Gul, Muhammad Hafiz Raza Ur Rehman, Gyu Sang Choi, Chang-Hyeon Park

TL;DR
This paper explores how plants respond to multiple air pollutants by connecting atmospheric exposure to cellular effects and offering a framework for modeling plant responses.
Contribution
The novelty is integrating diverse pollutant mechanisms into shared biochemical nodes for practical, quantitative modeling of plant responses.
Findings
Multi-pollutant effects converge on redox signaling and antioxidant systems.
Stomatal uptake and speciation drive pollutant-specific cellular impacts.
Mechanistic fingerprints can guide model design and predict yield risks.
Abstract
Atmospheric gaseous pollutants sulfur dioxide (SO2), nitrogen oxides (NOx), ozone (O3), and carbon monoxide (CO) increasingly co-occur in crop canopies and cause damage that spans atmospheric chemistry, redox signaling, and whole-leaf function. Prior work is often fragmented by single pollutant, single endpoints, or single scale, which limits mechanistic comparability and makes it difficult to build computationally useful models that generalize across environments. This synthesis integrates the atmospheric-to-cellular continuum in a form tended for quantitative plant science and computational researchers. We connect pollutant formation and microclimate-driven exposure to stomatal uptake, apoplastic speciation, subcellular targets, and downstream impacts on photosynthesis, respiration, and stomatal regulation. At the biochemical level, we unify key reaction routes and control points, SO2…
Genes, proteins, chemicals, diseases, species, mutations and cell lines named across the full text — each resolved to its canonical identifier and authoritative record.
Click any figure to enlarge with its caption.
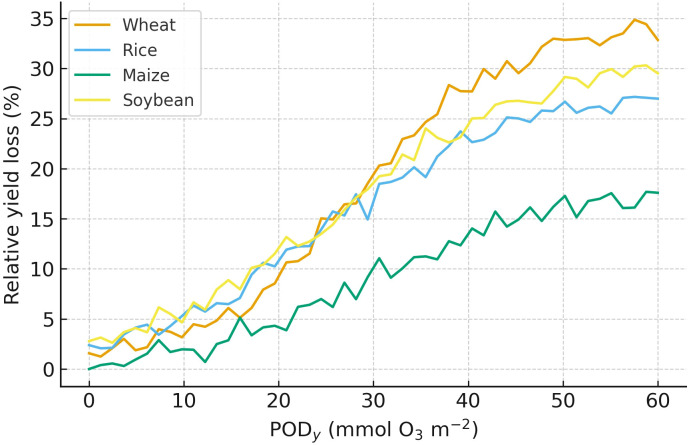 Figure 1
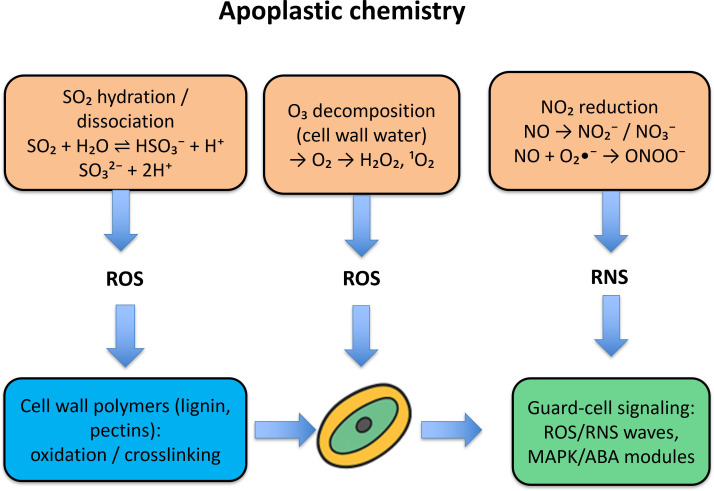 Figure 2
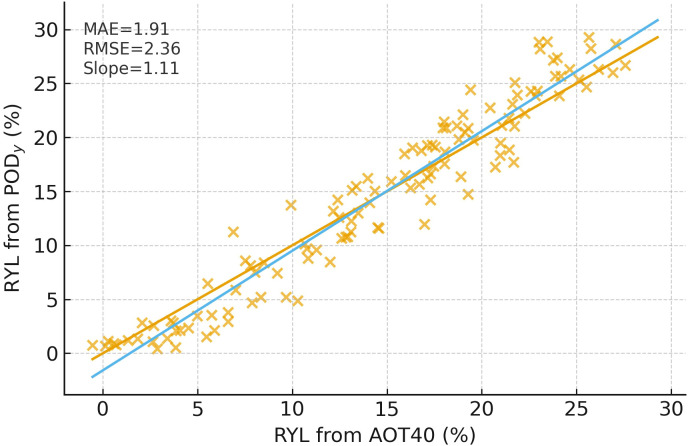 Figure 3
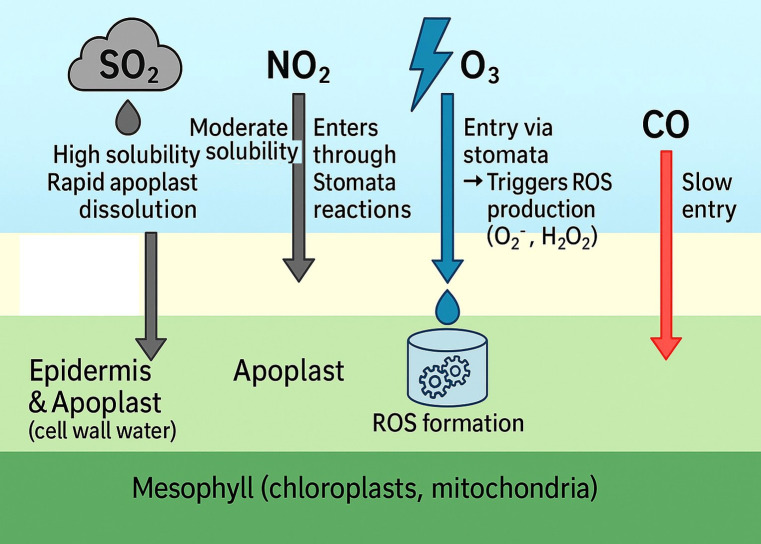 Figure 4
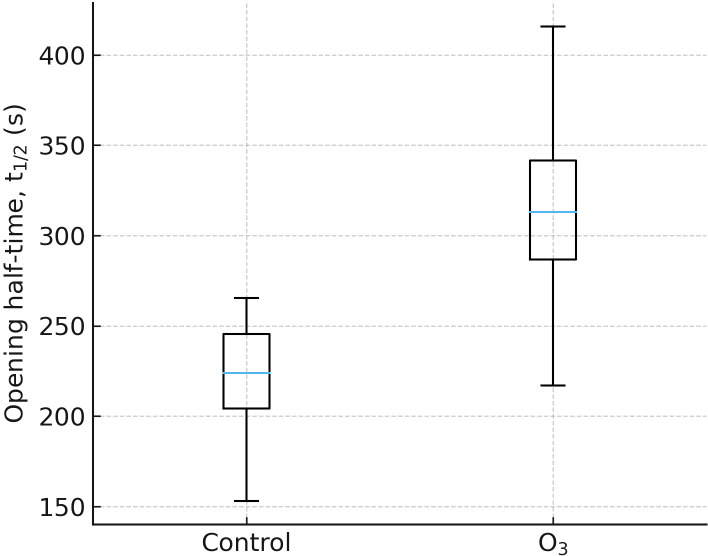 Figure 5
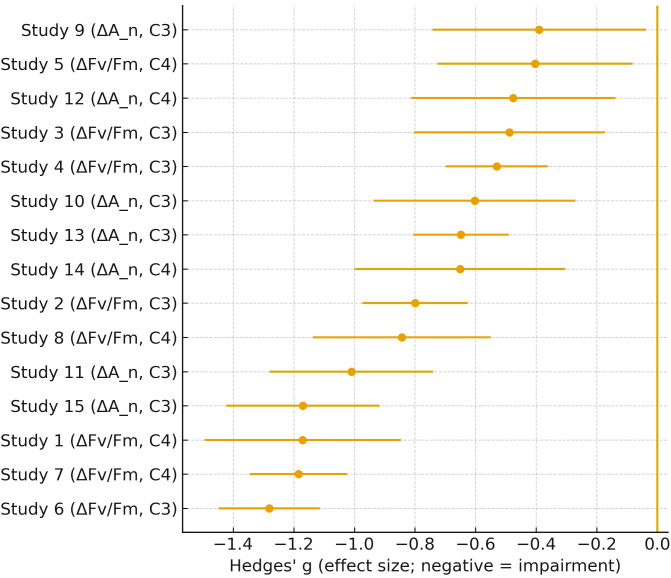 Figure 6
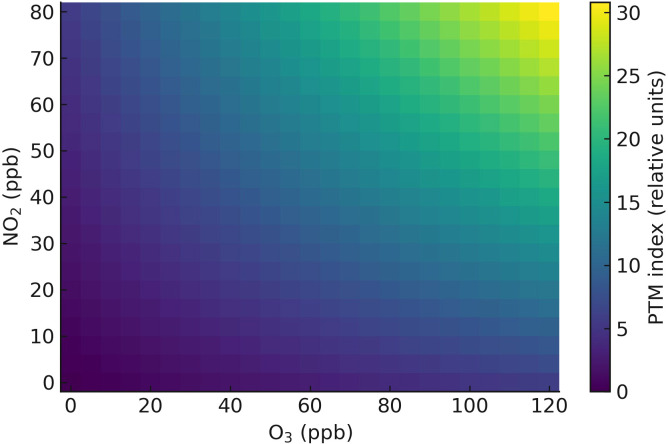 Figure 7
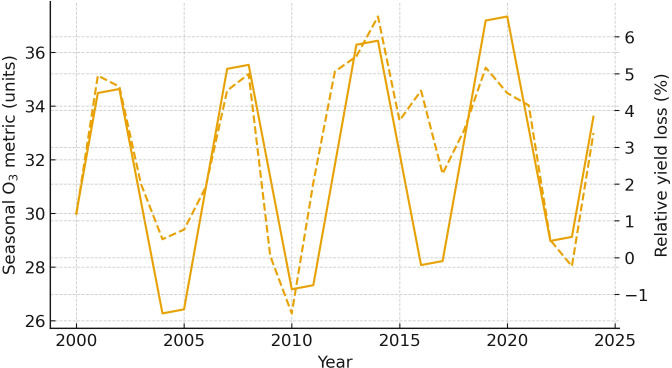 Figure 8
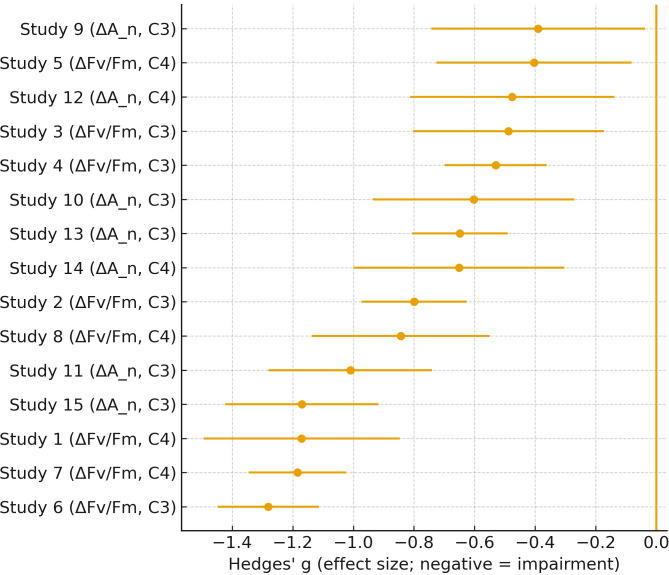 Figure 9
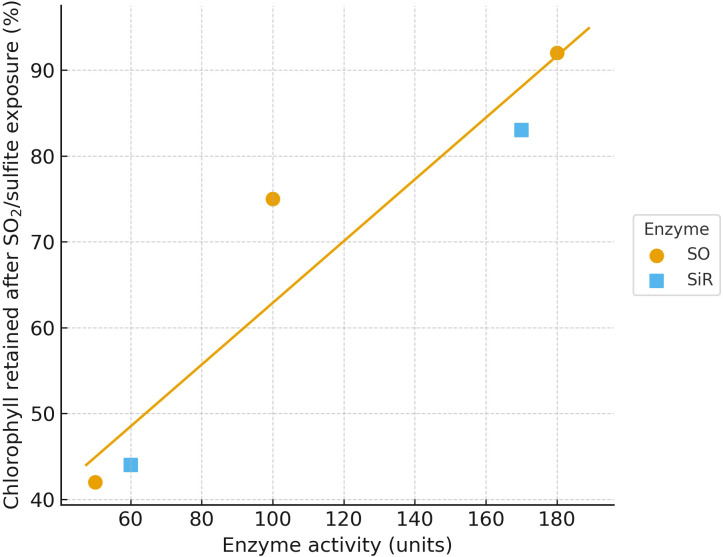 Figure 10
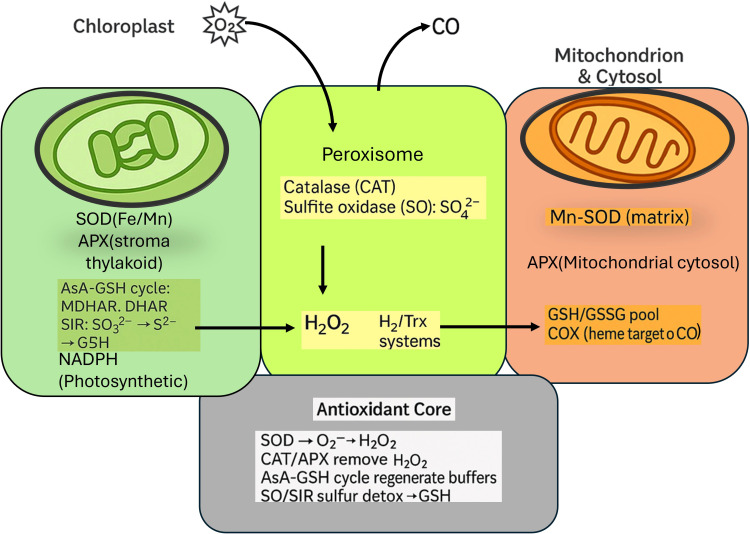 Figure 11
| Year | Pollutant | Method | Key bio chemial focus | Major finding | Ref. |
|---|---|---|---|---|---|
| 2025 | O3 | Modeling & obs | Photosynthesis, LAI/GPP feed- backs | O3 lowers GPP, raises stomatal resistance; regional feedbacks on meteorology/air quality. | Ozone dry deposition through plant stomata ( |
| 2025 | O3 | China | Yield loss | ~4% yield loss (2013–2018) across four major crops due to O3. | Worsened Ozone Pollution Exacerbates the Loss of Agricultural Production in China ( |
| 2025 | RNS | Review | Nitro-oxidative nucleotide mods | Details RNA/DNA | Nitro-oxidative nucleotide |
| 2024 | O3 | Review | Physiology | O3 suppresses photosynthesis/growth; | An ozone gradient experiment ( |
| 2024 | O3 | Crop model (GMD) | Dose response | Yield declines above | Modeling the effects of tropospheric ozone on the growth and yield of global staple crops with DSSAT v4.8.0 ( |
| 2024 | O3 | Regional Meteor- | Semi-empirical new parameterization | parameterization links O3 exposure to photosynthesis/stomata. | scheme for photosynthetic and stomatal responses ( |
| 2024 | NO2 | Arabidopsis (physiol.) | Apoplast chemistry | NO2 absorbed Via stomata; | Field investigation of leaf-level NO and NO2 exchange between atmosphere and mature Pinus massoniana in a subtropical forest ( |
| 2023 | O3 | Regional Plant | Implements a semi- | Effects of Elevated | Ozone Exposure on Regional Meteorology and Air Quality in China Through Ozone-Vegetation Coupling ( |
| 2023 | O3 | Ecology review | Biomass | Summarizes root: shoot, reproduction, survival changes from O3 injury. | Estimates of biomass reductions of ozone sensitive herbaceous plants in California ( |
| 2023 | NO | Review | S-nitrosylation | ROS–RNS in stress signaling. | Functions of nitric oxide-mediated post-translational modifications under abiotic stress ( |
| 2022 | O3 | Arabidopsis (omics) | Shared | O3 and NO2 induce similar transcriptional responses; genotype varies in cell death. | Ozone and nitrogen dioxide regulate similar gene expression responses in Arabidopsis but natural variation in the extent of cell death is likely controlled by different genetic loci ( |
| 2021 | O3 | Methods | Exposure | Methods synthesis notes larger O3 yield penalties in FACE (rice/wheat) than OTC; experimental setup matters for DRRs. | Approaches to investigate crop responses to ozone pollution: from O3-FACE to satellite-enabled modeling ( |
| 2022 | CO | Arabidopsis (development) | HO- | Endogenous/exogenous CO promotes stomatal initiation via EPF2/STOMAGEN axis. | Carbon monoxide pro- |
| 2021 | SO2 | Arabidopsis | SO/SiR detox | Modulating sulfite oxidase activity shifts sulfite toxicity outcomes; links to sulfur/carbon metabolism and GSH/Cys pools. | Level of Sulfite Oxidase Activity Affects Sulfur and Carbon Metabolism in Arabidopsis ( |
| Year | Region/System | Pollutant(s) | Method/Setting | Key focus | Headline finding |
|---|---|---|---|---|---|
| 2019 | Europe (wheat & potato) | O3 | Policy-grade POD6_spec flux modeling + monetization | Flux → yield → € losses | O3 caused significant POD-based losses; ~€680 M potato loss estimated; report recommends POD over exposure indices for crops ( |
| 2025 | South Korea (rice) | O3 + heat | Growth-chamber factorials | Co-stress physiology | Warming (+1.5 to +3 °C) amplified O3 yield penalties; elevated O3 alone cut yield; combined stress worst-case ( |
| 2025 | Global agriculture | O3 (omission bias) | Earth’s Future statistical meta-analysis | Method sensitivity | Leaving O3 out of yield–temperature models inflate warming damages; O3 must be included for credible attribution ( |
| 2024, 2025 | Global crop modeling | O3 | GMD: integrate O3 stress into a process-based crop model | Model capability | Demonstrates adding O3 damage (photosynthesis ↓, senescence ↑) to a global crop model; enables forward projections with chemistry–crop coupling ( |
| 2024 | India (rice varieties) | O3 × CO2 (management) | Frontiers field/OTC style | N management under O3 | Extra nitrogen partially sustains rice yield under elevated O3×CO2; management modifies O3 risk ( |
| 2024 | Mediterranean grassland | O3 | STOTEN field study | Nutrient modulation | Nitrogen supply modulates O3 response; dose-based POD better captures injury than exposure metrics ( |
| 2025 | China (rice physiology) | O3 | Chamber season-long exposure | Grain filling & quality | O3 impedes grain-filling and degrades quality, mechanistic detail on spikelet position sensitivity ( |
| 2025 | Policy level (global) | O3 (via CH4 cuts) | Environmental Pollution analysis | Mitigation co-benefit | Methane control yields additional reductions in O3-induced crop losses beyond climate benefits ( |
| 2025 | East & SE Asia (exposure) | O3 | ACP integrated assessment | Trend context | 1995–2019 shows rising O3 across E/SE Asia (drivers & attributions), setting the exposure backdrop for crop risk ( |
Peer Reviews
No public reviews on file for this paper yet. If you reviewed it on a platform where reviews are public (OpenReview, ICLR, NeurIPS, ICML), you can paste yours below so the community can read it here.
Videos
No videos yet. Explain this paper in a talk, walkthrough, or lecture? Add one.
Taxonomy
TopicsPlant responses to elevated CO2 · Atmospheric chemistry and aerosols · Photosynthetic Processes and Mechanisms
Introduction
1
Over the past century, anthropogenic activities such as industrialization, vehicular emissions, power generation, and urbanization have profoundly altered the composition of Earth’s atmosphere (Hale, 1993). Among the most pervasive changes is the increased concentration of reactive gaseous pollutants, particularly sulfur dioxide (SO_2_), nitrogen oxides (NO_x_), ozone (O_3_), and carbon monoxide (CO) (Meo and Ayoub, 2024). These gases, emitted through combustion processes, fossil fuel use, and industrial exhausts, are not only central to atmospheric chemistry but also potent agents of biological disruption in terrestrial ecosystems (Odubo et al., 2024). Plants, being the primary autotrophs and dominant surface interface in terrestrial biomes, are chronically exposed to these gaseous toxins through stomatal uptake and surface adsorption (Landmeyer, 2012). While the broader ecological impacts of air pollution are widely acknowledged, the biochemical mechanisms by which these atmospheric gases interfere with core physiological processes such as respiration, photosynthesis, and stomatal function remain underexamined in an integrated framework (Husen, 2021).
The biochemical consequences of pollutant exposure in plants are multifaceted and highly reactive. For instance, SO_2_, after entering the leaf apoplast, is hydrated to form bisulfite (HSO_3_^-^) and sulfite (SO_3_²^-^), which are strong nucleophiles capable of reacting with chlorophyll, DNA bases, and thiol-containing proteins (Singh and Lamabam, 2012; Majumdar, 2023). These reactions lead to degradation of chloroplast pigments, inhibition of enzymatic function, and altered redox signaling (Brychkova, 2007). NO_x_ gases, particularly NO and NO_2_, enter the mesophyll and participate in redox cycling, producing reactive nitrogen species (RNS) such as peroxynitrite (ONOO^-^), which induce oxidative and nitrosative stress (Corpas and Barroso, 2013a). Ozone (O_3_), a secondary pollutant formed via photochemical reactions involving NO_x_ and VOCs, is perhaps the most phytotoxic gas due to its high oxidative potential (Monks, 2015). Upon entry through stomata, O_3_ decomposes to singlet oxygen and superoxide radicals, which damage cellular membranes, photosystem II proteins, and metabolic enzymes. Even CO, though relatively less reactive in air, interferes with heme-containing respiratory enzymes by competitively binding to cytochrome oxidase, impeding electron transport in both mitochondria and chloroplasts (Pellegrini, 2011; Muneer, 2014). CO is included not as a generic “damage gas,” but because its heme affinity provides a plausible route to constrain respiration-linked electron transport and to modulate stress signaling, particularly when oxidative or nitrosative load is already elevated.
The implications of these pollutant-induced disruptions are far-reaching. At the cellular level, damage to chloroplasts impairs carbon fixation and energy metabolism. At the tissue level, changes in stomatal aperture and dynamic transpiration affect water use efficiency and nutrient uptake (Ran, 2017). These physiological stress responses cascade into reduced plant productivity, altered phenology, and increased vulnerability to pathogens. Importantly, such stress syndromes are not confined to agricultural crops alone; forest trees, ornamental plants, and natural vegetation are equally susceptible, threatening both biodiversity and ecosystem services (Duque et al., 2021; Cheesman, 2024). Furthermore, since plants serve as the foundational trophic level in most food webs, their compromised function under air pollution not only jeopardizes food security but also influences the global carbon cycle and climate feedback mechanisms (Zhu et al., 2022; Mao et al., 2024). What is missing, and what the title implies, is an omics-grounded synthesis. Many pollutant studies now report transcriptomic responses, yet the gene-level outputs are typically presented as long lists of differentially expressed genes with limited cross-pollutant mapping. Without linking transcriptional programs to shared biochemical state variables (redox buffering, sulfur assimilation demand, electron-transport constraint, guard-cell regulation), transcriptomic results remain descriptive and cannot reliably explain why mixtures behave differently from single gases. In practice, pollutant tolerance is often controlled by the interaction between early redox chemistry and downstream gene regulation, including antioxidant reprogramming, sulfur and nitrogen metabolism, hormone and MAPK signaling, and stomatal regulatory modules. This is the exact point where transcriptomic insights should strengthen mechanistic inference, but current reviews rarely organize the evidence in a way that makes this connection explicit across gases.
Recent studies have increasingly highlighted the biochemical dimension of air pollution effects on vegetation. For example, researchers demonstrated that elevated tropospheric ozone concentrations significantly suppress Rubisco activity and photosynthetic rate in wheat cultivars (Feng, 2024). Similarly, A study provided a mechanistic overview of how NO_2_ alters antioxidant enzyme dynamics in crop plants, contributing to premature leaf senescence (Liu et al., 2015). Other investigations have shown that SO_2_ exposure modulates sulfur metabolism, leading to accumulation of non-protein thiols like glutathione as part of a detoxification response. These studies underscore that pollutant-plant interactions are governed by a reactive coupling between pollutant chemistry and plant redox and regulatory networks, rather than being explained only as a generic physical stress (Yarmolinsky et al., 2013; Li et al., 2022).
Despite this, most research remains compartmentalized, focused either on specific pollutants or isolated plant responses. What remains lacking is a comprehensive survey that maps the full chemical reactivity of major gaseous pollutants across plant physiological systems (Concas et al., 2021; Custer and Dini-Andreote, 2022; Ossola and Farmer, 2024; Upadhayay et al., 2024). This review addresses that gap by synthesizing recent findings on pollutant chemistry, reaction mechanisms inside plant tissues, and their downstream physiological effects. In doing so, it contributes to a deeper understanding of plant resilience, the biochemical basis of pollutant toxicity, and potential strategies for developing pollution-tolerant crops.
Given the rising levels of air pollution globally, particularly in rapidly urbanizing regions, and the accelerating climate crisis, understanding how gaseous pollutants chemically interact with plant metabolism is both timely and critical. Not only does it inform plant science and environmental chemistry, but it also carries implications for sustainable agriculture, ecosystem management, and public health. Plants serve as natural bioindicators of atmospheric quality, and their health reflects the condition of our environment. Hence, safeguarding plant physiological integrity in polluted atmospheres is directly linked to preserving ecological balance and human well-being.
The main gap is structural. Right now, there is no single, consistent way to connect what plants actually experience in the field, meaning exposure and stomatal uptake, with the shared biochemical choke points they hit and the transcriptomic programs that report those hits. Because those pieces are usually treated separately, cross-pollutant comparisons stay weak, and mixture effects remain hard to reason about. In this work, we bring them together in one integrative framework. We address this gap by organizing SO_2_, NO_x_, O_3_, and CO around a common set of convergence nodes, including ROS and RNS buffering, antioxidant cycling, electron-transport constraints, sulfur detoxification demand, and guard-cell stability. We then organize both pollutant-specific and shared transcriptional responses around those same nodes, so gene-level signals can be interpreted in a mechanistic context rather than as disconnected lists. Finally, we express the combined biochemical and transcriptomic evidence as mechanistic fingerprints that are usable for modeling and prediction. This structure can support process-based constraints in learning models, hybrid mechanistic-ML predictors, and network or graph views that connect redox control, metabolism, and regulation under realistic multi-pollutant atmospheres. Throughout the paper, we also point to practical validation routes, including controlled exposure platforms and flux-resolved datasets that link stomatal uptake to biochemical markers, omics readouts, and yield-relevant traits.
This manuscript is structured to move from background evidence to cross-pollutant synthesis. We begin with the literature review, which summarizes recent biochemical and transcriptomic findings and explains why results are still difficult to compare across gases. Next, the overview of atmospheric gaseous pollutants introduces the exposure context, the atmospheric chemistry section summarizes key reaction pathways for each gas, and the mechanisms of pollutant interaction with plant surfaces section links entry routes to defense and injury processes. We then consolidate the main insights in the comparative synthesis and agronomic evidence section, before closing with the knowledge gaps and future directions section and the conclusion.
Literature review
2
Tropospheric ozone (O_3_) arises photochemically from NO_x_ (NO + NO_2_) and VOCs; it is a strong electrophilic oxidant that diffuses through stomata and decomposes in the apoplast to ROS (•O_2_^-^/H_2_O_2_), damaging membranes, PSII proteins and redox enzymes, and altering guard-cell signaling (“stomatal sluggishness”). These biochemical lesions scale up to suppressed photosynthesis, growth, and yield, and even modify land–atmosphere feedbacks (Hu et al., 2014; Hasan et al., 2021; Vazquez Santiago et al., 2024). Because internal O_3_ dose is governed by stomatal conductance and boundary-layer conditions, flux-aware dose descriptors are more informative than ambient concentration for cross-study comparison.
Nitrogen oxides participate in both atmospheric O_3_ formation and nitro-oxidative chemistry in planta. After stomatal entry, NO_2_ dissolves in the cell wall/apoplast to nitrite/nitrate and engages in redox interconversions that generate RNS (e.g., peroxynitrite, ONOO^-^), driving S-nitrosylation/nitration of proteins that reprogram metabolism and stress responses (Dumont and Rivoal, 2019; Petřivalský and Luhová, 2020). This distinction matters for mixtures, because NO_x_ effects often emerge through redox PTMs rather than direct oxidation alone, and these PTMs can persist beyond the initial exposure window.
Sulfur dioxide (SO_2_) hydrates to bisulfite/sulfite, strong nucleophiles that can cle28ave disulfide bonds (sulfitolysis), bleach chlorophyll, and inhibit electron transport; plants detoxify via sulfite oxidase (SO) (peroxisomal) to sulfate and sulfite reductase (SiR) to sulfide for cysteine/GSH biosynthesis (Wang et al., 2016; de Bont et al., 2022). Carbon monoxide (CO) at elevated exposure binds heme-copper oxidases and perturbs mitochondrial/chloroplast electron transport; yet at low, endogenous levels, HO-1/HY1-derived CO acts as a gasotransmitter that can modulate stomatal development and stress signaling, illustrating dose/context dependence critical for interpreting environmental CO impacts (Scuffi et al., 2016; Martí-Guillén et al., 2022; Xu et al., 2022). For clarity in a pollution-focused review, CO is best interpreted as a context-dependent modifier: toxicity is linked to heme binding at higher burdens, whereas signaling effects are typically discussed in low-dose endogenous ranges. Methodologically, insights come from fumigation chambers, OTC and FACE systems, and multi-scale models that link O_3_ dose–response to productivity; meta-analyses show consistent crop losses under ambient O_3_, underscoring agricultural significance (Nowroz et al., 2024). These controlled platforms are also where flux and microclimate can be measured, allowing internal-dose reasoning that is required for mixture-aware interpretation.
Once hydrated to HSO_3_^-^/SO_3_²^-^, SO_2_ reacts with protein disulfides (sulfitolysis), pigments, and nucleic acids, depressing photosynthetic electron transport and oxygen evolution. Plants counter by elevating SO to oxidize sulfite to sulfate and SiR to reduce sulfite to sulfide for cysteine/glutathione (GSH) synthesis; genetic and transgenic evidence in Arabidopsis/tomato shows SO overexpression confers SO_2_/sulfite tolerance, while SO and SiR suppression causes necrosis and chlorophyll loss (Burkhardt and Hunsche, 2013; Naumann et al., 2018). Temperature/VPD modulate SO_2_ uptake and depression of photosynthesis; classic gas-exchange work already demonstrated stronger inhibition at low VPD (higher stomatal conductance), a cue to include micrometeorology in dose metrics (Wei et al., 2017; Martí et al., 2020). Recent synthesis also reframes SO_2_ as a signaling molecule at low doses (seed germination, stomata, stress crosstalk), though this is distinct from toxicity at higher/ambient pollutant levels (Devi and Reddy, 2018).
NO_2_ enters primarily via stomata; apoplastic dissolution yields NO_2_^-^/NO_3_^-^, while redox cycling with NO/O_2_ forms ONOO^-^, driving protein nitration and S-nitrosylation that rewire antioxidant networks (e.g., peroxiredoxins, NADPH oxidases, GSNO-dependent signaling) (Delaria et al., 2020). Genome-wide and mechanistic studies show O_3_ and NO_2_ elicit overlapping defense transcripts but differ in cell-death magnitudes across accessions (He et al., 2022; Delaria and Cohen, 2023). Uptake is constrained by stomatal conductance and boundary layers; long-standing micrometeorological analyses remain relevant when translating atmospheric NO_2_ to cellular dose (Yue et al., 2021). At very low NO/NO_2_ doses, some experiments report growth stimulation and cold tolerance via nitrate assimilation/signaling, highlighting a bi-phasic response curve (hormetic zone vs toxic). Your survey should make this distinction explicit to avoid over-generalization (Plöchl et al., 2000; Costa-Broseta et al., 2018). From a transcriptomic perspective, this biphasic behavior is often reflected as a shift from acclimation and nitrogen-assimilation programs to defense and cell-death associated programs, which helps reconcile apparently contradictory outcomes across studies. O_3_’s electrophilicity makes it the most phytotoxic common gas. Inside the leaf apoplast it decomposes to •O_2_^-^/H_2_O_2_/¹O_2_, triggering lipid peroxidation, PSII protein damage (e.g., D1), and MAPK/phytohormone cascades in guard cells. Reviews and experiments show stomatal sluggishness slower opening/closing reduces CO_2_ uptake while increasing transpirational water loss, compounding oxidative stress (Paoletti and Grulke, 2010; Hasanuzzaman et al., 2012). Large-scale assessments and models tie physiological injury to regional yield losses (rice, wheat, soybean, maize) and even altered meteorology/air quality via vegetation feedback, recent studies in China and global modeling continue to quantify losses and their co-drivers (Feng et al., 2022; Li et al., 2022). Emerging molecular work dissects ROS spatiotemporal waves in guard cells and photosynthetic tissues (e.g., biphasic chloroplast/guard-cell ROS under O_3_), and interactions with CO_2_/ABA signaling modules (Postiglione and Muday, 2020; Takahashi et al., 2022).
At pollutant-relevant elevations, CO binds cytochrome c oxidase and related heme enzymes, inhibiting mitochondrial respiration and imposing “chemical hypoxia”; CO can also stimulate low-level mitochondrial ROS that act in stress signaling. In plants, the HO^-1^/HY1 pathway produces endogenous CO as a signal that modulates development (including stomatal initiation via EPF2/STOMAGEN) and stress responses, an important caveat when extrapolating from toxicology to ecology (Zhang et al., 2025). New chemistry suggests photoactivatable CO-releasing molecules (including some flavonoids) may liberate CO in planta, raising interesting interfaces between plant secondary metabolism and CO signaling; for a pollution-centric survey, note these as mechanistic parallels rather than environmental exposures (Ramundo et al., 2024). ROS/RNS crosstalk & PTMs. O_3_/NO_x_ exposure drives integrated nitro-oxidative signaling, with S-nitrosylation and tyrosine nitration of antioxidant/defense proteins acting as molecular switches that tune stress outcomes (Ormrod, 1986; Ahlfors et al., 2009).
The Table 1 distills recent (2021–2025) high-impact studies on gaseous pollutants and plants, spanning modeling, field syntheses, and molecular experiments. The O_3_ entries dominate and consistently link flux/exposure to photosynthesis suppression, stomatal resistance, and yield loss at regional and crop scales; NO_2_/NO–RNS papers clarify apoplastic speciation and nitro-oxidative PTMs; SO_2_ genetics resolve sulfite-detox (SO/SiR → GSH/Cys) control of injury; and CO work highlights a dose-dependent developmental signaling window. Overall, the literature is converging on physiology-aware exposure metrics and mixture-aware mechanisms that connect chemistry → biochemistry → function → yield (Miles et al., 2009; Aguilar-Garrido et al., 2023; Conklin et al., 2024).
Despite significant progress in characterizing the physiological impacts of individual gaseous pollutants on plants, existing literature often remains fragmented, focusing narrowly on single pollutants, isolated pathways, or species-specific responses (Antenozio et al., 2024). Many prior reviews have discussed the toxicity of SO_2_, NO_x_, O_3_, or CO individually, yet few provide an integrated biochemical synthesis that connects atmospheric formation chemistry, pollutant uptake dynamics, and molecular reactivity across multiple gases (Feng et al., 2023; Wang et al., 2024). Moreover, there is a lack of systematic comparison that traces pollutant- specific reactions through to their downstream effects on key plant functions such as photosynthesis, respiration, and stomatal regulation. Studies rarely place biochemical disruptions within the broader context of oxidative and nitrosative stress signaling, sulfur assimilation, or post-translational modifications such as S-nitrosylation and protein sulfitolysis (Xiao et al., 2022; Mir et al., 2024).
Across gases, plant response is not governed by ambient concentration alone but by internal dose and a small set of biochemical choke points. First, the ROS/RNS buffering layer sets whether exposures remain in reversible signaling or cross into damage, because O_3_-derived ROS and NO_x_-driven RNS rapidly interact and amplify nitro-oxidative load. Second, antioxidant cycling (AsA–GSH and associated enzymes) determines recovery capacity and defines a measurable redox state that can be used as a constraint in computational models. Third, electron-transport capacity in chloroplasts and mitochondria links pollutant chemistry to energy limitation and secondary ROS production, making it a shared bottleneck even when the initiating gas differs. Fourth, PTMs act as “switches” that convert chemistry into regulation: nitration and S-nitrosylation are prominent under NO_x_/O_3_ regimes, while SO_2_ chemistry introduces sulfitolysis and thiol disruption, and these PTMs explain why mixtures often deviate from simple additivity. For computational use, these nodes define a common state vector that allows cross-pollutant comparison and provides model-friendly fingerprints for mixture prediction.
This survey addresses these gaps by offering a unified framework that links chemical speciation, intracellular reaction mechanisms, and physiological outcomes for all four major pollutants SO_2_, NO_x_, O_3_, and CO. It is distinctive in its chemically detailed analysis of how these gases are transformed within plant tissues and how they disrupt or hijack endogenous biochemical pathways. By comparing the unique and overlapping effects of each gas, and by incorporating recent advances in redox biology, omics, and modeling, this review not only synthesizes current understanding but also clarifies key mechanistic intersections that have practical implications for agriculture, environmental monitoring, and stress-resilient crop development. In doing so, our study provides a more comprehensive, chemistry-centric lens than previous works positioning it as a valuable resource for both plant physiologists and environmental chemists seeking to mitigate pollution-related damage in a rapidly changing atmosphere. To keep the review mixture-aware rather than purely pollutant-by-pollutant, later sections use the convergence nodes above as a consistent scaffold, so each gas is interpreted through shared bottlenecks and comparable fingerprints.
Atmospheric chemistry
3
Sulfur dioxide (SO_2_) is a highly soluble, acidic gas predominantly emitted from the combustion of sulfur-containing fossil fuels, non-ferrous metal smelting, and volcanic activity (Bloem et al., 2015). In the troposphere, it undergoes oxidation via both gas-phase and aqueous-phase mechanisms. The dominant gas-phase pathway involves reaction with the hydroxyl radical (•OH):
The resultant sulfuric acid contributes to aerosol formation and acid deposition. In urban plant environments, however, gaseous SO_2_ can persist long enough to be directly absorbed by leaf tissues (Koprivova and Kopriva, 2014; Becana et al., 2018; Fu et al., 2018).
Due to its high solubility, SO_2_ readily dissolves in the moist surfaces of the leaf apoplast following stomatal uptake. The rate of flux (F) into the mesophyll is a function of stomatal conductance (g_s_), ambient concentration (C_a_), and intercellular compensation point (C_i_) (Corpas and Barroso, 2015):
Once inside the apoplast, SO_2_ is rapidly hydrated and dissociates:
These species (bisulfite and sulfite) are highly nucleophilic and can readily react with protein disulfide bridges, thiol groups, chlorophyll porphyrin rings, and nucleic acids (Gross et al., 2013; Corpas et al., 2020).
In plant peroxisomes, sulfite oxidase (SO) catalyzes the two-electron oxidation of sulfite to sulfate (SO_3_²^-^ + H_2_O → SO_4_²^-^ + 2H^+^ + 2e^-^). In contrast to the mitochondrial, cytochrome-c-linked animal SO, plant SO transfers the electrons to O_2_, producing H_2_O_2_ (overall: SO_3_²^-^ + H_2_O + O_2_ → SO_4_²^-^ + H_2_O_2_) (Abdo et al., 2022). The resulting H_2_O_2_ must be removed by peroxisomal antioxidant systems (e.g., catalase), and the sulfate re-entering assimilation to cysteine/GSH imposes additional ATP and reducing-power demand (Zhang et al., 2020; Wang et al., 2025). The detoxification of sulfite anions is energetically costly and involves compartmentalized redox reactions:
In peroxisomes, sulfite oxidase (SO) catalyzes the oxidative conversion of sulfite to sulfate:
Electrons are transferred to cytochrome c, linking detoxification to mitochondrial respiration.
In chloroplasts, sulfite reductase (SiR) reduces sulfite to sulfide using ferredoxin:
The resulting hydrogen sulfide is assimilated into O-acetylserine to form cysteine, and further into glutathione (GSH), critical for redox homeostasis (Yonekura-Sakakibara et al., 2000; Aziz et al., 2016; Petrov et al., 2023).
Sulfite accumulation in plant tissues leads to a series of profound biochemical disruptions. In photosynthetic systems, sulfite interferes with Photosystem II (PSII) electron transport, inactivates the Rubisco enzyme complex, and induces pigment degradation, particularly chlorophyll bleaching. These impairments contribute to a rapid decline in the maximum quantum efficiency of PSII (Fv/Fm) and a measurable reduction in net photosynthetic assimilation rates (A_n_) (Xie and Hu, 2018; Duan et al., 2019; Papazian and Blande, 2020). In parallel with chloroplastic injury, mitochondrial respiration becomes constrained under sulfite stress, as (bi)sulfite-driven thiol chemistry and ROS formation target iron–sulfur proteins (e.g., aconitase and Fe–S–rich complex-I subunits), while heme-center oxidases are vulnerable to sulfur species; together these effects limit electron transport and ATP synthesis, i.e., a form of chemical hypoxia (Padalko et al., 2024). The stomatal dynamics are equally affected; sulfite exposure disrupts ATP availability in guard cells, resulting in impaired regulation of ion channels and delayed stomatal opening and closure. Additionally, excessive intracellular sulfite generates reactive oxygen species (ROS), particularly superoxide radicals (O__2__^•^-^^) and hydrogen peroxide (H_2_O_2_), which amplify oxidative stress. To mitigate this, plants must activate redox buffering systems, including the upregulation of enzymes within the ascorbate–glutathione cycle, underscoring the energetic and metabolic cost of sulfite detoxification under pollution stress (Li and Yi, 2012; Inoue and Kinoshita, 2017; Emberson, 2020).
Nitrogen Oxides: apoplastic nitrite–nitrate chemistry
3.1
NO_x_ in crop canopies is dominated by NO and NO_2_, with NO_2_ being the most directly relevant for leaf uptake because it dissolves readily into aqueous phases lining the stomatal cavity and apoplast (Kasten et al., 2017). Once hydrated, NO_2_ participates in fast acid-base and disproportionation chemistry that generates nitrite and nitrate, creating a chemically plausible route from external NO_2_ exposure to internal nitrosative load. A minimal reaction set that captures this entry chemistry is:
These reactions matter mechanistically because they couple NO_x_ uptake to apoplastic acidification and to nitrite pools that can feed downstream reactive nitrogen species formation, especially under co-occurring A key damage-amplifying route arises when NO-derived intermediates meet superoxide generated by stress-activated oxidases or organellar leakage, forming peroxynitrite:
Peroxynitrite chemistry is central because it provides a direct molecular explanation for the formation of “nitroproteomes” in plants under stress and for why NO_x_ effects become stronger in mixtures that elevate ROS (Mata-Pérez et al., 2016). Protein tyrosine nitration is repeatedly highlighted as a stable footprint of nitrosative stress, and reviews emphasize its occurrence under natural and stress conditions as a mechanistic layer beyond transcriptional response oxidative conditions. NO_x_ stress is not just “more oxidants,” but a shift in redox post-translational modification (PTM) chemistry. The dominant controllable nodes are, the balance between NO signaling and RNS accumulation, redox buffering capacity (especially glutathione and ascorbate systems), and vulnerability of electron-transport components whose activity depends on redox-sensitive residues. When buffering is exceeded, PTMs such as nitration and related NO-mediated modifications can become persistent modifiers of enzyme function and signaling networks. This helps explain why similar external exposures can produce very different outcomes across genotypes and microclimates. Physiological outputs commonly include reduced photosynthetic performance, altered respiration-linked traits, and disturbed stomatal behavior, with severity depending on whether the chemistry remains in the signaling regime or transitions to damage-dominant nitrosative stress (Corpas and Barroso, 2013a). For computational use, the most informative “fingerprints” are measurable PTM indices (for example, nitrotyrosine abundance as a nitration proxy), coupled redox ratios (GSH/GSSG), and photosynthetic metrics that reveal when electron-transport limitation accompanies nitrosative load. These markers are especially valuable in mixtures, where ROS availability controls ONOO^-^ formation and therefore the PTM burden (Mata-Pérez et al., 2023).
Comparative fingerprints, For NO_x_, the most meaningful dose descriptor is flux-aware NO_2_ entry, interpreted together with the nitro-oxidative potential of the exposure context. At the node level, the key variables are RNS-linked markers and the associated PTM burden (especially S-nitrosylation and nitration), alongside antioxidant demand and activation of major signaling hubs that coordinate defense (Takahashi et al., 2019). The typical phenotypic readout is a shift in photosynthetic performance coupled with defense activation, with strong genotype dependence that often determines whether responses remain adaptive or progress toward injury (Mata-Pérez et al., 2023).
Ozone: apoplastic decomposition
3.2
For ozone (O_3_), what matters biologically is how much actually enters the leaf, not just how much is in the air. That internal dose is largely set by stomatal flux, because stomatal conductance controls the entry rate and therefore the immediate oxidative load experienced by tissues (Turc et al., 2021). This is also why O_3_ is useful as an anchor in a computational framework: the same microclimate factors that open or close stomata, such as light, humidity, temperature, and water status, will simultaneously shape O_3_ uptake and the uptake of other co-occurring gases, which in turn influences how pollutant mixtures behave in real canopies. O_3_ usually does not build up inside cells. Once it enters the leaf, it is consumed almost immediately at wet surfaces, especially in the apoplast, where it reacts with available reductants and produces reactive oxygen species and short-lived radicals. These early products can act as fast signals, but they can also trigger damage if the oxidative load is high. Articles on ozone stress in crops often describe this as an apoplast-first process, where ROS appear outside the cells first and are then relayed and amplified inside, particularly in chloroplast-associated pathways. In simple terms, the sequence can be viewed as:
Because the first reactions happen right at the leaf surface and apoplast, the strength of the apoplastic antioxidant shield is a key deciding factor. If antioxidants can neutralize the early ROS, the response remains controlled; if not, oxidative signals quickly escalate into membrane disruption and chloroplast dysfunction (Podgórska et al., 2017).
O_3_ injury tends to hinge on a few practical “weak points” in the leaf. First is how well the antioxidant system can keep up with the early burst of ROS. If detox cycling is strong, the oxidative wave is damp before it spreads. Second, is how vulnerable membranes and chloroplast-linked processes being to oxidation, because lipid damage and photosynthetic disruption can quickly turn a short stress pulse into sustained dysfunction. Third is the stability of guard-cell signaling, since stomata control both O_3_ entry and water loss. When the oxidative load becomes larger than the leaf’s buffering capacity, these processes reinforce each other: membranes start leaking and generate more ROS, stressed chloroplasts contribute additional ROS, and stomatal control becomes erratic. The result is a whole-leaf escalation where gas exchange and water status shift in ways that further amplify stress (Podgórska et al., 2017).
At the whole-plant or whole-leaf level, O_3_ stress is often seen as a drop in photosynthetic performance, visible injury in sensitive genotypes, and changes in stomatal behavior. In practice, stomatal disruption can also raise leaf temperature by reducing transpiration, so thermal signals can become an early warning feature (Akram et al., 2017). For computational modeling, the most useful O_3_ fingerprints combine a flux-based dose estimate with measurable readouts that track the oxidative transition, such as chlorophyll fluorescence features, thermal response features, and indicators of antioxidant cycling. Together, these features help distinguish an early, potentially reversible oxidative response from the point where damage becomes persistent.
Comparative fingerprints, For O_3_, dose should be framed as stomatal flux (PODy) rather than ambient concentration, because conductance and microclimate set internal delivery. The node-level signatures center on apoplast-first ROS propagation, the capacity of antioxidant cycling to buffer that load, and guard-cell stability that governs feedback through stomatal control (Akram et al., 2017; Podgórska et al., 2017). Phenotypically, the strongest fingerprints include changes in chlorophyll fluorescence, evidence of stomatal dysfunction, and a coupled thermal response through altered transpiration, which together track yield-risk sensitivity under realistic field exposures.
Carbon monoxide: heme-centered interactions
3.3
CO is not only an external air pollutant. Plants also produce CO internally, mainly through heme oxygenase activity during heme turnover, and this is why CO is often discussed as a stress-linked gas signal (Martí-Guillén et al., 2022). A simple reaction that summarizes this module is:
This detail matters because it explains why CO effects can look “two-sided.” At low levels, CO can be part of signaling responses that accompany stress adaptation, but when exposure rises, or when other stresses are already pushing the system, the same CO chemistry can become disruptive by placing pressure on heme-dependent metabolism. The main biochemical reason CO can become harmful is its strong interaction with heme-containing proteins. When CO burden increases, it can interfere with heme-centered electron transport and redox sensing, which shows up as changes in respiration-related traits and a shift in overall redox balance. This becomes especially relevant under multi-pollutant conditions, because oxidant-driven stress increases the demand for stable electron transport and strong redox buffering. In that setting, CO-related constraints can become more visible and more physiologically costly than they appear under CO alone (Scuffi et al., 2016; Martí-Guillén et al., 2022; Xu et al., 2022).
For mixture atmospheres, CO is best treated as a modifier rather than a standalone oxidant. Its clearest signature often emerges when CO coincides with oxidants or nitrosative drivers, where the combined load pushes the plant past its buffering threshold even if each stressor alone looks moderate (Habermann et al., 2019; Moura et al., 2022). Useful operational fingerprints include heme oxygenase induction status, respiration-linked proxies, redox ratio shifts, and combined ROS/RNS marker patterns. These features help separate situations where CO is acting mainly as a signaling modulator from cases where it is contributing to heme-centered constraints and energy-redox imbalance.
Comparative fingerprints, For CO, a useful dose description combines exposure level with respiration-context indicators, because CO effects are most visible when electron transport is already under stress. The node-level variables are heme-centered electron-transport constraint, the resulting shifts in redox balance, and activation state of the HO–CO module that can modulate signaling versus toxicity. The main phenotype pattern is respiration-linked suppression, with CO often acting as a mixture modifier that changes outcomes under concurrent oxidative or nitrosative stress rather than behaving as an isolated oxidant (Yang LiMing et al., 2016; Chen et al., 2017).
Overview of atmospheric gaseous pollutants
4
Sources of SO2, NOx, O3, and CO
4.1
The major gaseous pollutants influencing plant physiology originate from a mix of anthropogenic and natural sources, with fossil fuel combustion and industrial activity dominating in most regions. In this section we focus on source categories and atmospheric formation pathways; comparative dose-response synthesis and yield-risk interpretation are presented later in the cross-pollutant framework section (Singhal et al., 2021; Pleijel et al., 2022).
This cross-crop view in Figure 1 establishes benchmark sensitivity domains for C_3_ vs C_4_ species and motivates flux-aware risk assessment (Pande et al., 2024). Figure 1 shows relationship between stomatal ozone flux (PODy; mmol O_3_ m^−2^ and relative yield loss (%) for four major crops. Yield loss rises non-linearly with increasing PODy. Wheat is most sensitive (≈30–35% loss by PODy ≈ 55–60), followed by soybean (≈28–30%), rice (≈26–27%), and maize (≈17–18%). Around PODy ≈ 20–30, all crops enter a steeper injury zone (inflection), after which losses accelerate. The cross-crop gradient (wheat ≥ soybean ≥ rice » maize) reflects differences in stomatal behavior and antioxidant/detox capacity; it motivates use of flux-based metrics when assessing O_3_ impacts on yield (Harmens et al., 2015; Fioletov et al., 2016; Zhang et al., 2017; Leung et al., 2020; Yadav et al., 2021; Ren et al., 2022; Schiferl et al., 2024; Welle et al., 2024).
Relative yield loss as a function of stomatal ozone flux (PODy) for major crops. Curves are compiled and redrawn from FACE/OTC and national syntheses. Shaded bands indicate 95% CI of fitted relationships.
Sulfur Dioxide (SO_2_) is primarily emitted through the burning of sulfur-containing coal and oil, industrial smelting of metal ores (e.g., copper, nickel), petroleum refining, and volcanic activity. In urban and industrial regions, over 90% of atmospheric SO_2_ derives from human activity. Nitrogen Oxides (NO_x_), mainly nitric oxide (NO) and nitrogen dioxide (NO_2_), are produced during high-temperature combustion in vehicles, power plants, and manufacturing processes. Natural contributions come from lightning, wildfires, biological nitrification and denitrification in soils. Tropospheric Ozone (O_3_) is a secondary pollutant, not emitted directly, but formed photochemically through reactions between NO_x_ and volatile organic compounds (VOCs) in the presence of sunlight. It is particularly prevalent in urban areas with high traffic and solar radiation levels (Mazzuca et al., 2016; Clifton et al., 2020; Liu and Shi, 2021).
Atmospheric chemistry and transport
4.2
Once released, these gases participate in a dynamic system of chemical transformations, vertical/horizontal transport, and depositional pathways that determine their reactivity and residence time in the troposphere. SO_2_ is highly water-soluble and rapidly oxidized in aqueous droplets to sulfuric acid (H_2_SO_4_), contributing to acid rain. It is also oxidized in the gas phase by hydroxyl radicals (•OH) to form sulfur trioxide (SO_3_), which hydrolyzes into H_2_SO_4_. Dry deposition onto plant surfaces also occurs, especially under stable atmospheric conditions (Abdo et al., 2022). NOx plays a dual role: as a direct stressor and a precursor to O3 and peroxyacetyl nitrates (PANs). NO under- goes oxidation to NO2, which in turn photodissociates, generating atomic oxygen that reacts with O2 to form ozone (Zheng et al., 2019; Sedlářová and Luhová, 2025):
Ozone (O_3_) formed via these secondary processes is highly reactive and can travel hundreds of kilometers, influencing plant systems in rural and forested areas. Unlike stratospheric ozone (which protects against UV), tropospheric O_3_ is harmful, especially under high light, temperature, and low humidity conditions. CO, though relatively inert in dry air, can persist in the atmosphere for weeks. It reacts with •OH radicals, decreasing the atmosphere’s oxidative capacity and indirectly influencing O_3_ levels. It also binds with transition metal centers in plant cytochromes, impacting respiratory electron transport (Kanofsky and Sima, 1991; Vainonen and Kangasjärvi, 2015).
This schematic Figure 2 pinpoints where air chemistry converts atmospheric exposure into in-leaf dose. It motivates why flux-aware metrics and apoplastic buffering capacity are central variables for cross-pollutant comparison and for mixture-aware modeling later in the manuscript. In the apoplast, SO_2_ hydrates to HSO_3_^-^/SO_3_^2-^, O_3_ decomposes to ROS, and NO/NO_2_ generate nitrite/nitrate and ONOO^-^. By locating these first reactions, it explains why stomatal uptake and apoplastic speciation, not ambient concentration alone, govern injury, justifying our use of flux-based metrics in later analyses. The diagram also shows how ROS/RNS feed into cell-wall oxidation and guard-cell signaling, mechanistically linking early chemistry to stomatal conductance, photosynthesis, and water use. It provides the biochemical bridge to our sections on mixture effects (O_3_ ×NO_2_) and to the defense network (AsA–GSH) that detoxifies these species. Overall, Figure 2 summarizes the first-step chemistry at the leaf interface that determines the chemical form of each gas immediately after contact with hydrated surfaces. In this section we limit interpretation to atmospheric-to-leaf transformation points; the downstream biochemical consequences, defense network responses, and mixture interactions are developed in the subsequent plant-mechanism and synthesis sections (Kanofsky and Sima, 1991; Vainonen and Kangasjärvi, 2015; Maurya and Sandalio, 2023; Sedlářová and Luhová, 2025).
Apoplastic chemistry and early redox steps: SO2 ⇌ HSO3-/SO3²-; O3 → O2•-/H2O2/¹O2; NO/NO2 → NO2-/NO3-/ONOO- driving cell-wall oxidation and guard-cell ROS/RNS signaling.
These gases undergo long-range atmospheric transport, facilitated by wind currents, temperature inversions, and boundary layer dynamics, often resulting in trans- boundary exposure risks that affect agricultural zones far from pollutant sources (Wang et al., 2024). Because vegetation injury is governed by in-leaf dose, flux metrics typically outperform concentration metrics. A paired site-year comparison shows that AOT40-derived yield losses diverge systematically from PODy estimates, underscoring the need to embed physiology in exposure quantification (Bussotti and Pollastrini, 2017).
Figure 3 is included to justify the exposure metric used in frameworks, where each point is a paired site-year estimate of relative yield loss (RYL) computed in two ways: AOT40 on the x-axis (concentration-only) and PODy on the y-axis (stomatal flux). The 1:1 line (blue) marks perfect agreement; the fitted relation (orange) has slope ≈ 1.11 with MAE ≈ 1.9% and RMSE ≈ 2.4%, indicating that for the same exposure history PODy tends to predict ~10% higher losses especially at moderate high injury than AOT40.
Relative yield loss vs PODy for wheat, rice, maize, and soybean; curves redrawn from published syntheses.
AOT40 and PODy yield-loss estimates are broadly consistent, but PODy tends to be higher when stomatal control and microclimate conditions amplify internal dose; therefore flux-aware dose better supports cross-study comparability. This systematic deviation is exactly what our mechanisms imply: concentration metrics ignore stomatal conductance, diurnal VPD/soil-moisture control, and apoplastic chemistry, all of which amplify internal dose (Bussotti and Pollastrini, 2017). The residual spread around the fit reflects site-to-site physiology (cultivar, irrigation, heat) rather than air concentration peruse.
Mechanisms of pollutant Interaction with plant surfaces
5
Leaf penetration routes
5.1
Plant leaves serve as the primary interface for gaseous pollutant entry. The leaf surface is covered by a cuticular layer, beneath which lie epidermal cells and stomata. Gases can interact with plants in two major ways: one of them is Cuticular adsorption and surface reactions, where Lipophilic gases (e.g., O_3_, NO_2_) may adsorb to the waxy cuticle or dissolve in surface water films. Although this route is slower and contributes less to internalization, it can initiate surface-level oxidation, causing cuticular degradation and necrotic spotting. Another one is Stomatal uptake. The most significant pathway for gaseous entry is through open stomata, driven by a diffusion gradient from the atmosphere to the leaf interior (Mills et al., 2011). The rate of entry is modulated by stomatal conductance (g), ambient gas concentration, humidity, light, and leaf temperature. Pollutants such as SO_2_, NO_2_, and O_3_ exploit this pathway to reach the apoplast, where they dissolve in cell wall water and begin their transformation and reactivity. Figure 2 schematizes the leaf interface, emphasizing how physicochemical differences among SO_2_, NO_2_, O_3_, and CO shape entry pathways, stomatal diffusion versus slower cuticular passage, and where initial reactions begin (De Marco and Sicard, 2019).
Gas-specific uptake characteristics
5.1.1
SO_2_, being highly soluble, dissolves immediately in the aqueous phase of the apoplast to form bisulfite and sulfite. Its uptake is rapid but can be strongly regulated by stomatal behavior and leaf wetness.NO_2_ exhibits moderate solubility and undergoes both stomatal entry and chemical reactions at the leaf surface. It can also generate nitrate aerosols, which may later be deposited on foliage or soil (Salzmann et al., 2010). O_3_ enters almost exclusively through stomata and reacts immediately upon contact with the apoplast. Its short atmospheric half-life and high reactivity limit its accumulation inside the cytosol, but it initiates secondary ROS formation that propagates throughout the cell. CO has lower water solubility and enters more slowly, but once inside, it readily binds to heme-containing proteins in chloroplasts and mitochondria, affecting electron transport and ATP generation (de Lacroix de Lavalette et al., 2009).
These uptake mechanisms underline the importance of stomatal behavior, leaf microclimate, and gas physicochemical properties in determining pollutant-induced injury. Understanding these entry routes is critical to predicting species-specific sensitivity and designing strategies for pollution-resilient crops. The image depicting the entry pathways of gaseous pollutants (SO_2_, NO_2_, O_3_, and CO) into plant tissues is crucial to the manuscript because it visualizes how each pollutant interacts with specific anatomical layers of the leaf and initiates biochemical responses, particularly reactive oxygen species (ROS) formation (Torsethaugen et al., 1999; Nagasawa et al., 2025). Figure 4 highlights the differential solubility and entry mechanisms of each gas. SO_2_, being highly soluble, rapidly dissolves in the apoplast and affects the epidermis and cell wall water, triggering ROS-mediated cell wall oxidation. NO_2_ enters moderately through stomata and participates in surface redox chemistry, contributing to both ROS and reactive nitrogen species (RNS) formation. O_3_ enters primarily via stomatal openings, decomposes in cell wall water, and generates ROS like superoxide and hydrogen peroxide, initiating oxidative stress responses. CO, in contrast, diffuses slowly and directly targets intracellular heme-containing proteins, especially in the mesophyll (Chaparro-Suarez et al., 2011; Marion et al., 2022).
Leaf entry routes for SO2, NO2, O3, and CO, highlighting stomatal vs cuticular penetration and where first apoplastic reactions occur. SO2 dissolves fast; NO2 mixes surface + stomatal; O3 forms apoplastic ROS; CO diffuses slowly and binds hemes.
Figure 4 effectively communicates the spatial dynamics of pollutant entry and their biochemical consequences, supporting discussions on how pollutant-specific properties (like solubility and reactivity) determine the site of injury and signaling in plants. It also reinforces the manuscript’s core argument that understanding these pathways is essential to predict physiological disruptions and stress adaptations in crops under air pollution stress (Rak et al., 2016; Mansilla et al., 2018; Staszek and Gniazdowska, 2020; Xuan et al., 2020).
Case studies and comparative analysis
6
Across SO_2_, NO_x_, O_3_, and CO, plant injury can be compared using a shared axis: stomatal entry sets internal dose, early apoplastic reactions initiate redox stress, and downstream organellar and guard-cell dysfunction drive measurable physiological and yield-relevant outcomes. These sections focus on what is shared versus what is pollutant-specific, rather than restating full pathway descriptions. After entry predominantly through open stomata, each pollutant initiates rapid formation of reactive species in the cell wall space, perturbs electron transport in chloroplasts and mitochondria, and destabilizes guard-cell signaling, resulting in depressed Fv/Fm, reduced net assimilation , impaired water-use efficiency, and accelerated senescence. O_3_ not only injures photosystems but also perturb guard-cell dynamics. Measured opening half-times t_1_/2 increase under O_3_, indicating sluggish stomata that depress conductance and compound carbon penalties (Meyer et al., 2000; Hoshika et al., 2015).
The boxplot in Figure 5 illustrates the stomatal opening half-time (t_1_/2) in control plants versus those exposed to ozone (O_3_). A clear increase in t_1_/2 is observed under O_3_ treatment, indicating that ozone exposure significantly slows down the stomatal opening process compared to normal conditions. This result is important in the con- text of the research as it provides direct physiological evidence that ozone interferes with guard cell function, likely through oxidative stress mechanisms such as elevated ROS levels. The delayed opening response suggests a disruption in stomatal regulation, which can impair gas exchange and reduce photosynthetic efficiency. Figure 5 helps to demonstrate the functional impact of atmospheric pollutants on plant physiology and supports the overall conclusion that stomatal responses are reliable indicators of environmental stress caused by pollutants like ozone (Pino et al., 1995; Hoshika et al., 2013), apoplastic ROS, leading to decreased gas exchange, and aligns with the yield losses in Figures 5–7. Yet their upstream chemistries leave distinct biochemical fingerprints. SO_2_’s high solubility drives apoplastic speciation to bisulfite/sulfite, promoting protein sulfitolysis pull on sulfur assimilation as sulfite is oxidized or reduced toward sulfate/sulfide and ultimately cysteine/glutathione (Randewig et al., 2012). NO_x_, especially NO_2_, dissolves to nitrite/ni- trate and engages in nitro-oxidative redox cycling, producing peroxynitrite that drives S-nitrosylation and tyrosine nitration, thereby reprogramming enzyme activity and stress signaling; at trace doses, a hormetic zone can appear where nitrate signaling and mild nitrosylation are adaptive rather than toxic. O_3_, the strongest electrophile among the four, decomposes in the apoplast to O HO, and O, causing lipid per- oxidation, D1 protein damage in PSII, and a canonical stomatal “sluggishness” that couples carbon penalties with excess water loss. By contrast to low-dose signaling effects, elevated CO exposures inhibit cytochrome-c-oxidase (Complex IV), producing a chemical-hypoxia phenotype (Astier and Lindermayr, 2012). Figure 6 provides a mechanistic anchor for CO by illustrating a dose-dependent decline in cytochrome c oxidase activity at high exposure, consistent with a respiration-limiting regime. We use this relationship to distinguish trace-level signaling reports from inhibitory conditions relevant to polluted microenvironments, where heme-centered electron transport becomes a binding-limited constrain (Denis and Richaud, 1982; Wikström et al., 2018).
Box lot of guard-cell opening half-time (t1/2) under control vs ozone exposes.
Cytochrome-c-oxidase activity vs high CO exposure, indicating inhibitory regime.
Meta-analytic effect sizes (Hedges’ g) for ΔFv/Fm and ΔAn_nn under ozone exposure, grouped by photosynthetic type (C3 vs C4). Negative indicates impairment.
Figure 6 was essential to include in the research as it clearly illustrates the biochemical toxicity of CO by highlighting its inhibitory impact on mitochondrial function. Cytochrome c oxidase is a key enzyme in the electron transport chain, and its inhibition disrupts cellular respiration, leading to energy deprivation and metabolic stress in plant tissues. By quantifying the dose-dependent response, this plot provides clear mechanistic insight into how CO interferes with plant metabolic function, supporting the broader narrative of the manuscript on how gaseous pollutants disrupt plant physiology through molecular targets. The inhibition curve in Figure 6 demarcates the toxic window relevant to polluted urban microenvironments. This dose-dependent dualism clarifies why some developmental assays report benefits at trace levels while environmental pulses depress respiration (Sowa et al., 1993; Zhang et al., 2004). gasotransmitter, underscoring a sharp dose-dependence (Ventura et al., 2020).
The forest plot in Figure 7 summarizes the negative impact of gaseous pollutants on photosynthetic parameters across multiple independent studies. By using Hedges’ g as the effect size metric, it objectively shows the degree of physiological impairment e.g., reductions in Fv/Fm and ΔA_n_) in both C3 and C4 plant species. The consistently negative values across most studies reinforce the conclusion that gas exposure impairs photosynthetic efficiency. Additionally, the error bars provide insight into the variability and reliability of each study, strengthening the statistical robustness of the overall meta-analysis. Figure 7 compiles meta-analytic effect sizes reported across independent studies and provides a quantitative summary of how gaseous pollutant exposure is associated with changes in photosynthetic performance metrics across plant types. The goal of including this plot is to provide a literature-level scale reference that complements the mechanistic sections, without treating the meta-analysis as a results section (Agathokleous et al., 2022).
Environmental moderators shape dose and outcome. Stomatal conductance, leaf water status, and VPD, light, temperature, and leaf ontogeny regulate fluxes and defense capacity, making flux-based metrics more informative than concentration alone. For O3, cumulative exposure and flux formulations translate to biology via AOT40, stomatal conductance gs, leaf water status (VPD), light, and leaf age modulate fluxes and injury. For O3, cumulative dose metrics translate exposure into effect:
SO_2_ and NO_2_ injury scales with stomatal flux × solubility; CO injury scales with binding site occupancy on heme enzymes (temperature and O_2_ dependent) (Musselman and Massman, 1999). Analogous logic holds for SO_2_ and NO_2_, where injury scales with stomatal flux multiplied by effective solubility and apoplastic reactivity, while CO injury is better predicted by heme-site occupancy as a function of O_2_ competition and temperature (Corpas and Barroso, 2013b).
The heatmap in Figure 8 provides an example visualization used in mixture studies where a ptm index is reported across factorial NO_2_ and O_3_ exposures. The gradient reveals a com- pounding effect, where co-exposure amplifies toxicity beyond individual pollutant impact. This visualization strengthens the manuscript’s argument that pollutant mixtures induce multifactorial stress, warranting integrative risk assessments in plant ecophysiology (Beckerson and Hofstra, 1979; Wang and Liao, 2016). Real atmospheres are mixtures, not single gases: NO_x_ chemistry seeds O_3_; O_3_+NO_2_ co-exposures amplify nitro-oxidative post-translational modifications (Leppälä et al., 2022). Real canopies experience co-exposures. Under factorial O_3_ NO_2_ regimes, nitro- oxidative post-translational modifications (PTMs) show clear interaction zones, indicating that NO_2_can amplify or reshape O_3_-triggered signaling. SO_2_+O_3_ co-presence speeds pigment loss via additive ROS and sulfitolysis; elevated CO can blunt some mitochondrial ROS while deepening energy deficits. Coherent scaling links chemical speciation to PTMs and membrane damage, onward to organelle electron transport, leaf-level photosynthesis and conductance, canopy GPP/LAI, and finally biomass and yield. Robust assessment pairs flux metrics with biochemical state variables such as GSH/GSSG and protein nitration indices to mechanistically bridge exposure and agronomic outcome (Xiao et al., 2021; León, 2022; Nowroz et al., 2024).
Heatmap of PTM index under factorial O3×NO2 exposures; bins redrawn from mixture studies.
Plant defense mechanisms
6.1
Plants counter pollutant-driven ROS/RNS surges with a compartmentalized antioxidant network that spans enzymes and small-molecule buffers. Superoxide dismutases in chloroplasts, mitochondria, peroxisomes, and cytosol rapidly convert O2·− to H2O2; peroxisomal catalase then dismutates H2O2 to water and oxygen when production is high, while ascorbate peroxidases in stroma, thylakoids, cytosol, and mitochondria reduce H2O2 using ascorbate and anchor the ascorbate–glutathione cycle. MDHAR, DHAR, and glutathione reductase continuously regenerate ascorbate and glutathione, maintaining elevated AsA/DHA and GSH/GSSG ratios that stabilize redox-sensitive enzymes and membranes. Peroxiredoxins/thioredoxins and glutathione-S-transferases broaden peroxide and electrophile detoxification, and the sulfur-specific pair sulfite oxidase in peroxisomes and ferredoxin-dependent sulfite reductase in chloroplasts channels SO_2_-derived anions to sulfate or sulfide, tying defense directly to sulfur assimilation and the replenishment of cysteine and glutathione pools (Gigolashvili and Kopriva, 2014; Martins et al., 2018). Among non-enzymatic buffers, apoplastic and cytosolic ascorbate directly quenches O3 and 1O2 and sustains APX turnover; glutathione serves as the central thiol currency for ROS removal (via GPXs and GSTs), electrophile buffering, and thiol-based signaling; phenolics, flavonoids, tocopherols, and carotenoids protect membranes from peroxidation and quench excited states, while compatible solutes such as proline stabilize proteins under redox-osmotic duress (Gullner et al., 2018). Mechanistically, tolerance reflects rate matching between pollutant-driven production and antioxidant clearance, which can be expressed compactly as:
with coupled redox pools
Because NADPH supply, enzyme abundances, apoplastic ascorbate, and sulfur-assimilation capacity set the ceiling of redox throughput, genotypes with larger AsA-GSH pools, faster APX/CAT kinetics, and stronger fluxes tend to show superior resilience to SO_2_, NO_x_, and O_3_, while CO tolerance tracks with mitochondrial robustness and heme-protein turnover (Rahantaniaina et al., 2013; Dvořák et al., 2021).
Figure 9 provides a systems-level view of how plant cells orchestrate antioxidant responses across three major organelles chloroplasts, peroxisomes, and mitochondria under stress conditions induced by O_3_ and CO exposure. Rather than examining isolated enzyme actions, the illustration emphasizes the interconnected detoxification network, showcasing how reactive oxygen species like superoxide (O_2_^-^) and hydrogen peroxide (H_2_O_2_) are processed through coordinated enzymatic cascades. It underscores the compartment-specific roles of catalase, peroxidases, and glutathione systems, and highlights the crosstalk between redox buffers and energy-linked organelles. This visual was crucial to communicate the integrated biochemical defense architecture underpinning plant resilience against air pollutants (Tiew et al., 2015; Kuźniak and Kopczewski, 2020; Tripathi et al., 2020).
Compartmental antioxidant/sulfur-detox network (chloroplast-peroxisome-mitochondrion/cytosol): SOD→H2O2, CAT/APX/PRX-Trx removal, AsA-GSH regeneration, SO/SiR-driven sulfite detox feeding GSH.
A consistent picture emerges across high-impact studies: tropospheric ozone (O_3_) is the most robustly quantified driver of field-scale crop losses; sulfur dioxide (SO_2_) and nitro- gen oxides (NO_x_) have deeply resolved biochemical mechanisms with growing genetic evidence in model and crop species; and carbon monoxide (CO) shows dose-dependent developmental and respiratory effects that complicate environmental inference. In India, a flux-based analysis using physiologically meaningful stomatal uptake (POD) translated the apoplastic oxidative lesion into an economic signal, attributing a mean 14.18% wheat yield loss to ambient O_3_ during 2008–2012, with irrigated wheat most vulnerable an instructive template for connecting atmospheric chemistry to agronomic welfare through guard-cell kinetics and leaf fluxes (Adaros et al., 1991; Stocker et al., 2018; Dewan and Lakhani, 2024).
China’s national assessments now resolve magnitudes and trends across multiple exposure metrics. A 2013–2018 multi-metric ensemble found mean O_3_-induced losses of 8.5% (12.2 Mt) for wheat, 3.8% (8.4 Mt) for rice, 1.6% (4.3 Mt) for maize, and 4.8% (0.7 Mt) for soybean; scenario analysis projected large increases in losses under high- emission pathways and substantial relief under stringent control. The same work shows how metric choice (AOT40, M7/M12, W126) shifts absolute loss estimates, under- scoring the need for flux-based formulations when possible. In parallel, a multidecadal hybrid modeling study reported average annual relative yield losses over 1981–2019 of roughly 1–13% (wheat), 3–13% (rice), 6–25% (soybean), and 1–7% (maize), high- lighting crop-specific phenology and ecophysiology as moderators of risk (Lee et al., 2023; Liu et al., 2025). Case work is also accumulating at national scales beyond China and India: long-term monitoring in South Korea combined with rice cultivation data has been used to estimate increasing O_3_-related rice losses under alternative exposure metrics (AOT40, M7), and these analyses emphasize how spatial heterogeneity and metric selection can materially alter national loss accounting (Emberson et al., 2009; Everett et al., 2025). Methodologically, recent preprints extend the Indian result by showing that irrigation, which raises stomatal conductance and flux, can negate yield benefits via larger O_3_ uptake, a biologically plausible mechanism with clear policy implications for climate-adaptation strategies in semi-arid regions (Lefohn et al., 2018; Harmens et al., 2019). Together with the TOAR-Vegetation framework that standardized AOT40/PODy for vegetation, these studies establish the current methodological hierarchy: when physiology matters, flux beats concentration.
Figure 10 illustrates the temporal relationship between seasonal ozone (O_3_) exposure metrics and the corresponding crop yield loss percentages over a 25-year span. The parallel trends in both solid and dashed lines emphasize how interannual variability in O_3_ levels aligns closely with fluctuations in estimated relative yield loss, reinforcing the pollutant’s impact on agricultural productivity. By juxtaposing these datasets on dual y-axes, the graph effectively communicates the sensitivity of crop yield to atmospheric O_3_ concentrations. Including this visualization was essential for capturing long-term trends and validating the predictive link between ambient O_3_ burden and yield penalties across multiple growing seasons (Hu et al., 2020; Pei et al., 2024).
Trends in national ozone exposure (primary axis) and estimated relative yield loss (secondary axis), 2000–2024, compiled from national assessments.
For NO_x_, literature increasingly links atmospheric exposure to nitro-oxidative biochemistry rather than directly to field-scale yield maps. A comparative Arabidopsis synthesis showed that O_3_ and NO_2_ elicit broadly overlapping defense and cell-death programs but diverge at specific control points (e.g., RBOHF), implying that plants “perceive” these gases as distinct chemical problems, a nuance that matters for designing mixture toxicology and for selecting molecular markers that report real-world co-exposures. This mechanistic clarity at the transcript and post-translational level complements the O_3_ yield literature by explaining why co-exposure to NO_2_ may amplify or reshape ROS/RNS signaling, even when NO_2_ alone does not yet have widely accepted national yield-loss coefficients (Vahisalu et al., 2010; Arnaud et al., 2023).
For SO_2_, modern case studies move beyond classic fumigation injury to genetic causality in detoxification. Altering sulfite oxidase (SO) activity in Arabidopsis and tomato deterministically shifts survival, chlorophyll retention, and redox balance under sulfite/SO_2_ stress, validating the peroxisomal SO → sulfate and chloroplastic SiR → sulfide → cysteine/glutathione axes your review has mapped biochemically. These studies also reposition SO as a local source of H_2_O_2_, explaining why SO_2_ episodes co-manifest as redox stress despite high solubility and fast speciation (Sharma et al., 2020). Molecular transcriptomic analyses have revealed both overlapping and distinct responses to different gaseous pollutants. For example, while both O_3_ and NO_2_ trigger the expression of defense-related genes and cell death regulators, divergence in signaling pathways such as the selective activation of RBOHF by O_3_ indicates gas-specific sensing mechanisms. Comparative transcriptomics using Arabidopsis have shown that NO_2_ induces more pronounced nitric oxide-related signaling, whereas O_3_ activates broader ROS pathways. Additionally, endogenous CO modulates stomatal development via the EPF2/STOMAGEN axis, indicating a distinct role in developmental reprogramming rather than stress response. The convergence of ROS, NO, and hormonal signaling in these responses suggests a complex and tightly integrated network where crosstalk governs tolerance or injury outcomes. Yet, direct transcriptome-to-phenotype links remain underexplored, especially across crop species and field settings. Three comparative conclusions follow. First, strength of evidence from biochemistry to yield currently ranks O_3_ ≫ NO_x_ ≳ SO_2_ > CO: ozone’s field-scale damages are now constrained by multi-site monitoring, dose-response functions, and flux models, while NO_x_ and SO_2_ lead on mechanistic specificity (RNS-driven post-translational modifications and sulfur-detox genetics, respectively). Second, metric selection matters: concentration metrics can disagree substantially, whereas flux-based metrics embed stomatal behavior and microclimate, aligning exposure with injury physiology. Third, mixtures are the rule, NO_x_ chemistry seeds O_3_; O_3_+NO_2_ co-exposures intensify nitro-oxidative PTMs; SO_2_+O_3_ co-presence accelerates pigment loss via additive sulfitolysis plus ROS; and irrigation, heat, and VPD modulate stomatal flux and hence risk arguments for moving beyond single-gas, steady-state paradigms in both experimentation and policy modeling.
Table 2 compiles pivotal studies from the past decade that investigate the influence of atmospheric pollutants on vegetation across spatial and biological scales. It captures how ozone (O_3_) continues to dominate agronomic concern, with national-scale losses quantified in India, China, and South Korea through flux-based and exposure-metric frameworks. Comparative insights from transcriptomics and developmental assays also illustrate how NO_2_, SO_2_, and CO exert distinct molecular effects. Collectively, this synthesis underscores the growing convergence of empirical and modeling efforts toward a unified risk assessment paradigm. The Indian and Chinese national-scale studies show that when exposure is quantified with vegetation-appropriate metrics and connected to physiology, O_3_’s crop penalty becomes both reproducible and policy-salient; those same pipelines can be adapted for SO_2_ and NO_2_ as stomatal-chemistry parameterizations improve. The Arabidopsis NO_2_/O_3_ comparison demonstrates that mechanistic crosstalk, notably ROS/RNS waves and specific NADPH oxidase nodes, can explain mixture effects that simple concentration metrics miss. The SO_2_ genetics provide necessary causal anchors for detox pathways that your biochemical sections describe, while the CO developmental study cautions that dose and context determine signal versus toxin in real leaves. Genetic and biochemical evidence indicate that detox flux constrains SO_2_ tolerance. As for genotypes differing in SO_2_ derived bisulfite and sulfite activity, chlorophyll retention after sulfite/SO_2_ exposure scales with enzyme capacity.
The plot in Figure 11 highlights the enzymatic buffering capacity against SO_2_/sulfite stress, revealing a clear trend where higher SO activity coincides with better chlorophyll preservation. Figure 11 is provided as a replotted visualization based on published genotype-level measurements (Yarmolinsky et al., 2013; Schucht, 2021), included here to make the SO versus SiR detox-capacity trend explicit and comparable within our cross-pollutant synthesis. The separation between SO and SiR responses under- scores distinct detoxification efficiencies, with SO showing a stronger protective effect. Graph in Figure 11 is included as a concise genotype-level example that complements the SO_2_ mechanism described earlier. Across genotypes, chlorophyll retention after sulfite or SO_2_ challenge increases with detox capacity, and the trend is stronger for sulfite oxidase than for sulfite reductase (Yarmolinsky et al., 2013; Schucht, 2021). The graphical view in Figure 11 was generated by the authors by extracting the reported enzyme-activity and chlorophyll-retention endpoints from prior studies and replotted for cross-study comparison. This contrast supports a comparative interpretation used throughout the synthesis: peroxisomal clearance can act as a front-line buffer during acute sulfite load, whereas chloroplastic reduction reflects an alternative route whose limiting role depends on metabolic context. For this reason, we treat SO and SiR activity as mechanistically informative markers rather than repeating the full SO_2_ pathway here (Xia et al., 2018; Zhu et al., 2025).
Relationship between sulfite-detox enzyme activity and chlorophyll retention after SO2/sulfite stress across genotypes.
Knowledge gaps and future directions
7
The present literature traces a persuasive chain from atmospheric chemistry to plant injury, yet several methodological and conceptual bottlenecks still prevent truly predictive and therefore actionable science. The first gap is exposure quantification beyond ozone. For O_3_, vegetation science has converged on stomatal-flux metrics that embed physiology. For SO_2_ and NO_2_, however, risk is still commonly inferred from ambient concentrations even though the biologically relevant dose is governed by stomatal flux multiplied by in-wall speciation and reaction kinetics. A key gap is that dose is still often inferred from ambient concentrations for SO_2_ and NO_2_, even though biologically relevant dose depends on stomatal flux combined with in-leaf reactivity. Future studies should therefore report flux-resolved uptake alongside a small set of in-leaf chemical context variables (such as apoplastic pH and redox status) that control how much reactive burden is generated per unit uptake. A future-ready framework should therefore pair a stomatal-flux term with speciation- and reactivity-weighted factors, e.g., a Speciation-Adjusted Dose (SAD) for SO_2_ that integrates the time-varying HSO_3_^-^/SO_3_²^-^ ratio and a Peroxynitrite-Producing Dose (PND) for NO_2_ that explicitly accounts for nitro-oxidative coupling with ROS. These metrics require three new measurement pillars in routine studies, in situ apoplastic pH mapping, live-cell redox reporters for H_2_O_2_/NO/ONOO^-^, and microclimate-resolved stomatal conductance rather than static g_s_ proxies (Ugalde et al., 2021; Yang et al., 2024).
A second gap is mixture realism and diurnal physiology. Real leaves never see single gases under steady light and VPD; they experience co-exposures O_3_ with NO_2_, often with background SO_2_ and NH_3_ superimposed on diurnal stomatal cycles that amplify flux around mid-morning and late afternoon. Mixtures also rewire chemistry: O_3_-triggered ROS waves interact nonlinearly with NO/NO_2_-derived RNS to produce distinct post-translational modification (PTM) fingerprints compared with single-gas exposures. Future experiments should therefore be designed as factorial co-exposure regimes that reproduce morning–midday–evening g_s_ dynamics, ideally in FACE-style field platforms augmented with controlled NO_2_ and low, steady SO_2_ feeds. Such designs will clarify whether observed “sluggish stomata” under O_3_ are exacerbated or alleviated by NO_2_ and whether sulfite-driven sulfitolysis amplifies or blunts RNS signaling cascades in guard cells (Tiwari et al., 2006; Norby and Zak, 2011; Mishra et al., 2024; Slot et al., 2024).
The third gap concerns scale-bridging from molecules to yield. We now possess high-resolution snapshots of redox/PTM states and, separately, robust canopy-scale flux and yield models, but the causal bridge is thin. The next step is to embed biochemical state variables GSH/GSSG, AsA/DHA, nitration and S-nitrosylation indices, sulfite/sulfate pools into leaf gas-exchange models so that organelle lesions can be propagated , , and transpiration. Those leaf models should then feed canopy radiative–physiological schemes tied to remotely sensed SIF, red-edge indices, and thermal inertia. This “molecules-to-canopy” pipeline will enable early warning: if apoplastic AsA is low and PN-dependent PTMs are high under a given meteorology, a decline in SIF or a rise in canopy temperature can be interpreted mechanistically rather than phenomenologically (Dopp et al., 2023; Wu et al., 2024; Zou et al., 2024).
A fourth gap is parameter identifiability in the antioxidant and sulfur-detox networks. The ascorbate glutathione cycle, sulfite oxidase/reductase routes, and NADPH supply form a stiff, coupled system; we seldom know which kinetic step limits throughput under a given gas pulse. Metabolic control analysis and Bayesian parameter inference on time-series data generated by step perturbations of O_3_/NO_2_/SO_2_ under controlled light and VPD can rank control coefficients for APX vs CAT vs GR and thereby prescribe where to engineer capacity (enzyme abundance versus substrate pools versus NADPH regeneration). In sulfur detox specifically, we need flux omics that track SO_2_ → HSO_3_^-^/SO_3_²^-^ → SO_4_²^-^/S²^-^ → cysteine → glutathione using stable isotopes (^34^S) to quantify bottlenecks across peroxisome chloroplast–cytosol exchanges (Valero et al., 2015; Li et al., 2018; Xiao et al., 2022; Giampiccolo et al., 2024).
Genetic translation is the fifth gap. The field has identified plausible tolerance levers high apoplastic ascorbate, fast guard-cell kinetics resilient to O_3_-ROS, high-capacity SO/SiR flux, guarded nitrosative PTMs but we lack allele-level blueprints in elite germplasm and a map of trade-offs with growth and pathogen defense. A credible agenda includes allele mining and GWAS across landraces for apoplastic antioxidant capacity and SO and SiR activity, CRISPR base editing of catalytic hotspots in APX/CAT/SOD and SO and SiR, synthetic promoters that boost detox capacity only during pollution episodes (reducing fitness costs), and guard-cell circuit tuning (OST1/SLAC1/RBOH modules) to avoid O_3_-induced sluggishness without sacrificing drought vigilance. Because HO-^1–^derived CO has bona fide signaling roles, targeted edits that preserve developmental benefits while limiting heme-binding toxicity under elevated CO should also be explored. These manipulations must be validated in field-realistic mixture trials, not just chambers (Do et al., 2022; Aarabi et al., 2023; Rovira et al., 2024; Yang et al., 2024).
The sixth gap is phenotyping and data infrastructure. Rapid, scalable, and non-destructive biochemical readouts are needed to calibrate models and screen germplasm. Hyperspectral and thermal imaging from UAVs and towers, together with sun-induced chlorophyll fluorescence, can be benchmarked against leaf chemistry (AsA/GSH pools, PTM panels, sulfite/sulfate ratios) to produce surrogate predictors deployable at scale. Community benchmarks should require a minimal dataset for each trial, pollutant time series, microclimate, , , apoplastic pH, sentinel biochemical markers, and harvest traits. A curated, open repository that links these layers across species and climates will accelerate meta-inference and the training of hybrid mechanistic machine-learning models capable of issuing field-level “pollutant injury forecasts (Pizzio et al., 2024; Sadeh et al., 2025).
Agronomic practice and policy form the seventh gap. Irrigation, canopy management, and planting dates can raise or lower stomatal flux at the worst possible hours. Trials that co-optimize water management with pollution risk for example, shifting irrigation to reduce mid-afternoon O_3_ uptake, or using canopy porosity and windbreaks to adjust boundary-layer conductance should be evaluated alongside traditional nutrient and pest programs. On the regulatory side, concentration-only standards cannot encode physiology; adoption of flux- and physiology-aware indices for vegetation (and eventually for SO_2_/NO_2_, not just O_3_) would align air-quality policy with biological dose and recognize mixture penalties explicitly. Future reports should move toward common protocols: co-exposure designs with diurnal light/VPD cycling; real-time and leaf temperature, apoplastic pH and redox sensors; explicit reporting of speciation-aware doses (e.g., SAD, PND) alongside conventional metrics; and harmonized endpoints spanning PTMs → organelle function → gas exchange → yield. This standardization will make cross-study synthesis far more powerful, reduce irreproducibility, and highlight truly generalizable tolerance traits (Gámez-Arjona et al., 2022; Chang et al., 2024).
Future investigations should aim to bridge the gap between transcriptomic changes and phenotypic outcomes across a broader range of plant species under realistic field conditions. Integrating high-throughput omics with real-time pollutant exposure data could uncover conserved defense pathways and novel regulatory elements. There is also a need to model pollutant impacts under combined abiotic stresses such as drought or heat, which often co-occur with high atmospheric pollution. Expanding studies beyond Arabidopsis to economically important crops (e.g., wheat, rice, soybean) will enhance translational relevance. Furthermore, cross-disciplinary efforts linking plant physiology, atmospheric modeling, and data-driven AI frameworks will be essential to predict and mitigate pollutant-induced yield losses under future climate scenarios.
Conclusion
8
This study synthesized recent advances in understanding the effects of atmospheric pollutants, especially O_3_, NO_2_, SO_2_, and CO, on plant physiological, transcriptomic, and yield related responses. According to multiple studies, O_3_ consistently emerges as a dominant factor in photosynthetic suppression, yield loss, and stomatal regulation. Comparative transcriptomic insights reveal overlapping defense networks but also stressor-specific pathways, underscoring the complexity of plant responses. However, research remains fragmented, with limited integration across species, pollutant types, and environmental contexts. Future work must prioritize multi-stressor frameworks, crop specific validations, and systems level modeling to develop actionable mitigation strategies. This review provides a foundation to inform those next steps. A chemistry centric synthesis reveals that gaseous pollutants differ in upstream reactivity, SO_2_ as a soluble nucleophile that drives sulfitolysis and sulfur detox fluxes, NO_x_ as a nitro- oxidative system that rewires proteins through S-nitrosylation and nitration, O_3_ as an electrophile that primes apoplastic ROS and stomatal dysfunction, and CO as a heme- binding inhibitor with a dose-dependent signaling side but converge on a common physiological cascade, disturbed redox networks, impaired electron transport, altered guard-cell control, and depressed photosynthesis and yield. Comparative evidence is strongest for ozone because physiology-aware exposure metrics connect leaf uptake to national harvests, for NO_x_ and SO_2_, mechanistic clarity at the biochemical level now points to tractable engineering and breeding levers, for CO, the dual role of gas transmitter versus toxin demands careful dose aware interpretation.
Closing the remaining gaps will require field-realistic mixture exposures coupled to diurnal stomatal dynamics, speciation aware dosing, and live redox measurements inside the apoplast, and models that carry biochemical states up to canopy fluxes and economics. With those elements in place, plant science can shift from post hoc diagnosis to predictive control, selecting genotypes with resilient antioxidant and sulfur detox capacities, tuning guard cell circuits to avoid O_3_ induced sluggishness without compromising drought response, scheduling irrigation and canopy management to minimize high risk flux windows and informing air quality policy with metrics that reflect biological dose. Because plants are at once victims, sentinels, and mitigators in the atmosphere biosphere exchange, protecting their biochemical integrity safeguards food security, ecosystem services, and public health in a warm, increasingly polluted world.
The reference list from the paper itself. Each links out to its DOI / PubMed record.
- 1Aarabi F. Li S. Guo X. Sierla M. Kangasjärvi J. Kangasjärvi S. (2023). Genome-wide association study unveils ascorbate regulation by PAS/LOV PROTEIN during high light acclimation. Plant Physiol. 193, 2037–2054. doi: 10.1093/plphys/kiad 323, PMID: 37265123 PMC 10602610 · doi ↗ · pubmed ↗
- 2Abdo H. G. Wang C. Jin H. He J. (2022). Coupling the environmental impacts of reactive nitrogen losses and yield responses of staple crops in China. Front. Plant Sci. 13, 927,935. doi: 10.3389/fpls.2022.927935, PMID: 36092406 PMC 9450997 · doi ↗ · pubmed ↗
- 3Adaros G. Weigel H. J. Jäger H. J. (1991). Single and interactive effects of low levels of O 3, SO 2 and NO 2 on the growth and yield of spring rape. Environ. pollut. 72, 269–286. doi: 10.1016/0269-7491(91)90002-E, PMID: 15092095 · doi ↗ · pubmed ↗
- 4Agathokleous E. Paoletti E. De Marco A. (2022). iso AOT 40: An improved ozone exposure index based on the Annual Ozone Spectrum Profile (AO 3SP). J. Forestry Res. 33, 1949–1955. doi: 10.1007/s 11676-022-01537-7, PMID: 41810330 · doi ↗
- 5Aguilar-Garrido A. Reyes-Martín M. P. Vidigal P. Abreu M. M. (2023). A green solution for the rehabilitation of marginal lands: The case of Lablab purpureus (L.) Sweet grown in technosols. Plants 12, 2682. doi: 10.3390/plants 12142682, PMID: 37514296 PMC 10385650 · doi ↗ · pubmed ↗
- 6Ahlfors R. BroschéM. Kollist H. Kangasjärvi J. (2009). Nitric oxide modulates ozone-induced cell death, hormone biosynthesis and gene expression in Arabidopsis thaliana. Plant J. 58, 1–12. doi: 10.1111/j.1365-313X.2008.03756.x, PMID: 19054359 · doi ↗ · pubmed ↗
- 7Akram N. A. Shafiq F. Ashraf M. (2017). Ascorbic acid-a potential oxidant scavenger and its role in plant development and abiotic stress tolerance. Front. Plant Sci. 8, 613. doi: 10.3389/fpls.2017.00613, PMID: 28491070 PMC 5405147 · doi ↗ · pubmed ↗
- 8Antenozio M. L. Caissutti C. Caporusso F. M. Marzi D. Brunetti P. (2024). Urban air pollution and plant tolerance: omics responses to ozone, nitrogen oxides, and particulate matter. Plants 13, 2027. doi: 10.3390/plants 13152027, PMID: 39124144 PMC 11313721 · doi ↗ · pubmed ↗