Lon protease reprograms cellular physiology of Streptomyces coelicolor resulting in enhance antibiotic production
Aslı Bayraktar, Sude Kara, Zeynep Demir, Sezer Okay, Sedef Tunca

TL;DR
This study shows that overexpressing the Lon protease in Streptomyces coelicolor enhances antibiotic production by reprogramming the bacteria's cellular processes.
Contribution
The first comprehensive systems-level analysis of Lon protease overexpression effects in Streptomyces.
Findings
Lon overexpression increases antibiotic production by altering secondary metabolism and stress response.
Lon influences morphological differentiation and sustains pellet morphology during fermentation.
A new chromosomal integration site for the pRAlon vector was identified in SCO3793.
Abstract
The genus Streptomyces is widely recognized as a rich source of natural compounds, including antibiotics, immunosuppressants, and herbicides. Synthesis of secondary metabolites is initiated by cellular differentiation and is a complex process regulated by intracellular and extracellular signals, as well as numerous regulatory proteins. ATP-dependent Lon protease plays a key role in cellular proteostasis and stress adaptation. Overexpression of this protease has been shown to increase the production of actinorhodin (ACT) and undecylprodigiosin (RED) in Streptomyces coelicolor. However, the systems-level mechanisms underlying this phenotype remain unclear. In this study, we employed a multifaceted approach encompassing whole-genome sequencing (WGS), transcriptomics, and high-resolution imaging to analyze how Lon reprograms the cellular physiology of the hyper-antibiotic-producer…
Genes, proteins, chemicals, diseases, species, mutations and cell lines named across the full text — each resolved to its canonical identifier and authoritative record.
Click any figure to enlarge with its caption.
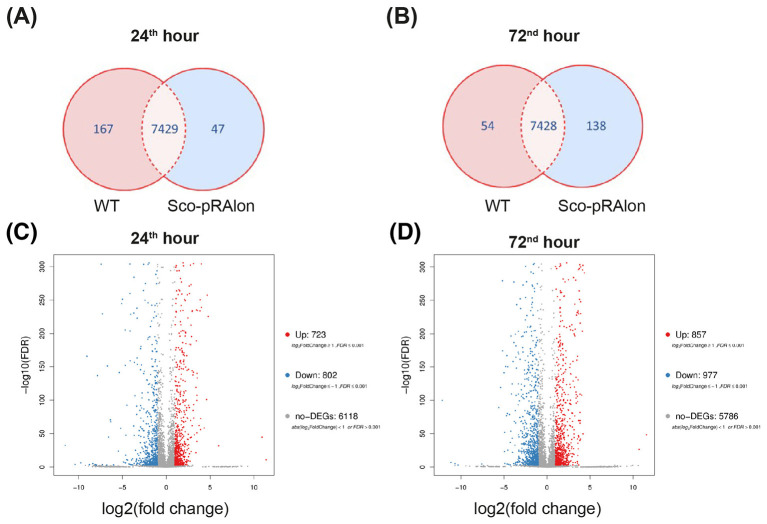 Figure 1
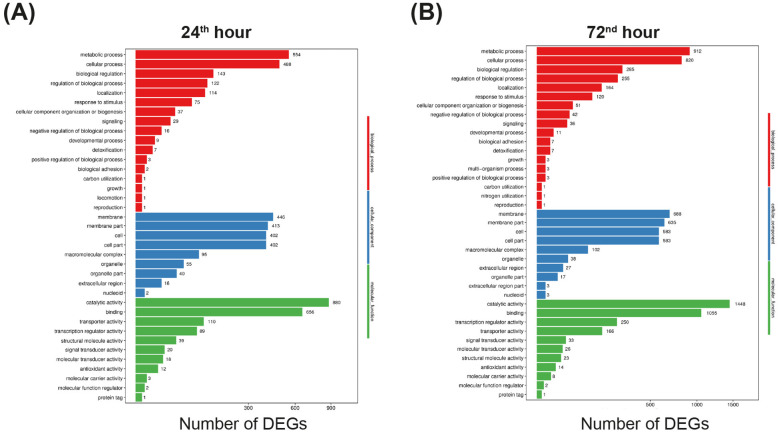 Figure 2
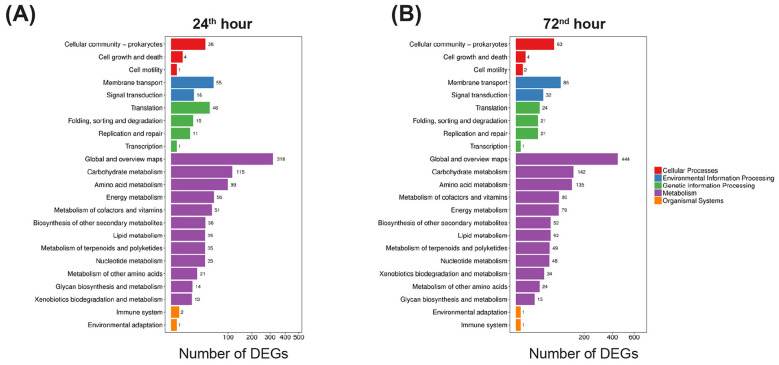 Figure 3
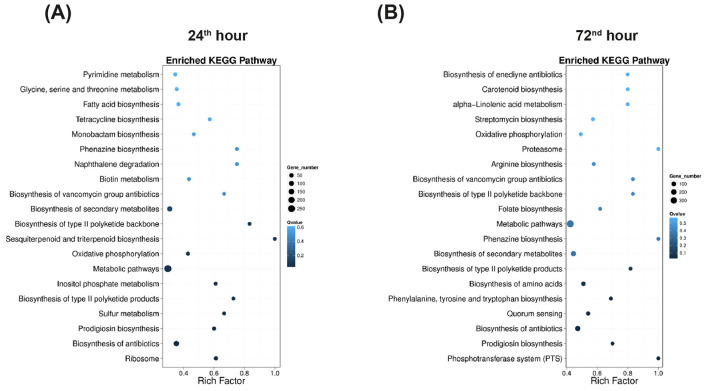 Figure 4
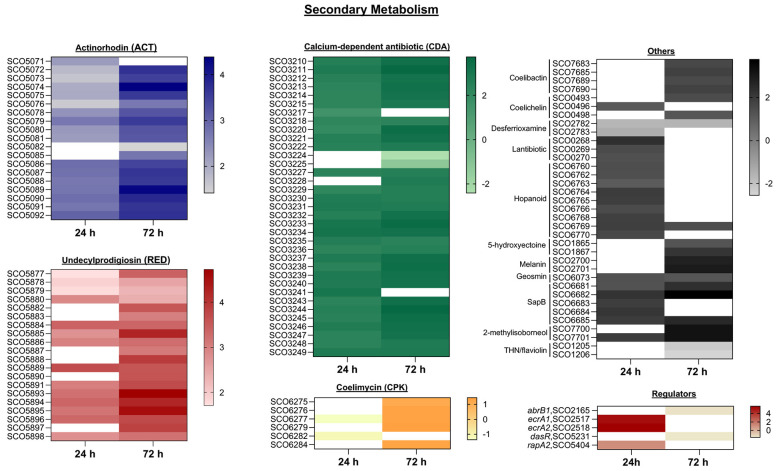 Figure 5
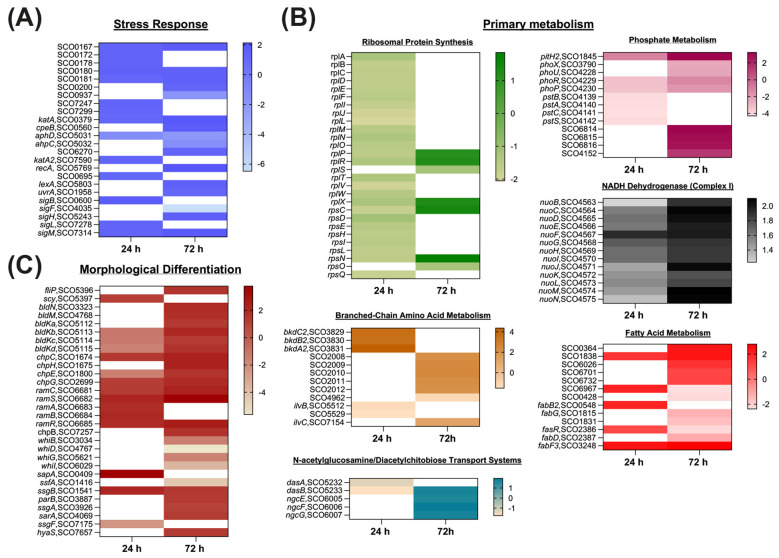 Figure 6
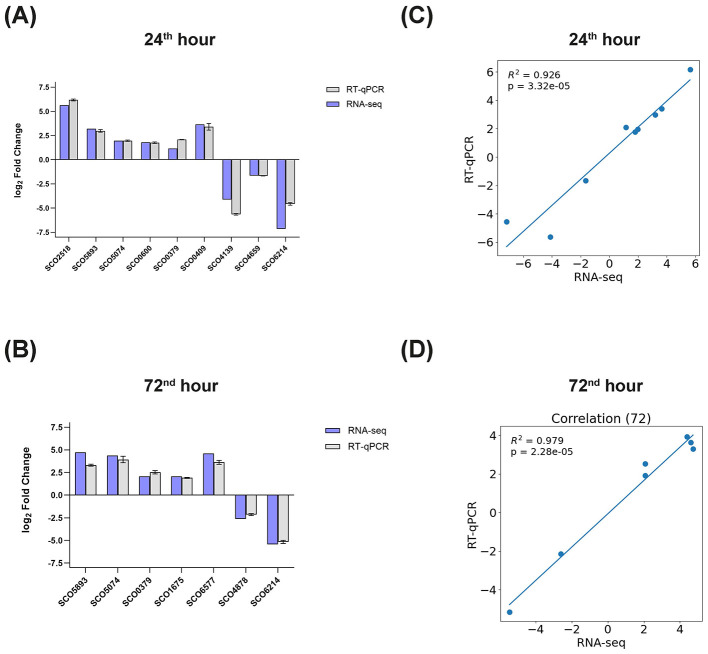 Figure 7
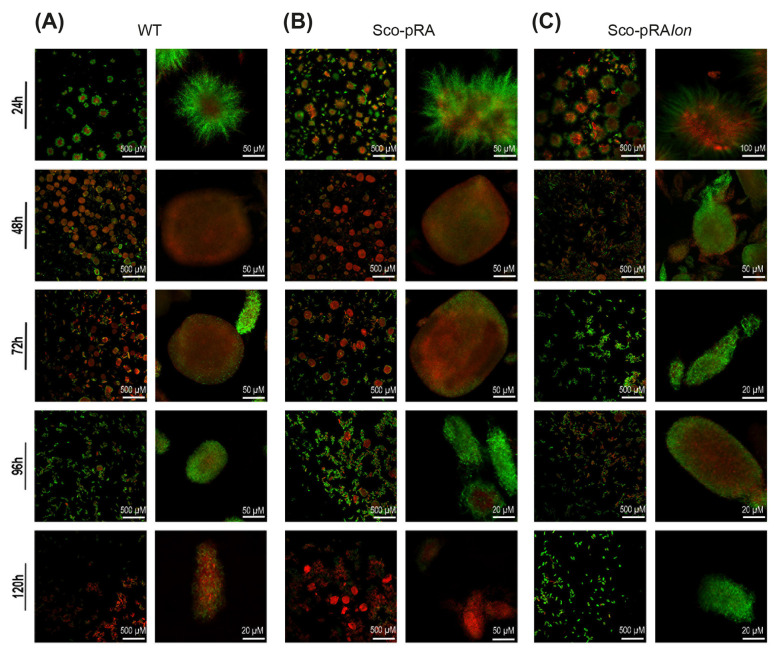 Figure 8
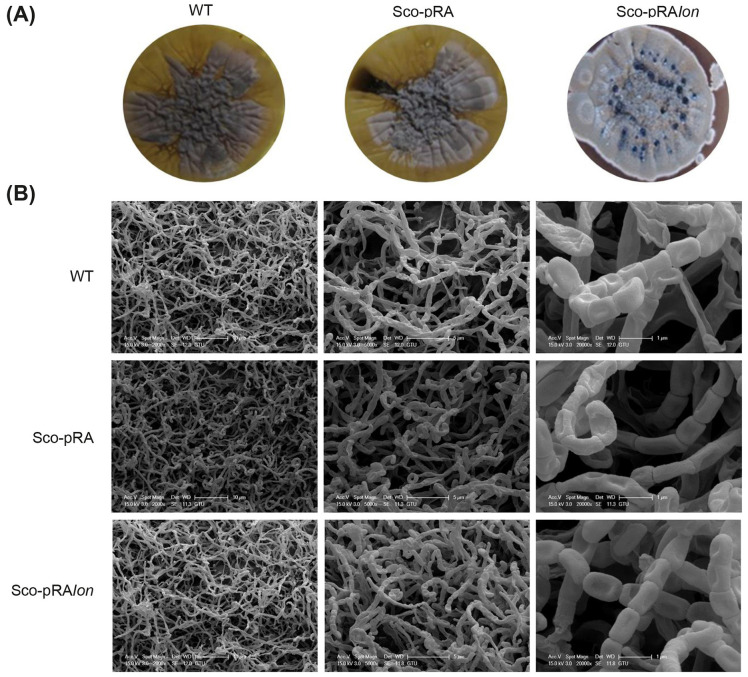 Figure 9
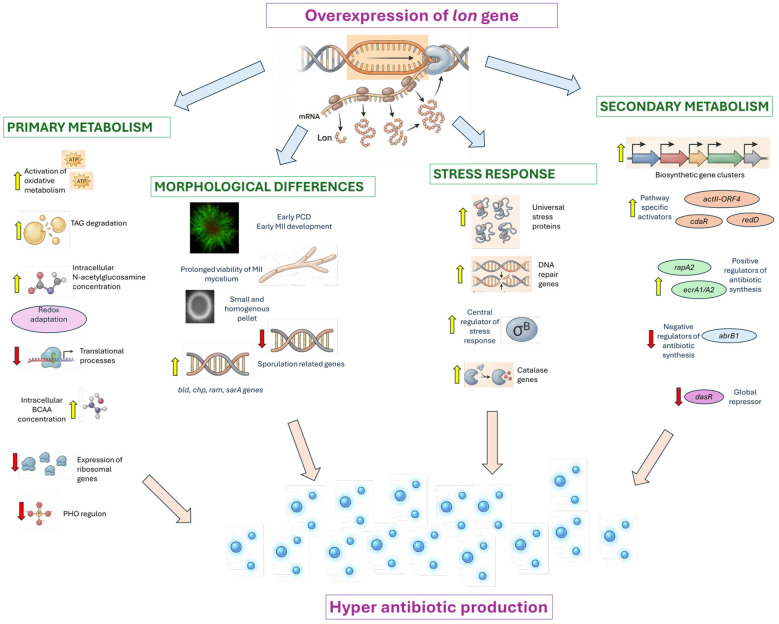 Figure 10
Peer Reviews
No public reviews on file for this paper yet. If you reviewed it on a platform where reviews are public (OpenReview, ICLR, NeurIPS, ICML), you can paste yours below so the community can read it here.
Videos
No videos yet. Explain this paper in a talk, walkthrough, or lecture? Add one.
Taxonomy
TopicsMicrobial Natural Products and Biosynthesis · Cyclopropane Reaction Mechanisms · Bacterial Genetics and Biotechnology
Introduction
1
Streptomyces species are notable producers of bioactive natural products, including many frontline antibiotics, antifungals, immunosuppressants, and antitumor agents (Barka et al., 2016). Approximately two-thirds of the currently approved antibiotics originate from actinomycetes, and the majority of these (around 80%) are derived from Streptomyces, whose genomes contain an expansive repertoire of cryptic biosynthetic gene clusters (Alam et al., 2022; Donald et al., 2022). The biosynthesis of secondary metabolites is known to be triggered by environmental stress signals and controlled by intricate molecular networks involving multiple families of regulatory proteins (Bibb, 2005).
In Streptomyces, the synthesis of secondary metabolites is closely linked to its complex life cycle (Manteca and Yagüe, 2018). Development in both solid and submerged cultures proceeds through two distinct mycelium stages: primary mycelium (MI, compartmentalized mycelia) and secondary mycelium (MII, antibiotic-producing mycelia). Growth begins with the formation of MI following spore germination. MI cells subsequently undergo highly ordered programmed cell death (PCD). The remaining viable segments then differentiate into the MII which are multinucleated, antibiotic-producing mycelia (Manteca et al., 2008; Yagüe et al., 2014; Manteca and Yagüe, 2018). This PCD-driven morphological remodeling results in pellet and clump formation in submerged cultures and aerial mycelium formation and sporulation in solid cultures. Together these processes shape the organism's characteristic growth phases (Yagüe et al., 2010, 2014).
The remarkable biosynthetic versatility of Streptomyces is achieved through multilayered regulatory networks that coordinate different processes, including morphological differentiation, metabolic fluxes, and stress responses (Manteca et al., 2008; Van Wezel and McDowall, 2011; Liu et al., 2013; Manteca and Yagüe, 2018). ATP-dependent Lon protease is a central node in proteostasis and provides a strategic leverage point for rewiring the cell's transcriptional network. Lon is an evolutionarily conserved AAA^+^ protease that plays a key role in cellular physiology by degrading misfolded or damaged proteins, as well as numerous regulatory proteins (Tsilibaris et al., 2006; Lee and Suzuki, 2008; Gur et al., 2011). As a pleiotropic regulator in bacteria, Lon governs various developmental processes, including sporulation (Tojo et al., 1993; Liu et al., 1999), the cell cycle (Wright et al., 1996; Omnus et al., 2021) and capsule synthesis (Torres-Cabassa and Gottesman, 1987). It also governs behavioral processes, such as quorum sensing (Takaya et al., 2008), biofilm formation and motility (Marr et al., 2007), and pathogenicity (Kirthika et al., 2023). Lon is also required for adaptation to diverse environmental stress conditions, including the UV stress (Mizusawa and Gottesman, 1983; Barkad et al., 2021; Yilmaz et al., 2025) and the SOS response (Breidenstein et al., 2012), nutrient starvation (Kuroda, 2006), and osmotic stress (Barkad et al., 2021; Yilmaz et al., 2025).
Moreover, studies have shown that Lon can influence the biosynthesis of bioactive compounds; for instance, it represses pyoluteorin biosynthesis in Pseudomonas fluorescens Pf-5 (Whistler et al., 2000), whereas its overexpression has been reported to increase endotoxin production in Bacillus thuringiensis (Barkad et al., 2021). The role of the Lon protease in Streptomyces species has been investigated only to a limited extent; Sobczyk et al. demonstrated that lon is part of the HspR/HAIR heat-shock response regulon, yet its impact on secondary metabolism has not been examined in this study (Sobczyk et al., 2002). Previously, we demonstrated that recombinant strains of Streptomyces coelicolor A3(2) overexpressing the lon gene exhibited a significant increase in the production of actinorhodin and undecylprodigiosin (Demir et al., 2019; Yilmaz et al., 2025). The molecular mechanisms, by which Lon reshapes transcription networks, primary metabolism, and developmental progression, influencing secondary metabolism and resulting in high antibiotic production in S. coelicolor are unknown. In this study, we address this knowledge gap by integrating whole-genome sequencing (WGS), transcriptome profiling, and advanced imaging to dissect Lon-mediated regulation in S. coelicolor A3(2).
Materials and methods
2
Microorganisms and culture conditions
2.1
For this study, we used the wild-type (WT) strain of S. coelicolor A3(2) (Hopwood, 1999), as well as its recombinant strains. The recombinant strains, designated as Sco-pRA and Sco-pRAlon, were previously generated through the insertion of the integrative pRA plasmid with apramycin resistance gene and the pRAlon plasmid with lon protease gene into the S. coelicolor A3(2) genome, respectively (Demir et al., 2019). pRA and pRAlon are ϕC31-based integrative vectors. The Streptomyces strains were cultivated at 30 °C in TBO for sporulation, TSB and R2YE for fermentation, and YEME media for DNA isolation and scanning electron microscopy (SEM) analysis. The media were supplemented with apramycin (50 μg/ml) when necessary.
DNA isolation, whole genome sequencing and bioinformatics analysis
2.2
A volume of 200 μl spores of Sco-pRA and Sco-pRAlon strains were grown in YEME medium at 30 °C for 2 days. An aliquot of this pre-culture was then inoculated into fresh YEME medium at a ratio of 1:10 (v/v) and incubated under the same conditions. After incubation, genomic DNA was isolated using the NucleoSpin Microbial DNA Isolation Kit (Macherey-Nagel, Germany) according to manufacturer's instructions. The concentration and purity of the final DNA product were determined by spectrophotometric measurements using a NanoDrop (BioDrop, UK). The isolates were then sent to BGI (Hong Kong) for WGS. A bioinformatics analysis of the WGS raw data was performed using the FASTQC (Andrews, 2010), Trimmomatic (Bolger et al., 2014), Burrows-Wheeler Aligner (Li and Durbin, 2009), and Samtools (Li et al., 2009) programs. The “Genome Analysis Toolkit” (McKenna et al., 2010) was used in the variant acquisition processes, while the “Ensembl Variant Effect Predictor (VEP)” (McLaren et al., 2016) was employed in the variant annotation processes. The break and insertion regions were determined using custom-written R Studio codes (Team, 2021).
RNA isolation
2.3
For RNA isolation, 200 μl of S. coelicolor A3(2), Sco-pRA, and Sco-pRAlon spores were grown separately in TSB medium at 30 °C for 2 days. Equal wet-weight cell pellets were harvested from the pre-cultures and inoculated into R2YE medium. Samples were collected from the cultures at 24, 36, 48, 60, 72, and 96 h after inoculation. The cell pellets were dissolved in 200 μl of TE buffer and approximately 70 μl of lysozyme (10 mg/ml) was added. The mixture was then incubated at 37 °C for 60 min. After the preliminary lysis step, total RNA was isolated using a NucleoSpin RNA Plus isolation kit (Macherey-Nagel GmbH & Co, Germany), according to the manufacturer's instructions. To ensure the purity of the RNA samples, deoxyribonuclease I (Thermo Scientific, USA) was used to eliminate any possible DNA contamination. The concentration and purity of the RNA were determined by spectrophotometric measurements using a NanoDrop (BioDrop, UK), and the RNA integrity value (RIN) was determined using an Agilent 2100 Bioanalyzer (USA). After quantification, the RNA was divided into aliquots and stored at −80 °C for future use.
Library construction, RNA sequencing, and bioinformatic analysis
2.4
The RNA samples from the S. coelicolor A3(2), Sco-PRA, and Sco-pRAlon strains were sequenced using a 2 × 150 bp paired-end protocol on the Illumina HiSeq 2000 platform (BGI, Hong Kong). Sequencing was performed with two biological replicates of each strain. The adapter sequences, unknown bases, residual rRNA sequences, and low-quality reads were filtered out using the SOAPnuke v1.5.2 internal software (Chen et al., 2018). The clean reads obtained after filtering were stored in FASTQ format and mapped using HISAT2 (Kim et al., 2015). For gene expression analysis, the clean reads were aligned to the S. coelicolor reference genome (GenBank accession number: AL645882.2) using Bowtie2 (Langmead and Salzberg, 2012). Gene expression levels were then calculated using RSEM (Li and Dewey, 2011) and normalized to obtain fragments per kilobase of transcript per million mapped reads (FPKM) values for each gene. The differentially expressed genes (DEGs) between the WT and ScoPRAlon were identified with DESeq2 (Love et al., 2014). Transcripts showing at least two-fold change in expression level (|log_2_(FoldChange)| ≥ 1), a P-value ≤ 0.05, and a false discovery rate (FDR) value ≤ 0.05 were identified as significantly differentially expressed genes (Benjamini and Yekutieli, 2001; Supplementary Tables S1, S3). Gene ontology (GO) enrichment and Kyoto Encyclopedia of Genes and Genomes (KEGG) pathway enrichment analyses were performed using Hyper, an R Studio function, to categorize the DEGs. The raw sequencing data were deposited on the NCBI SRA website (http://www.ncbi.nlm.nih.gov/sra/) under the Bioproject accession number; PRJNA1077142.
Quantitative real-time PCR (RT-qPCR)
2.5
RNA samples were analyzed by RT-qPCR to determine which subset should undergo further sequencing. The results were also used to compare and validate the RNA-seq analysis results. The primers used were designed through web-based tools (Primer 3, Primer Blast and OligoAnalyzer Tool-DT) and are presented in Supplementary Table S2. The cDNA synthesis was performed using 300 ng of RNA and random hexamer primers with the iScript cDNA Synthesis Kit (Bio-rad, USA). RT-qPCR reactions were performed using SYBR Green qPCR Master Mix (Bio-rad, USA) in a StepOnePlus™ Real-Time PCR System (Applied Biosystems). The reaction components were as follows: 10 μl SYBR Green supermix (2X), 3 μl cDNA (30 ng), 0.8 μl (10 μM) F primer, 0.8 μl (10 μM) R primer and 5.4 μl dH_2_O to give a final volume of 20 μl. The RT-qPCR thermal profile included an initial denaturation step (10 min at 95 °C) followed by 40 cycles of amplification (15 min at 95 °C and 1 min at 60 °C). Melting curve analysis was performed at a range of 55–95 °C in 0.1 °C increments to evaluate the specificity of the primers. The reference genes gyrA and hrdB were used for the normalization of the gene expression, while cDNAs from the S. coelicolor A3(2) strain were used as positive controls. Changes in relative gene expression values were calculated using the formula 2^−ΔΔCT^ (Livak and Schmittgen, 2001). Statistical analyses of gene expression levels were performed using the Mann-Whitney test in GraphPad Prism 10.6.1 software.
Confocal laser scanning microscopy (CLSM) analysis
2.6
The LIVE/DEAD Bac-Light Bacterial Viability Kit (L-7012) was used for the confocal analysis (Fernandez and Sanchez, 2001). The samples were prepared by cultivating Streptomyces cells in R2YE medium at 30 °C and at 200 rpm. Cultures of 1 ml were collected at 24-h intervals during the 5-day fermentation process. The pellets obtained by centrifugation of the samples at 12.000 rpm for 5 min were washed twice with 1 ml of dH_2_0. According to the kit instructions, the SYTO 9 and PI nucleic acid staining mixture was subsequently added to the pellets. After a 10 min incubation at room temperature in the dark, 20 μl of the mixture was spread onto a clean microscope slide. The prepared slides were then imaged using a Zeiss LSM 880 confocal microscope at 488 nm and 568 nm excitation and 530 nm (green) or 630 nm (red) emission wavelengths.
Scanning electron microscopy (SEM) analysis
2.7
For the SEM analysis, the sterilized aluminum stubs were inserted at an angle of about 45° into YEME agar plates until approximately half of the stub was dipped into the medium. Bacterial samples were then spread along the line where the surface of the stubs met the medium by using an inoculating loop. After 12 days of incubation at 30 °C, the upper surface of each stub was then coated with gold and examined under the scanning electron microscope (Philips XL 30 SFEG; Kumar et al., 2011).
Results
3
Results of WGS analysis for identifying the location(s) where the pRAlon and pRA plasmids integrates into the genome
3.1
In a previous study, the lon gene, together with its native promoter, was successfully cloned into the integrative vector pRA which has ϕC31 int/attP site (Demir et al., 2019). Subsequently, the recombinant plasmid was integrated into the S. coelicolor A3(2) genome. Remarkably, the recombinant strain, SCO-pRAlon, exhibited a notable increase in antibiotic production compared to the wild type (Demir et al., 2019). Through WGS coupled with bioinformatic analysis revealed that pRAlon, which has a ϕC31 int/attP site, was integrated into two distinct regions in the genome, separated by 7 kilobases. As anticipated, the first integration site was identified within the SCAC2.06c gene (SCO3798), which encodes a putative chromosome condensation protein (Supplementary Figure S1). It has been established that the integration of integrative vectors into this specific attB region is 300 times more effective (Combes et al., 2002). The second integration region was identified within the SCAC2.01 (SCO3793) gene, which encodes a hypothetical protein. This region is entirely novel and distinct from the pseudo-attB regions identified to date (Combes et al., 2002; Supplementary Figure S1). Since each integrated pRAlon construct carries a single lon gene, the Sco-pRAlon strain harbors a total of three lon gene copies in its genome (one native chromosomal copy and two integrated copies). To be used as the control strain, the empty plasmid pRA was also integrated into the S. coelicolor genome resulting in Sco-pRA. According to the WGS results, pRA was found to be integrated into a single location: the attB region within the SCAC2.06c (SCO3798) gene, as expected (Supplementary Figure S2).
General features of the RNA-seq data: recombinant Sco-pRAlon strain vs. the wild type
3.2
We isolated total RNA from the S. coelicolor A3(2) wild type (Sco), Sco-pRA and Sco-pRAlon strains at the 24^th^ and 72^nd^ hours of fermentation, then performed sequencing with two biological replicates. We decided to sequence the samples from the 24^th^ and 72^nd^ hours after conducting a preliminary study (Supplementary Figure S3). A significant difference in lon gene expression was observed in the Sco-pRAlon strain compared to the wild type Sco strain at the 24^th^ hour of fermentation. The 72^nd^ hour was the time point at which lon and actII-ORF4, which encodes the actinorhodin activator protein, exhibited the highest expression levels (Supplementary Figure S3).
Following RNA sequencing, we conducted a comparative analysis of the expression levels of all identified transcripts. For clarity, this section only compares data from the recombinant Sco-pRAlon strain and the wild-type strain.
After filtering the raw data, an average of 35.68 Mb of clean reads were obtained per sample. These reads mapped to the reference genome with an average ratio of 95.01%, and a total of 7,729 genes were successfully detected. Further analysis revealed that a total of 7,429 genes were expressed in both strains, while 167 and 47 genes were only expressed in the WT and Sco-pRAlon strains, respectively, at the 24^th^ hour (Figure 1A). At the 72^nd^ hour, we detected 7,428 genes that were commonly expressed in both strains. The number of genes exclusively expressed in the WT strain decreased to 54, while the number of genes expressed in the Sco-pRAlon strain increased to 138 (Figure 1B). Subsequent gene expression analyses revealed the total number of upregulated and downregulated DEGs in the Sco-pRAlon strain and WT strain, as depicted in the volcano plot graphs (Figure 1). Specifically, 1,525 genes exhibited differential expression at the 24^th^ hour, with 723 up-regulated and 802 down-regulated genes (Figure 1C). By the 72 h, the number of DEGs had increased to 1,834, including 857 up-regulated and 977 down-regulated genes (Figure 1D). These findings underscore a heightened transcriptional activity in the recombinant strain at the 72^nd^ hour compared to the 24^th^ hour.
Overview of the RNA-Seq analysis. (A) Venn diagram showing the distribution of genes commonly or exclusively expressed in the Sco-pRAlon and WT strains at 24th hour and (B) 72nd hour. (C) A volcano plot illustrating the differentially expressed genes (DEGs) between the Sco-pRAlon strain and WT at 24th hour and (D) 72nd hour. The X-axis represents the value of log2 (fold change, FC) and, the Y-axis represents the value of –log10 (false discovery rate, FDR). Genes with a log2 fold change ≥ 1 and an adjusted p-value ≤ 0.001 (red dots) are considered significantly upregulated, and genes with a log2 fold change ≤ −1 and an adjusted p-value ≤ 0.001 (blue dots) are considered significantly downregulated. Gray dots indicate non-significant genes with an absolute log2 fold change value of <1.
GO analysis of DEGs
3.3
GO classification and functional enrichment analyses were performed to determine the functions of the DEGs identified by the comparisons between the SCO-pRAlon and wild-type cDNA libraries. The DEGs were categorized into three main GO domains: biological process, molecular function, and cellular component. At the 24^th^ and 72^nd^ hours of fermentation, 37 and 39 significantly enriched and highly similar GO terms were identified, respectively (Figure 2). The highest number of DEGs were found in the categories of catalytic activity, binding, metabolic processes, cellular processes, and membrane components at both time points. Notably, the number of DEGs identified at the 72^nd^ hour time point was higher in almost all categories (Figure 2B).
GO functional classification map of significant DEGs at 24th hour (A) and at 72nd hour, color coded based on the main GO domain (B). X axis represents number of DEGs. Y axis represents the GO term.
KEGG pathway analysis of DEGs
3.4
KEGG pathway analysis revealed significant differences in the biological pathways associated with the DEGs in the high-antibiotic-producing strain Sco*-pRAlon*. Based on the KEGG pathway classification, 1,016 and 1,410 DEGs, found at 24^th^ and 72^nd^ hour timepoints, respectively, were assigned to 5 categories: cellular processes, environmental information processing, genetic information processing, metabolism and organismal systems. At both time points, the DEG ratios of the individual categories were very similar, with the metabolism pathway having the highest ratio of about 83%. Approximately 9% of the total DEG fraction is related to terpenoid and polyketide metabolism and the biosynthesis of other secondary metabolites in this pathway (Figure 3).
The KEGG pathway classification maps of the significant DEGs at the 24th hour (A) and 72nd hour (B) are color coded by the KEGG pathway categories. The X-axis represents the number of DEGs, and the Y-axis represents the pathway name.
Next, KEGG pathway functional enrichment analysis was used to determine the distribution of DEGs in the recombinant strain more specifically. Metabolic pathways and pathways related to antibiotic and other secondary metabolite biosynthesis were among the top 20 enriched pathways with the highest DEG numbers for both time points (Figure 4). Supplementary Figure S4 shows the distribution of up- and down-regulated DEGs belonging to the 30 significantly enriched pathways in the SCO-PRAlon strain. At the 24^th^ hour, there was a trend toward increased expression levels of genes involved in secondary metabolic pathways, including the biosynthesis of some antibiotics. Conversely, the expression levels of genes related to the biosynthesis of amino acids such as glycine, serine, threonine, valine, and leucine, which are indicative of primary metabolism, tend to decrease (Supplementary Figure S4A). At the 72^nd^ hour, differences in the ratio of up- and down-regulated DEGs were observed; however, a similar alteration was seen for both primary and secondary metabolisms (Supplementary Figure S4B). Although gene expression is not necessarily directly proportional to the amount of antibiotic produced, it is clear that the recombinant strain shifts carbon flux from primary to secondary metabolism. The following sections further elucidate these metabolic switches by examining the expression levels of important DEGs and their physiological functions in S. coelicolor A3(2).
Bubble diagram of the functionally enriched KEGG pathways of DEGs at 24th hour (A) and 72nd hour (B). The X-axis indicates the enrichment factor, and the Y-axis indicates the pathway name. Bubble size represents the number of genes belonging to a specific KEGG pathway. Color represents the enriched Q value, with lighter colors indicating a higher Q value. The color bar is shown on the right.
Categorization of DEGs in the Sco-pRAlon strain
3.5
RNA-seq analysis revealed that the high antibiotic-producing recombinant strain had DEGs involved in four main biological processes: secondary metabolism, stress response, primary metabolism and morphological differentiation (Figures 5, 6, Supplementary Table S3).
Heat map showing the DEGs involved in secondary metabolite biosynthesis between the S. coelicolor A3(2) wild-type strain and the Sco-pRAlon recombinant strain. Genes with a |log2 (fold change)| ≥ 1 and P ≤ 0.05 with FDR ≤ 0.05 were considered to be significantly differentially expressed. RNA samples were prepared from cultures of the strains grown in R2YE liquid medium for 24th and 72nd hours. For exact values see Supplementary Table S3.
Heat maps showing the DEGs involved in (A) stress response, (B) primary metabolism, and (C) morphological differentiation between S. coelicolor A3(2) wild-type and Sco-pRAlon recombinant strains. Genes with a |log2 (fold change)| ≥ 1 and P ≤ 0.05 with FDR ≤ 0.05, were considered to be significantly differentially expressed. RNA samples were prepared from cultures of the strains grown in R2YE liquid medium for 24th and 72nd hours. For exact values see Supplementary Table S3.
Secondary metabolism
3.5.1
Approximately 30 biosynthetic gene clusters responsible for metabolite production have been identified in the fully sequenced S. coelicolor genome (Bentley et al., 2002; Challis and Hopwood, 2003; Jeong et al., 2016). In the Sco-pRAlon, significant expression changes were observed in multiple gene clusters, with upregulation being predominant (Figure 5, Supplementary Table S3). Antibiotic biosynthetic clusters, including ACT (SCO5071–SCO5092), the RED (SCO5877–SCO5898), and the calcium-dependent antibiotic (CDA; SCO3210–SCO3249), showed strong induction. Expression levels increased up to 13-fold at 24^th^ hour and up to 27-fold at 72^nd^ hour. Pathway-specific regulatory genes were also upregulated: actII-ORF4 (~6.6-fold at 72^nd^ hour), redD (~3.3-fold at 24^th^ hour and ~10.6-fold at 72^nd^ hour), and cdaR (~2.9-fold at 24^th^ hour). In addition, six differentially expressed genes were identified within the coelimycin (CPK) biosynthetic cluster (SCO6273–SCO6288; Figure 5, Supplementary Table S3). RT-qPCR validation of redK (SCO5893) and actVI-3 (SCO5074) showed strong concordance with the RNA-seq data at both time points (Figure 7).
Validation of the RNA-seq measurements. (A) Comparison of log2 fold changes in the expression levels of several Sco-pRAlon and WT genes, as measured by RNA-seq (blue bars) and RT-qPCR (gray bars) at the 24th and (B) 72nd hours of fermentation. Error bars represent standard deviation from the mean. The significance threshold for the analysis of differentially expressed genes a p-value of < 0.05 for the RNA seq and RT-qPCR experiments. (C) Correlation between RNA-seq and RT-qPCR-based gene expression analysis at 24th hour and (D) 72nd hour. The linear regression line and Pearson correlation coefficient are indicated in the figures.
Genes associated with siderophore biosynthesis displayed cluster-specific expression patterns. Coelibactin cluster genes (SCO7683, SCO7685, SCO7689, and SCO7690) exhibited 3.5-fold upregulation at 72^nd^ hour, while coelichelin cluster genes (SCO0493, SCO0496, and SCO0498) showed ~2.8-fold increase at the same time point. In contrast, desferrioxamine biosynthetic genes SCO2782 and SCO2783 were downregulated (~3.2-fold and ~2.7-fold, respectively; Figure 5, Supplementary Table S3).
Additional biosynthetic clusters exhibited positive regulation at both time points, including those involved in lantibiotic (SCO0267–SCO0270), hopanoid (SCO6759-SCO6771), 5-hydroxyectoine (SCO1864–SCO1867), melanin (SCO2700–SCO2701), geosmin (SCO6073), SapB (SCO6681–SCO6685), and 2-methylisoborneol (SCO7700–SCO7701) biosynthesis. In contrast, THN/flaviolin biosynthesis genes SCO1205 and SCO1206 showed a ~4.8-fold decrease in expression at 72^nd^ hour (Figure 5, Supplementary Table S3).
Significant changes in the expression of several TCS-related genes were observed in the recombinant strain. The response regulator abrB1 (SCO2165) was downregulated by approximately 2.9-fold at 72^nd^ hour, whereas rapA2 (SCO5404) was upregulated (~3-fold at 24^th^ hour). ecrA1 (SCO2517) and ecrA2 (SCO2518) were strongly upregulated (~36.4–49.2-fold) at 24^th^ hour, this result was confirmed for ecrA2 by RT-qPCR. In contrast, the global regulator dasR (SCO5231; Świa̧tek-Połatyńska et al., 2015) was downregulated by ~3.2-fold at 72^nd^ hour (Figure 5, Supplementary Table S3).
Stress response
3.5.2
Significant transcriptional changes were detected in genes involved in various stress responses in the Sco-pRAlon strain compared to the wild type strain (Figure 6A, Supplementary Table S3). Notably, genes encoding universal stress proteins (SCO0167, SCO0172, SCO0178, SCO0180, SCO0181, SCO0200, SCO7247 and SCO7299) were found to be up-regulated by up to 2.75-fold at 24^th^ hour and up to 3.14-fold at 72^nd^ hour of fermentation. In contrast, only SCO0937 exhibited downregulation, showing an approximately 3.5-fold decrease at 72^nd^ hour.
Genes involved in the oxidative stress response also showed differential expression. Catalase encoding genes katA (SCO0379), cpeB (SCO0560), katA2 (SCO7590) and SCO6270 exhibited a consistent trend of positive regulation. Conversely, the expression of aphD (SCO5031) and aphC (SCO5032), which exhibit oxidoreductase activity, showed negative regulation.
Marked induction was also observed in SOS response–related genes. The expression levels of uvrA (SCO1958), lexA (SCO5803) and recA (SCO5769) increased markedly (up to 4.4 fold) particularly at 72^nd^ hour. In addition, SCO0695, which encodes a conserved hypothetical protein, exhibited a 2.23-fold upregulation at 24^th^ hour.
Sigma factors associated with the general stress response (Kormanec et al., 2016) displayed notable expression changes in the recombinant strain. sigB (SCO0600) and its associated factors sigH (SCO5243), sigM (SCO7314), and sigL (SCO7278) were upregulated by up to 3.5 fold at 24^th^ hour and up to 3.7-fold at 72^nd^ hour. In contrast, sigF (SCO4035), involved in the late stages of sporulation (Potúčková et al., 1995), was strongly down-regulated (~89-fold) at 72^nd^ hour. RT-qPCR validation confirmed the positive regulatory trend observed in katA (SCO0379) and sigB (SCO0600; Figure 7).
Primary metabolism
3.5.3
Ribosomal protein synthesis
3.5.3.1
The majority of genes encoding both the large (rpl) and small (rps) ribosomal subunits were markedly down-regulated in the Sco-pRAlon strain compared to the wild-type at 24^th^ hour of fermentation (e.g., rplB, rplC, rplD, rplF, rplJ, rplM; rpsE, rpsH, rpsI, rpsL). At 72^nd^ hour, although fewer DEGs were associated with ribosomal subunits, several genes (rplP, rplR, rplX, rpsN) exhibited a low-level upregulation trend (Figure 6B; Supplementary Table S3). RT-qPCR analysis confirmed the ~3.12-fold downregulation of rpsL (SCO4659) at 24^th^ hour, which is consistent with the RNA-seq data (Figure 7).
Branched-chain amino acid metabolism
3.5.3.2
The S. coelicolor genome contains two distinct BCDH (branched-chain n-keto acid dehydrogenase) gene clusters that are involved in catabolizing branched-chain amino acids (valine, isoleucine, and leucine), namely bkdA1B1C1 (SCO3817–SCO3815) and bkdA2B2C2 (SCO3831–SCO3829; Sprusansky et al., 2005). The bkdA2B2C2 cluster demonstrated consistent upregulation across all genes, reaching up to 20.6-fold at 72^nd^ hour.
In contrast, genes associated with branched-chain amino acid biosynthesis were generally downregulated. Except for a 2.32-fold upregulation of ilvC2 (SCO7154) at 72^nd^ hour, reduced expression levels were observed for ilvB (SCO5512), SCO4962 and SCO5529 at both time points. Additionally, SCO2008–SCO2012 operon, which encodes a high-affinity ABC transporter system responsible for the uptake of these amino acids (Świa̧tek-Połatyńska et al., 2015), was uniformly upregulated, with expression increases of up to 5.7-fold at 72^nd^ hour (Figure 6B, Supplementary Table S3).
N-acetylglucosamine/diacetylchitobiose transport systems
3.5.3.3
NgcE (SCO6005), NgcF (SCO6006), and NgcG (SCO6007) are components of an ABC transporter system that is involved in the N-acetylglucosamine (GlcNAc) uptake in S. coelicolor A3(2) (Świa̧tek-Połatyńska et al., 2015), showed increased expression in the Sco-pRAlon strain, reaching up to 3.7-fold at 72^nd^ hour.
Another transport system that exhibited significant expression changes is the DASABC sugar transport system, which is responsible for the uptake of diacetylchitobiose (GlcNAc)2 (Saito et al., 2007). Within this system, the structural gene dasA (SCO5232) was downregulated by approximately 2.5-fold at 24^th^ hour of fermentation. Similarly, the permease subunit gene dasB (SCO5233) showed a 3.37-fold downregulation at 24^th^ hour; however, this repression shifted to a comparable level of upregulation (3.25-fold) at 72^nd^ hour (Figure 6B, Supplementary Table S3).
Phosphate metabolism
3.5.3.4
Consistent downregulation of genes involved in the regulation of phosphate metabolism was observed in the recombinant strain. This included the two-component PhoR (SCO4229)/PhoP (SCO4249) system and the regulatory proteins PhoU (SCO4228) and PhoX (SCO3790); among these genes, the strongest downregulation reached ~9.5-fold at 24^th^ hour and ~5.3-fold at 72^nd^ hour.
Significant transcriptional changes were also identified in genes associated with inorganic phosphate (Pi) uptake systems in S. coelicolor. All genes within the high-affinity Pi transport operon pstSCAB (SCO4139–SCO4142; Martín and Liras, 2021) exhibited a strong downregulation of approximately 20-fold exclusively at 24^th^ hour. Notably, the repression of SCO4139, which encodes PstB, was also validated by RT-qPCR analysis (Figure 7).
In contrast, the gene encoding the low-affinity Pi uptake system component pitH2 (SCO1845; Santos-Beneit et al., 2008) showed a biphasic pattern, with ~2.12-fold downregulation at 24^th^ hour followed by marked upregulation (~9.42-fold) at 72^nd^ hour. Similarly, the putative orthologous pst operon (SCO6814–SCO6816; Lewis et al., 2010; Díaz et al., 2013) showed no significant change at 24^th^ hour but displayed consistent upregulation ranging from 6.73- to 9.4-fold at 72^nd^ hour. Finally, SCO4152, encoding a secreted 5′-nucleotidase (Martín et al., 2012), showed an approximately 2.7-fold increase in expression at 72^nd^ hour (Figure 6, Supplementary Table S3).
Energy metabolism
3.5.3.5
RNA-seq analyses revealed significant alterations in the expression of genes related to energy metabolism in the recombinant strain compared to the wild type (Supplementary Table S3). Notably, the nuo operon (nuoA–N), which encodes the subunits of NADH dehydrogenase/Complex I (a key component of oxidative phosphorylation) in S. coelicolor (Brekasis and Paget, 2003) was strongly upregulated up to four-fold at both 24^th^ and 72^nd^ hours, indicating enhanced respiratory activity and elevated cellular energy generation in the recombinant strain.
DEGs related to fatty acid metabolism were also analyzed (Figure 6B, Supplementary Table S3). Genes involved in fatty acid degradation displayed a predominantly upregulated profile. Consistent increases at the 24^th^ and/or 72^nd^ hours were observed for SCO0364, SCO1838, SCO6026, SCO6071, SCO6732, and SCO6967. Of these genes, only SCO6967, which encodes a beta-ketoadipyl-CoA thiolase, showed negative regulation at the 72^nd^ hour. In contrast, DEGs associated with fatty acid biosynthesis did not exhibit a consistent expression pattern. At the 24^th^ hour, fabB2 (SCO0548), fasR (SCO2386), and fabF3 (SCO3248) were upregulated, indicating transient activation of lipid biosynthesis. However, at 72^nd^ hour, repression was observed for all detected genes (SCO0428, SCO1815, SCO1831, SCO2386, and SCO2387), except for fabF3, which remained upregulated.
Particularly notable was the downregulation of fabD (SCO2387), a core component of the primary fatty acid biosynthesis operon (fabDHPF; Zhang et al., 2020), together with repression of fasR (SCO2386), the transcriptional activator of this operon (Arabolaza et al., 2010). This coordinated repression suggests a metabolic shift away from fatty acid biosynthesis toward fatty acid catabolism, likely supporting increased energy production and precursor redistribution required for secondary metabolite biosynthesis.
Morphological differentiation
3.5.4
A significant number of well-characterized genes associated with the Streptomyces life cycle were found to be differentially expressed in the Sco-pRAlon strain (Figure 6C, Supplementary Table S3). Genes involved in the transition from spore germination to vegetative mycelium were upregulated, including filP (~3.1-fold at 72^nd^ hour) and scy (~2.3-fold at 24^th^ hour). bldM and bldN genes, which are required for the initiation of the transition from vegetative growth to aerial mycelium formation (Merrick, 1976), were upregulated by approximately four-fold at 72^nd^ hour in the recombinant strain. Similarly, the bldK operon genes (SCO5112-5115), which encode an ABC transporter system essential for aerial hyphae development (Nodwell et al., 1996), were downregulated by up to three-fold at 24^th^ hour but showed increased expression of up to 4.5-fold at 72^nd^ hour of fermentation.
In Streptomyces species, chaplin (ChpA–H), rodlin and SapB proteins are known to play key roles in the formation of the hydrophobic sheath, a crucial structure in aerial mycelium differentiation (Claessen et al., 2003; Elliot et al., 2003). In the recombinant strain, these genes were notably upregulated. At 24^th^ hour of fermentation, expression of chpG, and chpH genes increased 2.34- and 2.72-fold, respectively, while chpE was downregulated by approximately 2.7-fold. At 72^nd^ hour, most chp genes exhibited up to 5.3-fold upregulation, except chpA, chpF, and chpD. The ramCSAB gene cluster (SCO6681-6685), responsible for SapB synthesis (O'Connor and Nodwell, 2005; Flärdh and Buttner, 2009), was upregulated up to 4.7-fold at 24^th^ hour and up to 13.6-fold at 72^nd^ hour. Consistently, the cluster regulator ramR (O'Connor and Nodwell, 2005), showed increased expression at both time points.
The whi (white) genes are involved in the differentiation of aerial mycelium into spore chains (Chater, 1972). Of these genes, whiB, whiD, whiG, and whiI showed no significant change at 24^th^ hour, but exhibited up to an 49.3-fold downregulation at 72^nd^ hour of fermentation.
Expression changes have also been observed in the DEGs associated with the septation and maturation of spore chains in the recombinant strain. Among members of the SsgA-like proteins (SALPs), which regulate sporulation-specific cell division (Traag and van Wezel, 2008), ssgF was downregulated by approximately 5.2-fold at 24^th^ hour whereas ssgB was upregulated at both time points (~4.5-fold at 24^th^ hour and ~2.7-fold at 72^nd^ hour). ssgA showed an approximately 2.1-fold increase only at 72^nd^ hour. During septation, genes responsible for proper chromosome segregation (Vollmer et al., 2019), parB (~2.5-fold up) and sffA (up to ~21.4-fold down), showed significant expression changes only at 72^nd^ hour of fermentation. For the gene sarA, which is associated with suppression of sporulation (Ou et al., 2008), approximately 2.5-fold increase in expression was detected at 72^nd^ hour. Additionally, sapA, encoding a spore-associated protein precursor (Yagüe et al., 2014), was upregulated by ~12.5-fold at 24^th^ hour, as confirmed by RT-qPCR (Figure 7). Finally, hyaS, involved in hyphal contact and pellet morphology (Koebsch et al., 2009), was upregulated by ~2.6-fold at 72^nd^ hour (Figure 6C, Supplementary Table S3).
Validation of transcriptome data using RT-qPCR
3.6
Using RT-qPCR, we measured the expression levels of 12 differentially expressed genes in the Sco-pRAlon strain (Supplementary Table S2). We then compared these expression levels with the corresponding RNA-seq measurements to validate our results. Figure 7 illustrates this comparison for several genes, including those critical for primary metabolism (SCO4659, rpsL; SCO4139, ptsB), secondary metabolism (SCO2518, ecrA2; SCO5893, redK; SCO5074, actVI-3), stress response (SCO0600, sigB; SCO0379, catA), and morphological differentiation (SCO0409, sapA; SCO1675, chpH). We also included three randomly selected DEGs with high negative or positive abundance values in this comparison: SCO6577 (conserved hypothetical protein SC3F9.12), SCO6214 (putative permease), and SCO4878 (putative glycosyltransferase). At 24^th^ hour, six genes showed upregulation, while three exhibited downregulation (Figure 7A). Five of the seven maintained their elevated expression at 72^nd^ hour, along with SCO1675 and SCO6577, which were not detected at the earlier time point (Figure 7B). Conversely, only one of the downregulated genes displayed consistent downregulation (Figure 7B). We observed a high degree of concordance between the RT-qPCR and RNA seq results for all genes tested, with a Pearson correlation coefficient of >0.9 (Figures 7C, D), suggesting that the transcriptomic measurements are valid.
Effect of lon overexpression on S. coelicolor morphogenesis in liquid and solid cultures
3.7
Using CLSM, we examined the relationship between morphological transitions associated with the MI and MII stages and the live/dead cell dynamics of the recombinant strain and the two control strains (wild-type and Sco-pRA) under liquid culture conditions (Figure 8). Throughout the fermentation period, the control strains exhibited a developmental pattern highly consistent with the classical Streptomyces life cycle. However, the morphology of Sco-pRAlon differed markedly (Figure 8). In liquid culture, MI mycelia form pellets that grow radially and undergo PCD, dying from the center outward (Manteca et al., 2008). This process results in the formation of mycelial pellets containing dead (red) MI mycelia at the center and live (green) MI mycelia around them, as observed in all strains at the 24^th^ hour of fermentation (Figure 8). However, unlike the control strains, the recombinant strain exhibited a wider and more distinct dead cell area observed at the center of the pellets, indicating that it entered the PCD process at an earlier stage of development (Figure 8C). Similar diameters and a high percentage of dead mycelium were observed in the control strains at the 48^th^ and 72^nd^ hours (Figures 8A, B). These results suggests that control strains likely completed the first phase of exponential growth, which corresponds to MI mycelial development, within 24–48-h time interval. Subsequently they entered a transient growth arrest phase, which is marked by the cessation of pellet diameter increase. At 72^nd^ hour of fermentation, the general trend in these cultures showed that the second (exponential) growth phase had begun. This phase was marked by the start of growth of live MII mycelium from the remaining MI mycelium segments, which led to an increase in the live portions of the pellets. Consistent with this process, by 96th hour of fermentation, the live colony ratio had become dominant in both control cultures. As the proportion of dead cells gradually increased during incubation, by the end of the 120-h period, the cultures were predominantly consisted of dead mycelial segments (Figures 8A, B).
CLSM results of the wild type (A), Sco-pRA (B), and Sco-pRAlon (C) strains grown in R2YE medium. The cells were stained with SYTO 9 (green, live) and propidium iodide (red, dead). Each culture is shown as a merged wide-field image representing at different scales, as indicated by the scale bar in the figures.
On the other hand, the onset of MI-to-MII differentiation, a key event in antibiotic biosynthesis, was observed at 48^th^ hour in Sco-pRAlon. This indicates that Sco-pRAlon may have exited the growth arrest phase earlier than the control strains, likely between 24 and 48 h (Figure 8). In the recombinant strain, culture revitalization associated with MII mycelial development was observed at 72^nd^ hour (compared to 96th hour in the control), and the sustained presence of a dense viable population up to 120 h was particularly remarkable (Figure 8C). Additionally, across the culture, this strain exhibited a smaller and more homogeneous pellet morphology. Despite its deviation from the classical developmental cycle, it is evident that the accelerated morphological transition in the Sco-pRAlon strain significantly contributes to its high level of antibiotic production.
We then performed SEM analysis to investigate the morphological differentiation processes of S. coelicolor strains grown in solid culture (Figure 9A). After a 10-day incubation period, we observed that all strains underwent a PCD process, which involves the transformation of vegetative MI mycelia into aerial MII mycelia, which then form unigenomic spore chains. The wild-type and Sco-pRA strains, which displayed a similar developmental profile, were found to have spore chains with predominantly empty septa after 10 days incubation. In contrast, the Sco-pRAlon strain exhibited a significantly higher spore density. Additionally, the spore chains, which had a more coiled structure, demonstrated a more regular and healthier morphology (Figure 9). Macroscopic observations, carried out in parallel with the SEM analysis, revealed a noticeable increase in the production of gray-colored spores and blue actinorhodin droplets in the recombinant strain compared to the control strains (Figure 9). The results of all morphological analyses consistently showed that the presence of two additional copies of the lon gene in the recombinant strain resulted in the developmental changes that increased its capacity for secondary metabolite production.
Macroscopic colony morphologies (A) and SEM micrographs (B) of S. coelicolor strains. For each strain, SEM micrographs are presented at three magnifications: 1 μm (left panel), 5 μm (middle panel), and 10 μm (right panel).
Discussion
4
Streptomyces species are unique microorganisms distinguished by their capacity to synthesize a wide range of valuable bioactive compounds, which are of significant value for both medical and industrial applications (Donald et al., 2022). Lon protease, a key component of stress response regulons (Sobczyk et al., 2002) and a regulator of cellular differentiation (Tsilibaris et al., 2006; Kirthika et al., 2023), has emerged as a potential modulator of secondary metabolite production in bacteria. A previous study by our group showed that the S. coelicolor A3(2) recombinant strain that overexpresses the lon gene on an integrative vector (Sco-pRAlon) produces substantially higher levels of actinorhodin and undecylprodigiosin than the wild type (Demir et al., 2019). In this study, we used a combined approach of WGS, RNA-seq, SEM, and CLSM analyses to investigate the molecular and morphological mechanisms by which Lon protease overexpression triggers antibiotic biosynthesis in the recombinant strain Sco-pRAlon.
WGS revealed a novel attB site in the S. coelicolor genome
4.1
Integrative vectors are known to insert efficiently into the canonical attB region located within the SCAC2.06c (SCO3798) gene, which is shown to be non-essential for viability, approximately 300 times more effectively than into the three previously characterized pseudo-attB sites (pseB1, dihydropteroate synthase; pseB2, hypothetical protein; and pseB3, aspartate aminotransferase genes; Combes et al., 2002). WGS revealed that the pRA vector was found to be integrated into SCO3798 gene, as expected. However, the recombinant pRAlon vector integrated into not only the attB site within SCO3798, but also into an additional locus within the SCO3793 gene. According to StrepDB (https://strepdb.streptomyces.org.uk), the SCO3793 gene encodes a conserved hypothetical protein. This previously unreported insertion site represents a new attB locus and suggests the presence of alternative integration sites within the S. coelicolor genome. Database comparisons indicate that SCO3793 (StrepDB, 2025) is 60.5% similar to the uncharacterized YjqA protein of Bacillus subtilis. However, the yjqA gene was identified solely through genomic annotation and has no known function (Kunst et al., 1997). Therefore, insertions into SCO3798 and SCO3793 are theoretically not expected to directly affect antibiotic biosynthesis. However, it has also been reported that the location and copy number of chromosomal genes can affect expression levels in a non-linear manner (Schmid and Roth, 1987; Thompson and Gasson, 2001; Bryant et al., 2014; Loehlin and Carroll, 2016). Nevertheless, to more clearly disentangle Lon-specific effects from those related to integration number and gene dosage, further studies employing single-copy controlled integration systems are required. Additionally, as extra plasmid copies are known to cause metabolic stress in bacterial cells, dual integration of pRAlon may create indirect molecular consequences (Wang et al., 2006; Silva et al., 2012). While the pRA vector is not a high-copy-number plasmid capable of contributing to secondary metabolite activation, further research is clearly needed to shed light on this issue.
Global transcriptomic insights into Lon overexpression in S. coelicolor
4.2
The genes associated with four major biological processes including secondary metabolism, primary metabolism, stress response and morphological differentiation were differentially expressed in Sco-pRAlon (Figures 5, 6, Supplementary Table S3). Furthermore, GO and KEGG enrichment analyses indicated that numerous metabolic pathways are reprogrammed through Lon protease activity, with prominent enrichments observed in pathways directly linked to secondary metabolite biosynthesis (Figures 3–5). These findings support our previous studies (Demir et al., 2019; Barkad et al., 2021; Genel and Tunca, 2024; Yilmaz et al., 2025) by demonstrating that Lon protease plays a multifaceted regulatory role at the cellular level.
Secondary metabolism
4.2.1
In fully sequenced genomes of the genus Streptomyces, genes responsible for secondary metabolite production are organized into biosynthetic clusters ranging from a few kilobases to over 100 kb (Bentley et al., 2002). At least five antibiotics with distinct chemical characteristics are synthesized in S. coelicolor, including actinorhodin (ACT), undecylprodigiosin (RED), the polyketide CPK, the calcium-dependent antibiotic (CDA), and methylenomycin (Hopwood, 1999). In the present study, lon overexpression was associated with pronounced transcriptional activation across several of these clusters, particularly ACT, RED, and CDA. Moreover, activation extended beyond major antibiotic pathways to include additional secondary metabolite clusters such as coelibactin, coelichelin, melanin, geosmin, SapB, hopanoids, and 2-methylisoborneol, indicating a broad regulatory impact.
Differential expression was not limited to biosynthetic clusters but also involved pathway-specific regulators, two-component systems (TCSs), and global transcription factors. The marked upregulation of key activator genes (actII-ORF4, redD, cdaR, rapA2, ecrA1/A2 etc.), supports the notion that Lon overexpression enhances antibiotic production through stimulation of positive regulators (Lu et al., 2007; Yong-quan et al., 2004). Conversely, the expression of global repressor gene dasR (Rigali et al., 2008) and the abrB1 gene, which encodes a component of the AbrB1/B2 TCS that negatively regulates ACT and RED biosynthesis (Sánchez de la Nieta et al., 2020), were found to be downregulated. The downregulation of these repressor genes indicates relief of transcriptional repression of antibiotic biosynthetic clusters. These findings align well with the phenotypic results, which demonstrated markedly increased antibiotic production in the Sco*-pRAlon* strain (Demir et al., 2019).
Stress response
4.2.2
Transcriptomic analysis of the Sco*-pRAlon* strain revealed pronounced activation and transcriptional reprogramming of cellular stress responses. Specifically, genes encoding universal stress proteins (USPs) and several sigma factors homologous to the general stress response factor σ(B) of B. subtilis were upregulated. In parallel, induction of SOS response genes (uvrA, lexA, recA, and SCO0695) indicates activation of DNA damage–associated repair mechanisms and supports the idea that Lon contributes to enhanced tolerance against genotoxic stress. This observation is consistent with previous reports demonstrating that Lon is required for an effective SOS response in bacteria (Breidenstein et al., 2012; Kirthika et al., 2023). The S. coelicolor recombinant strain (Sco-Lon), which expresses the lon gene on a high-copy pSPG vector, exhibited a higher survival rate following UV exposure than control strains (Yilmaz et al., 2025), thereby supporting our results.
In addition to genotoxic stress, the Sco-pRAlon strain appears to display enhanced tolerance to osmotic stress. Upregulation of sigma factors associated with the osmotic stress response, including σM, which acts downstream of σB in the regulatory cascade (Lee et al., 2005), suggests transcriptional reprogramming toward osmoprotective pathways. Comparable phenotypes have been reported in other bacteria, where lon overexpression improved osmotic stress tolerance in Escherichia coli, D. solani, and B. thuringiensis (Figaj et al., 2020; Barkad et al., 2021). Consistent with these findings, osmotic stress has been shown to induce lon expression in D. dadantii (Jiang et al., 2016). In agreement with these findings, our previous study demonstrated that Sco-Lon strain, which overexpress lon gene on a high copy number plasmid, displays improved growth under high KCl concentrations compared to controls (Yilmaz et al., 2025).
Upregulation of oxidative stress related genes suggests that the recombinant strain experiences oxidative stress and that Lon may indirectly activate oxidative stress–related metabolic pathways. Consistently, studies in Salmonella typhimurium have shown that lon mutants exhibit a reduced capacity to neutralize free radicals under oxidative stress (Kirthika et al., 2020). These findings underscore Lon's central role in managing responses to abiotic stressors, including cold, acidic, and osmotic conditions.
Collectively, these findings suggest that Lon is a component of a cellular defense network activated in response to a variety of environmental stressors in S. coelicolor. However, previous studies have shown that excessive lon expression in high-copy-number or strongly induced systems may impair cell growth due to increased proteolytic activity (Goff and Goldberg, 1987; Christensen et al., 2004; Tsilibaris et al., 2006). Conversely, in recombinant B. thuringiensis and S. coelicolor strains that acquire resistance to different stress conditions, the lon gene has been expressed from multicopy vectors without causing significant cellular damage (Barkad et al., 2021; Yilmaz et al., 2025). These seemingly divergent observations suggest that the physiological impact of Lon overexpression may depend on host background, expression levels, and the nature of the stress context. Therefore, the potential consequences of lon overexpression on cellular homeostasis and growth should be carefully assessed in a strain- and system-specific manner.
Primary metabolism
4.2.3
Ribosomal protein synthesis
4.2.3.1
In Streptomyces species, the transient growth arrest observed under submerged culture conditions, which occurs prior to antibiotic production, corresponds to the transition from vegetative to multinucleated, differentiated mycelium. This developmental shift is frequently associated with repression of the ribosomal protein synthesis (Blanco et al., 1994; Manteca et al., 2008).
The DEG analysis revealed that the majority of genes encoding both large (Rpl) and small (Rps) ribosomal subunits were significantly downregulated in the Sco-pRAlon strain at 24^th^ hour of fermentation. These transcriptomic findings are consistent with confocal microscopy observations, which revealed accelerated morphological differentiation in the recombinant strain compared to controls (Figure 8). This suggests that translational processes are suppressed at an earlier developmental stage in the recombinant strain.
Lon protease has been reported to degrade ribosomal proteins during stringent response, thereby contributing to the generation of free amino acids that can be redirected toward synthesis of stress-adaptation enzymes (Kuroda, 2006). Accordingly, the reduced expression of ribosomal genes observed may indirectly reflect Lon-dependent proteolytic activity, linking Lon overexpression to resource reallocation during early differentiation and activation of secondary metabolism.
Branched-chain amino acid metabolism
4.2.3.2
In S. coelicolor, up to 50% of the acetate required for the biosynthesis of the type II polyketide actinorhodin is derived from the catabolism of branched-chain amino acids (Stirrett et al., 2009). In Sco-pRAlon, genes within the bkdA2B2C2 cluster, which is responsible for BCAA degradation, were consistently upregulated. This observation aligns with the ensemble modeling analyses by Genel and Tunca (2024), which predicted that lon overexpression enhances the metabolic flux through the bkdA2B2C2 pathway.
In parallel, the operon encoding the ABC transporter responsible for BCAA uptake showed clear transcriptional activation, suggesting an increased intracellular BCAA concentration. This increase may be partially attributed to increased PCD and cellular lysis in the recombinant strain, processes that releases proteins and free amino acids into the extracellular environment and promote nutrient recycling. Taken together, in the Sco-pRAlon strain, characterized by pronounced transcriptional and phenotypic stress signatures, increased intracellular BCAA pools likely serve as critical metabolic precursors that support and sustain the elevated actinorhodin production phenotype.
N-acetylglucosamine signaling
4.2.3.3
The expression of dasR, a key negative regulator of antibiotic biosynthesis, was markedly downregulated in the recombinant strain at 72^nd^ hour of fermentation. According to the established DasR regulon model in S. coelicolor, DasR represses actII-ORF4 and redZ by binding to their promoters under nutrient-rich conditions, thereby inhibiting ACT and RED biosynthesis (Van Wezel and McDowall, 2011; Świa̧tek-Połatyńska et al., 2015). During nutrient limitation, however, PCD releases N-acetylglucosamine (GlcNAc), which is converted intracellularly to glucosamine-6-phosphate (GlcN-6P). This metabolite binds to DasR, preventing its interaction with DNA and relieving repression of secondary metabolic and developmental genes. Supporting this mechanism, the addition of GlcNAc to minimal medium has been shown to induce both sporulation and ACT/RED biosynthesis in S. coelicolor (Świa̧tek-Połatyńska et al., 2015).
Consistent with these findings, the Sco-pRAlon strain exhibited transcriptional activation of ngcE, ngcF, ngcG, and dasB, genes encoding transporters involved in the uptake of GlcNAc and its chitin-derived dimer, diacetylchitobiose (GlcNAc)2. The observed expression changes across the DasR regulon may thus contribute to the prolonged antibiotic production and altered developmental trajectory observed in this strain up to 120 h of fermentation.
Phosphate metabolism
4.2.3.4
Streptomyces species possess complex regulatory networks that coordinate nutrient adaptation. One such network is the PhoR-PhoP two-component system, which governs the PHO regulon under phosphate limiting conditions (Sola-Landa et al., 2003). In S. coelicolor, phosphate uptake is primarily mediated by the high-affinity ABC transporter, pstSCAB, whose expression responds strongly to extracellular phosphate levels (Martín and Liras, 2021).
In the Sco-pRAlon strain, phoR, phoP, and phoU expression was markedly downregulated (up to 9.5-fold), accompanied by strong repression of the pstSCAB operon (up to 20-fold) and reduced expression of the extracellular phosphatase phoX. These data suggest suppression of the PHO regulon and are consistent with phosphate-replete conditions (Hsieh and Wanner, 2010; Virolle, 2020). Nevertheless, despite the lack of external phosphate limitation, the Sco-pRAlon strain displayed high ACT and RED production, similar to the phenotype of ΔphoP and ΔphoR–phoP mutants (Sola-Landa et al., 2003). This apparent paradox may reflect reduced intracellular phosphate availability rather than extracellular scarcity and is potentially linked to elevated ATP consumption driven by Lon's ATPase activity. This energy imbalance likely triggered adaptive metabolic rewiring, which is consistent with reports that secondary metabolite synthesis in Streptomyces is favored under conditions of low intracellular ATP (Martín, 2004; Esnault et al., 2017).
PCD during development may further contribute to phosphate dynamics. In Streptomyces, the autolysis of MI mycelia releases amino acids, nucleotides, and phosphates to support the surviving population (Barka et al., 2016; Virolle, 2020). In Sco-pRAlon, the strong PCD observed at 24^th^ hour aligns with the increased expression of the CDA and RED clusters, which are both known to induce membrane damage and lysis. This suggests an enhanced release of phosphate into the medium. Concurrent induction of the extracellular 5'-nucleotidase gene SCO4152 supports the hypothesis of nucleotide hydrolysis and liberation of inorganic phosphate; however, metabolic validation is required.
Significant upregulation was seen in the expression of pitH2 (encoding low-affinity phosphate transporter) and the genes belonging to the putative pst operon ortholog (SCO6814–SCO6816) in S. coelicolor at the 72^nd^ hour. Meanwhile, the expression of pstSCAB genes was suppressed at 24^th^ hour and did not undergo significant change at 72^nd^ hour. These results suggest a shift in time from energy-intensive, ATP-driven Pst transport to lower-energy proton symporter systems, such as Pit, with alternative phosphate uptake routes mediated by the orthologous pst operon being engaged over time. This shift reflects an adaptation strategy that conserves ATP. Given the ATPase activity of Lon protease and lon's dual genomic integration in Sco-pRAlon, this metabolic rerouting likely mitigates intracellular energy stress while maintaining phosphate homeostasis.
Together, these phosphate-dependent adaptations not only reflect a restructured nutrient-sensing network but also suggest broader shifts in cellular energy balance, prompting a deeper examination of how Lon overexpression influences central energy metabolism pathways in S. coelicolor.
Energy metabolism
4.2.3.5
Transcriptomic analyses revealed that the Sco-pRAlon strain compensates for ATP deficiency by activating oxidative energy metabolism. Genes encoding the nuo operon, which constitutes NADH dehydrogenase (Complex I) of the electron transport chain (ETC), were strongly upregulated, indicating enhanced oxidative phosphorylation. These data suggest that the recombinant strain undergoes a compensatory metabolic shift favoring oxidative phosphorylation as the primary ATP recovery strategy.
Furthermore, lipid metabolism appeared to play a complementary role in maintaining energy homeostasis. The Sco-pRAlon strain displayed coordinated upregulation of genes associated with triacylglycerol (TAG) degradation, as well as the downregulation of genes involved in fatty acid biosynthesis within the fabDHPF operon. This pattern reflects the redirection of acetyl-CoA from lipid storage to the TCA cycle to sustain oxidative metabolism. Similar TAG catabolism has been reported in S. lividans ppk mutants under ATP limitation, where lipid turnover replenishes intracellular energy pools (Esnault et al., 2017).
The activation of oxidative metabolism, however, leads to increased production of reactive oxygen species (ROS) and oxidative stress. The upregulation of catalase genes (katA, cpeB and katA2) and the increased biosynthesis of actinorhodin (ACT), an antioxidant secondary metabolite, indicate that redox homeostasis is tightly coupled to metabolic adaptation. ACT has been shown to scavenge excess electrons from the respiratory chain and neutralize ROS, simultaneously regulating oxidative stress and respiratory efficiency (Esnault et al., 2017; Virolle, 2020).
The relationship between ATP stress, oxidative metabolism, and antibiotic biosynthesis is consistent with previous findings in Streptomyces mutants with altered ATP homeostasis. In S. lividans, ATPase overexpression reduced intracellular ATP levels, decreased lipid content, and induced ACT, RED, and CDA biosynthesis (Seghezzi et al., 2022). Similarly, artificial ATP spilling via the DX system, which dephosphorylates ATP into ADP, in S. albogriseolus/viridodiastaticus activated oxidative metabolism, increased ATP production, and stimulated antioxidant metabolite synthesis (Apel et al., 2023).
Together, these results indicate that lon overexpression drives a systemic reprogramming of energy metabolism. This is accomplished by enhancing oxidative phosphorylation, mobilizing lipid reserves, and coupling oxidative stress responses with secondary metabolite production. Thus, a tight regulatory link is established between energy balance, redox adaptation, and antibiotic biosynthesis in S. coelicolor.
Morphological differentiation
4.2.4
S. coelicolor is widely used as a model organism for studies on the regulation of antibiotic production and morphological differentiation. It exhibits a complex life cycle that includes PCD and sporulation (Yagüe et al., 2013; Barka et al., 2016). Although the developmental dynamics of solid and liquid cultures differ, transcriptomic and proteomic studies have revealed greater similarities in morphogenesis (Manteca et al., 2010a; Yagüe et al., 2014). A prominent shared feature is the coordinated upregulation of genes and proteins associated with secondary metabolism in MII mycelia (Manteca et al., 2010a,b; Yagüe et al., 2013, 2014).
In this study, transcriptomic analysis of the Sco-pRAlon strain revealed extensive developmental and regulatory reprogramming relative to the wild type. At 72^nd^ hour, a wide range of genes involved in aerial mycelium formation, including multiple bld genes and most chp (chaplin) genes were upregulated. Given that chaplins are essential structural determinants of pellet architecture, as demonstrated in the S. coelicolor M145 ΔchpABCDEFGH mutant (Van Veluw et al., 2012), their upregulation strongly indicates that lon overexpression directly remodels pellet morphology. In parallel, the ram cluster, responsible for the biosynthesis of SapB (a lantibiotic-like morphogen reducing surface tension; Kodani et al., 2004), was also upregulated. This finding provides further molecular evidence for altered mycelial organization and supports a mechanistic link between Lon overexpression, morphological changes, and activation of secondary metabolism.
Conversely, the genes associated with sporulation, including whiB, whiG, whiI, whiD, ssgF, and ssfA, and late sporulation sigma factor, sigF, were downregulated. This transcriptional pattern indicates developmental arrest prior to sporulation and suggests that cellular resources are preferentially redirected toward mycelial differentiation rather than spore maturation.
On the other hand, several genes associated with hydrophobic sheath formation and sporulation (parB, ssgA, ssgB, sarA, and sapA) were found to be upregulated in Sco-pRAlon. Consistent with our findings, Yagüe et al. demonstrated that during the MII mycelium stage of S. coelicolor, genes regulating hydrophobic cover formation and sporulation are also activated even in non-sporulating liquid cultures (Yagüe et al., 2014). Accordingly, our SEM and macroscopic observations confirmed increased spore density, more organized spore-chain architecture, and increased production of gray spores and blue actinorhodin droplets in the recombinant strain. Lon overexpression also impacted apical growth. The upregulation of FilP and Scy, which are key components of the TIPOC complex that controls hyphal tip organization in submerged cultures (Holmes et al., 2013; Van Dissel et al., 2014), indicates sustained apical growth and modified filament growth dynamics. Additional upregulation of pellet formation and stability genes (ssgA, hyaS, and scy) further supports structural remodeling. HyaS maintains hyphal contacts during submerged growth (Koebsch et al., 2009), and coordinated Scy-ParA activity supports organized pellet architecture (Ditkowski et al., 2013). Notably, elevated ssgA expression aligns with prior reports linking its overexpression to improved growth rates, reduced lag phase, smaller mycelia, and improved fermentation productivity (Van Wezel et al., 2006). Collectively, these transcriptional changes suggest that Lon overexpression modulates morphogenetic networks controlling pellet formation and differentiation.
CLSM analysis provided physiological confirmation of these molecular findings. Sco-pRAlon undergoes PCD and MII development earlier than WT or Sco-pRA strains. Importantly, the viable cell population observed at the 72^nd^ hour persisted until the 120^th^ hour, along with small, homogeneous pellets. This extended viability indicates prolonged metabolic activity and coincides with the reported peak of actinorhodin biosynthesis (Demir et al., 2019).
S. coelicolor exhibits a heterogeneous pellet population consisting of both large and small pellets under liquid culture conditions (Van Veluw et al., 2012). Morphological heterogeneity observed in the control strains has been replaced by a more homogeneous, small-sized pellet population with high viability in the recombinant strain, where large pellets are rarely encountered. According to Van Wezel et al. (2006), cells at the center of large pellets experience greater oxygen and nutrient limitations than cells in smaller pellets. Thus, the small pellet morphology observed in the recombinant strain may confer an adaptive advantage by alleviating cellular stress. Consequently, Lon-mediated morphological optimization appears to alleviate mass-transfer constraints and promote conditions favorable for secondary metabolite production.
The macroscopic and physiological changes driven by lon overexpression are therefore directly associated with the activation of secondary metabolism. This finding is consistent with morphology-targeted approaches previously shown to enhance metabolite yields in Streptomyces (Van Wezel et al., 2006; Dobson et al., 2008; Sohoni et al., 2012; López-García et al., 2014; Holtmann et al., 2017; Lajtai-Szabó et al., 2022). For example, immobilization of S. coelicolor in alginate beads increased the proportion of viable MII hyphae and boosted actinorhodin production (López-García et al., 2014), while reduced pellet diameter has been correlated with higher antibiotic yields (Dobson et al., 2008). Similarly, adding glass beads to the culture medium increased actinorhodin production by reducing pellet size in S. coelicolor (Sohoni et al., 2012; Holtmann et al., 2017).
In summary, our data collectively suggest that lon overexpression reprograms core primary metabolism in S. coelicolor, shifting the cell from a growth-focused metabolism to an energetically optimized metabolism. Early translational downregulation indicates a reduced biosynthetic load. Meanwhile, enhanced branched-chain amino acid catabolism and GlcNAc-mediated regulation likely supply key intermediates to central carbon metabolism. The repression of the PhoR–PhoP regulon and the transition from ATP-driven phosphate uptake to lower-energy Pit-based transport system suggest adjustments in phosphate and ATP homeostasis. Concurrent activation of the oxidative phosphorylation, and lipid turnover pathways indicates that oxidative metabolism compensates for the elevated ATP consumption associated with Lon activity. Taken together, Lon overexpression promotes a coordinated metabolic state that prioritizes energetic efficiency and resource redistribution within primary metabolism.
Beyond metabolism, lon overexpression accelerates developmental transitions, remodels pellet morphology, and prolongs metabolically active MII states. The early onset of PCD, rapid formation of MII, and extended MII viability collectively create a physiological landscape optimized for prolonged secondary metabolite biosynthesis. From an applied perspective, these findings highlight the potential of Lon-mediated genetic reprogramming as a promising strategy for rational morphological engineering and metabolic optimization under submerged industrial fermentation conditions.
As summarized in Figure 10, Lon protease exerts multifaceted and hierarchical control over metabolic and developmental networks. These insights may guide future efforts to engineer Streptomyces strains with enhanced metabolite production capacity.
Schematic overview of Lon protease–mediated regulation of key physiological processes in S. coelicolor. The yellow and red arrows indicate genes that predominantly exhibit up- and downregulation trends, respectively, in the Sco-pRAlon strain.
Conclusion and future perspectives
5
This study demonstrates that overexpressing the lon gene reprograms the cellular physiology of S. coelicolor. This reprogramming affects not only the biosynthesis of secondary metabolites, but also critical biological processes, including morphological differentiation, stress response regulation, and primary metabolism. These findings position Lon as a central regulatory hub linking metabolic state, morphogenesis, and antibiotic production. Beyond clarifying Lon's physiological role, this work provide insight into the regulatory nodes that could be exploited to achieve elevated and robust antibiotic yields. The recombinant strain shows biotechnological promise, particularly considering the industrial potential of actinorhodin and other colored metabolites. Such natural pigments can serve as environmentally friendly alternatives to toxic synthetic dyes.
Nevertheless, further studies are required to resolve the mechanistic basis of Lon-dependent transcriptional reprogramming, such as identification of potential Lon protease substrates through quantitative proteomics and targeted validation approaches; systematic modulation of lon gene dosage using promoters of varying strengths or inducible expression systems; functional characterization of key regulatory nodes governing developmental and metabolic transitions. Moreover, given the evolutionary conservation of Lon protease across Streptomyces species, it remains to be determined whether Lon functions as a general activator of secondary metabolism in other industrially relevant strains.
Overall, this work establishes a valuable framework for Lon protease-guided strain engineering and provides a foundation for the rational design of high-value Streptomyces cell factories for medical and industrial applications.
The reference list from the paper itself. Each links out to its DOI / PubMed record.
- 1Alam K. Mazumder A. Sikdar S. Zhao Y. M. Hao J. Song C. . (2022). Streptomyces: the biofactory of secondary metabolites. Front. Microbiol. 13:968053. doi: 10.3389/fmicb.2022.96805336246257 PMC 9558229 · doi ↗ · pubmed ↗
- 2Andrews S. (2010). Fast QC: a quality control tool for high throughput sequence data. Babraham Bioinformatics, Cambridge, United Kingdom. Available online at: https://www.bioinformatics.babraham.ac.uk/projects/fastqc/ (Accessed March 10, 2026).
- 3Apel C. Levasseur M. Lejeune C. Korch S. B. Guérard F. David M. . (2023). Metabolic adjustments in response to ATP spilling by the small DX protein in a Streptomyces strain. Front. Cell Dev. Biol. 11:1129009. doi: 10.3389/fcell.2023.1129009 PMC 1003050636968208 · doi ↗ · pubmed ↗
- 4Arabolaza A. D'Angelo M. Comba S. Gramajo H. (2010). Fas R, a novel class of transcriptional regulator, governs the activation of fatty acid biosynthesis genes in Streptomyces coelicolor. Mol. Microbiol. 78, 47–63. doi: 10.1111/j.1365-2958.2010.07274.x 20624224 · doi ↗ · pubmed ↗
- 5Barka E. A. Vatsa P. Sanchez L. Gaveau-Vaillant N. Jacquard C. Klenk H.-P. . (2016). Taxonomy, physiology, and natural products of actinobacteria. Microbiol. Mol. Biol. Rev. 80, 1–43. doi: 10.1128/MMBR.00019-1526609051 PMC 4711186 · doi ↗ · pubmed ↗
- 6Barkad M. A. Bayraktar A. Doruk T. Tunca S. (2021). Effect of lon protease overexpression on endotoxin production and stress resistance in Bacillus thuringiensis. Curr. Microbiol. 78, 3483–3493. doi: 10.1007/s 00284-021-02610-w 34272975 · doi ↗ · pubmed ↗
- 7Benjamini Y. Yekutieli D. (2001). The control of the false discovery rate in multiple testing under dependency. Ann. Stat. 1165–1188. doi: 10.1214/aos/1013699998 · doi ↗
- 8Bentley S. D. Chater K. F. Cerdeño-Tárraga A.-M. Challis G. L. Thomson N. R. James K. D. . (2002). Complete genome sequence of the model actinomycete Streptomyces coelicolor A 3(2). Nature 417, 141–147. doi: 10.1038/417141 a 12000953 · doi ↗ · pubmed ↗