Metabolic and bariatric surgery and male endocrine and reproductive health: a GRADE-assessed meta-analysis
Ruihui Zhu, Lili Li

TL;DR
Bariatric surgery improves testosterone levels and sexual function in obese men, suggesting it can help with both weight loss and reproductive health.
Contribution
This is the first GRADE-assessed meta-analysis examining the effects of bariatric surgery on male endocrine and reproductive health.
Findings
Bariatric surgery significantly increases total and free testosterone levels in obese men.
The surgery improves sexual function as measured by the International Index of Erectile Function.
Bariatric surgery reduces estradiol and prolactin levels in obese men.
Abstract
The negative impact of obesity on male fertility and sexual health is well-established. Although metabolic and bariatric surgery (MBS) offers a powerful solution for severe obesity, its impact on the male androgens, semen quality, and sexual function are not yet fully understood. A comprehensive systematic search of the literature was conducted in PubMed, Embase, the Cochrane Library, and Web of Science for relevant studies published up to July 2024. Data about reproductive hormones, semen parameters, and sexual function in men with obesity undergoing bariatric surgery was extracted. For data synthesis, weighted mean differences (WMDs) and their 95% confidence intervals (CIs) were calculated using random- or fixed-effects models, as appropriate. Fifty-nine studies with 60 arms were included in our meta-analysis. Metabolic and bariatric surgery indicated elevated levels of total…
Genes, proteins, chemicals, diseases, species, mutations and cell lines named across the full text — each resolved to its canonical identifier and authoritative record.
Click any figure to enlarge with its caption.
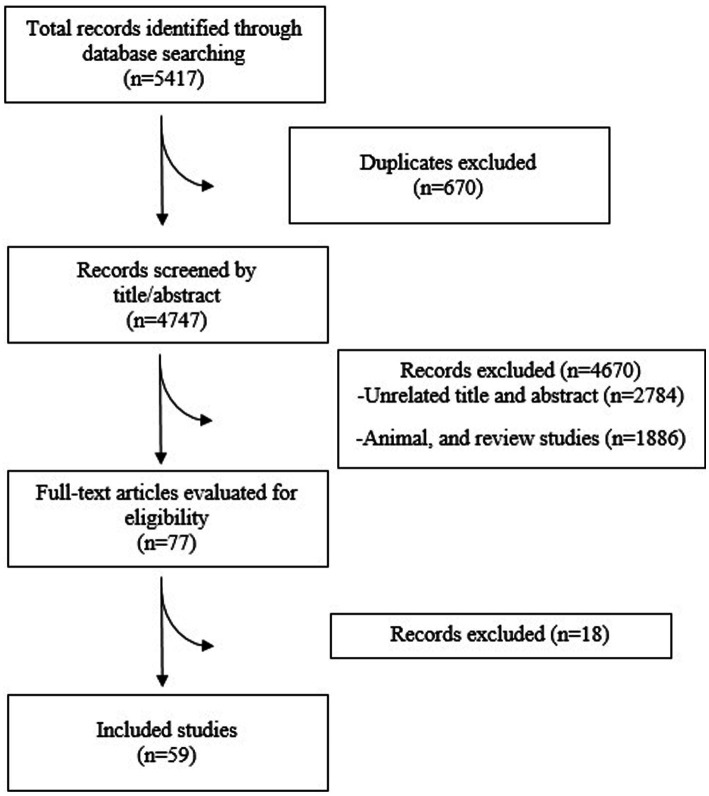 Figure 1
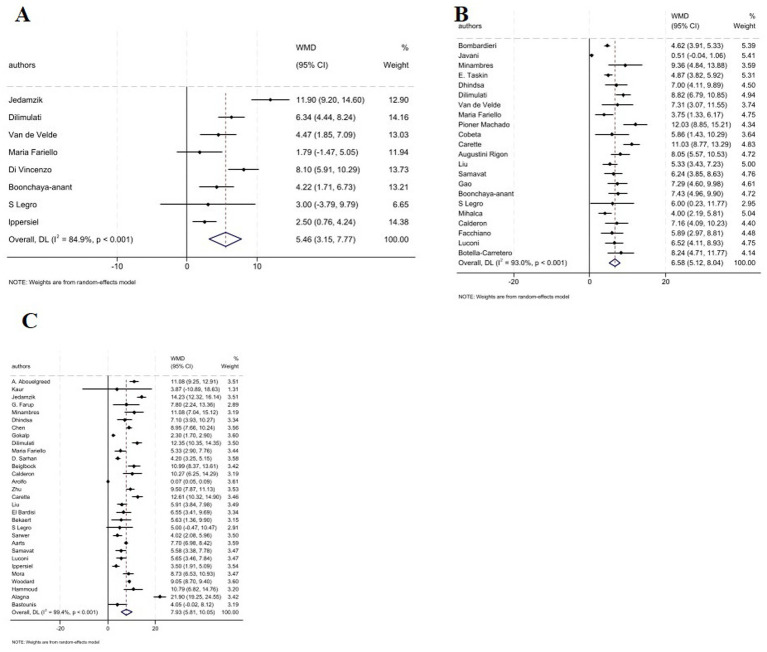 Figure 2
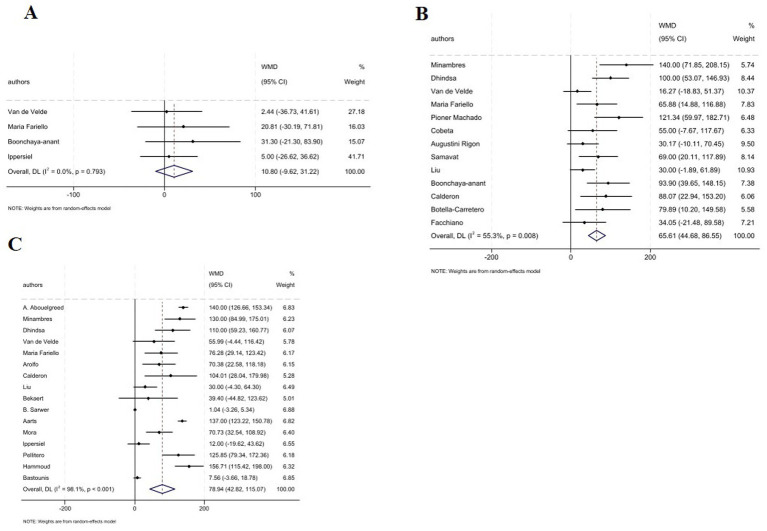 Figure 3
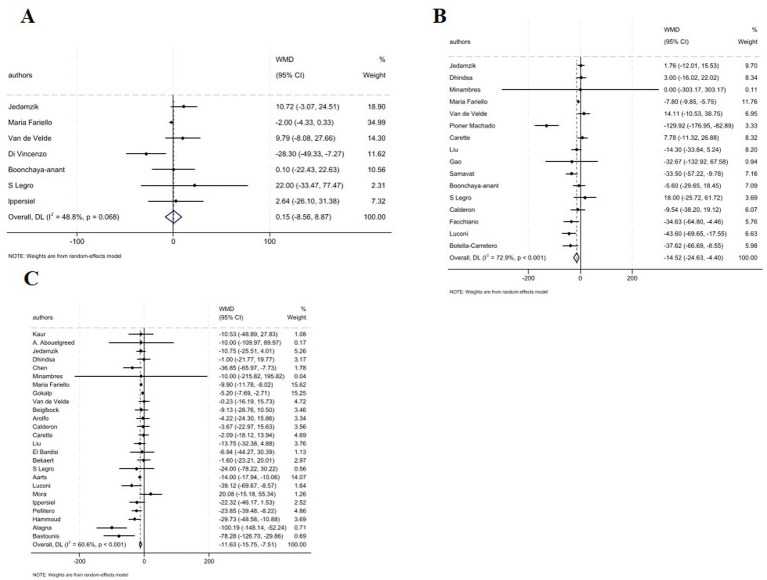 Figure 4
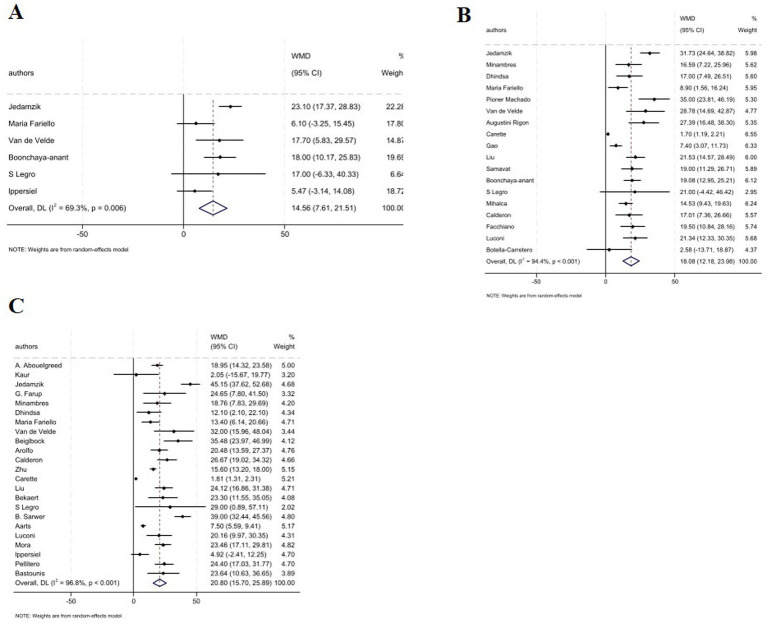 Figure 5
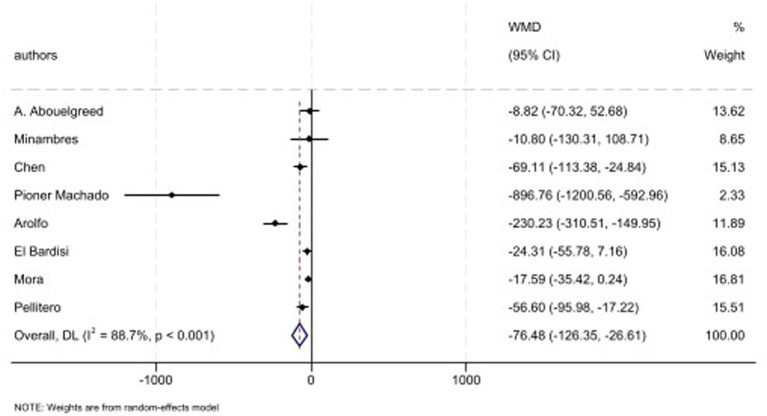 Figure 6
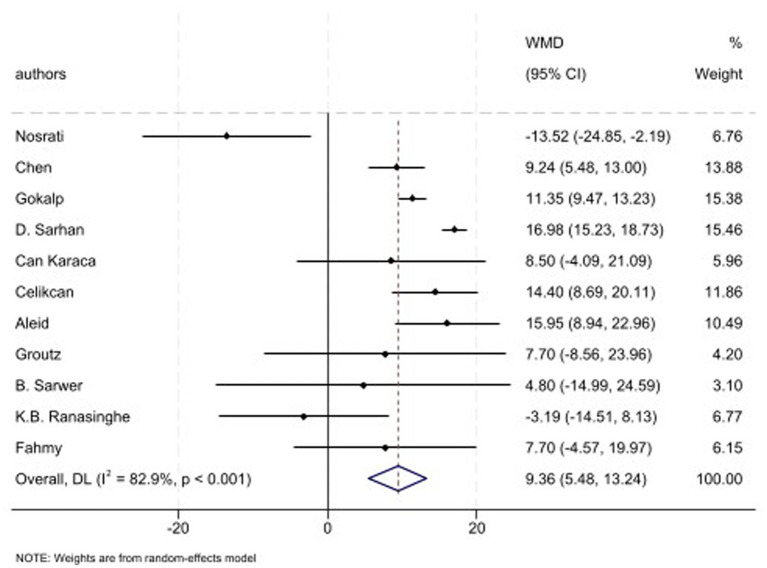 Figure 7
| Study | Year | Study design | Country | Sample size | Age | Surgery type | Follow-up (months) | Assay method | Outcome indicators |
|---|---|---|---|---|---|---|---|---|---|
| Gao et al. | 2024 | Prospective | China | 34 | 25.59 | SG | 3, 6, 12 | Immunoassay | IIEF-5 |
| Bombardieri et al. | 2024 | Retrospective | Italy | 184 | 45.5 ± 11.9 | GB + SG | 6 | Immunoassay | TT |
| Javani et al. | 2023 | Prospective | Iran | 20 | 34.74 | GB + SG | 6 | Immunoassay | TT, IIEF-5 |
| Kaur et al. | 2023 | Prospective | America | 6 | 18.21 ± 0.84 | SG | 2 y | — | TT, E2, SHBG |
| Sultan et al. | 2023 | Prospective | Malaysia | 13 | 30–45 | Others | 3, 6 | — | IIEF-5 |
| Abouelgreed et al. | 2023 | Prospective | United Arab Emirates | 54 | 46 ± 4.83 | SG | 18 | Immunoassay | TT, FT, E2, SHBG, PRL |
| Jedamzik et al. | 2023 | Retrospective | Austria | 170 | 43.2 ± 12.9 | GB | 3, 6, 24 | — | TT, E2, SHBG |
| Nosrati et al. | 2023 | Retrospective | Iran | 41 | 39.43 ± 9.26 | GB + SG | 12 | — | IIEF |
| Taskin et al. | 2022 | Prospective | Türkiye | 166 | 51.5 ± 9.3 | SG | 6 | — | TT |
| Chen et al. | 2022 | Prospective | China | 59 | 32.1 ± 6.7 | GB + SG | 23.2 | — | TT, E2, PRL, IIEF |
| Farup et al. | 2022 | Prospective | Norway | 13 | 47.7 ± 8.5 | GB + SG | 12 | — | TT, SHBG |
| Miñambres et al. | 2022 | Prospective | Spain | 12 | 45 ± 4.87 | GB + SG | 6, 18 | Immunoassay | TT, FT, E2, SHBG, PRL |
| Dhindsa et al. | 2022 | Prospective | United States | 34 | 17.4 ± 1.5 | GB + SG | 6, 60 | — | TT, FT, E2, SHBG |
| Dilimulati et al. | 2021 | Retrospective | China | 55 | 28.9 ± 7.49 | SG | 3, 6, 12 | Immunoassay | TT |
| Fahmy et al. | 2021 | Prospective | Egypt | 82 | 39 ± 14.6 | SG | 12 | Immunoassay | IIEF |
| Fariello et al. | 2021 | Prospective | Brazil | 15 | 20–50 | GB | 3, 9, 12 | — | TT, FT, E2, SHBG |
| Gokalp et al. | 2021 | Prospective | Türkiye | 31 | 34 | SG | 12 | Radioimmunoassay | TT, E2, IIEF |
| Machado et al. | 2021 | Prospective | Brazil | 33 | 36.3 ± 8.1 | GB + SG | 6 | Immunoassay | TT, FT, E2, SHBG, PRL |
| Öncel et al. | 2021 | Prospective | Türkiye | 40 | 35.70 ± 4.22 | SG | 6 | — | IIEF-5 |
| Velde et al. | 2021 | Prospective | Belgium | 14 | 52 | GB | 1.5, 6, 12 | Immunoassay | TT, FT, E2, SHBG |
| Sarhan et al. | 2021 | Prospective | Egypt | 48 | 38.56 ± 10.8 | GB + SG | 12 | Immunoassay | TT, IIEF |
| Vincenzo et al. | 2020 | Prospective | Italy | 29 | 40.5 ± 9.9 | SG | 1 | — | TT, E2 |
| Karaca et al. | 2020 | Prospective | Türkiye | 36 | 51.5 ± 6.39 | SG | 6, 12 | Immunoassay | IIEF |
| Arolfo et al. | 2020 | Prospective | Italy | 44 | 43.45 | GB + SG | 12 | — | TT, FT, E2, SHBG, PRL |
| Beiglböck et al. | 2020 | Retrospective | Austria | 49 | 42.1 ± 11.93 | GB + SG | 18 | Immunoassay | TT, E2, SHBG |
| Calderón et al. | 2020 | Prospective | Dominican | 20 | 40 ± 8 | GB + SG | 24 | Radioimmunoassay | TT, FT, E2, SHBG |
| Cobeta et al. | 2020 | Prospective | Spain | 40 | 48.5 ± 9.24 | GB + SG | 6 | Immunoassay | TT, FT |
| Celikcan et al. | 2019 | Prospective | Türkiye | 10 | 35.4 ± 5.4 | LAGB | 6 | — | IIEF-5 |
| Carette et al. | 2019 | Prospective | France | 46 | 38.9 ± 7.9 | GB + SG | 6, 12 | Immunoassay | TT, E2, SHBG, IIEF-5 |
| Zhu et al. | 2019 | Prospective | China | 56 | 30.8 ± 7.8 | SG | 12 | — | TT, SHBG |
| Rigon et al. | 2019 | Retrospective | Brazil | 29 | 42.79 ± 9.50 | GB + SG | 6 | Immunoassay | TT, FT, SHBG |
| Samavat et al. | 2018 | Prospective | Italy | 23 | 38 ± 9 | GB | 6 | Immunoassay | TT, FT, E2, SHBG |
| Chin et al. | 2018 | Prospective | United States | 16 | 16.3 ± 1.2 | LAGB | 24 | Immunoassay | TT |
| Liu et al. | 2018 | Retrospective | China | 45 | 43.73 ± 10.13 | GB | 6, 12 | — | TT, FT, E2, SHBG |
| Gao et al. | 2018 | Prospective | China | 30 | 33.0 ± 9.5 | SG | 6 | — | TT, E2, SHBG |
| Aleid et al. | 2017 | Prospective | British | 30 | 46.98 ± 7.25 | GB + SG | 3, 6 | — | IIEF |
| Groutz et al. | 2017 | Prospective | Israel | 39 | 40.7 ± 12.4 | SG | 3 | — | IIEF |
| Bardisi et al. | 2016 | Prospective | Qatar | 46 | 36.65 ± 11.48 | SG | 12 | Immunoassay | TT, E2, PRL |
| Boonchaya et al. | 2016 | Prospective | Thailand | 29 | 30.8 ± 8.1 | GB + SG | 1, 6 | Immunoassay | TT, FT, E2, SHBG |
| Legro et al. | 2015 | Prospective | United States | 6 | 36.22 ± 3.9 | GB | 3, 6, 12 | Immunoassay | TT, E2, SHBG |
| Bekaert et al. | 2015 | Prospective | Belgium | 14 | 51 ± 12 | GB | 24 | — | TT, FT, E2, SHBG |
| Sarwer et al. | 2015 | Prospective | United States | 32 | 46.84 ± 10.66 | GB | 48 | — | TT, SHBG, IIEF |
| Samavat et al. (A) | 2014 | Prospective | Italy | 55 | 42.3 ± 11.6 | GB + SG | 6, 12 | Immunoassay | TT, FT, E2, SHBG |
| Samavat et al. (B) | 2014 | Prospective | Italy | 76 | 42 ± 11 | GB | 9 | Immunoassay | TT, FT, E2, SHBG |
| Aarts et al. | 2014 | Prospective | Netherland | 24 | 43.32 ± 1.76 | GB | 12 | — | TT, FT, E2, SHBG |
| Calderón et al. | 2014 | Prospective | Spain | 35 | 39.29 ± 9.42 | GB + SG | 6 | Radioimmunoassay | TT, FT, E2, SHBG |
| Li et al. | 2014 | Retrospective | China | 39 | 45.2 | GB | 12 | — | IIEF-5 |
| Mihalca et al. | 2014 | Prospective | Romania | 28 | 43.07 ± 9.56 | SG | 6 | — | TT, SHBG |
| Facchiano et al. | 2013 | Prospective | Italy | 20 | 37.95 | GB | 6 | Immunoassay | TT, FT, E2, SHBG |
| Ippersiel et al. | 2013 | Prospective | Belgium | 21 | 43 | GB + SG | 3, 12 | — | TT, FT, E2, SHBG |
| Luconi et al. | 2013 | Prospective | Italy | 24 | 39.96 ± 12.21 | GB | 6, 12 | Immunoassay | TT, E2, SHBG |
| Carretero et al. | 2013 | Prospective | Spain | 20 | 40 ± 10.34 | GB | 6 | — | TT, FT, E2, SHBG |
| Mora et al. | 2013 | Prospective | Spain | 39 | 43.5 | GB + SG | 12 | Radioimmunoassay | TT, FT, E2, SHBG, PRL |
| Pellitero et al. | 2012 | Prospective | Spain | 33 | 40.5 ± 9.9 | GB + SG | 12 | Immunoassay | TT, FT, E2, SHBG, PRL |
| Woodard et al. | 2012 | Prospective | America | 64 | 48.1 ± 1.3 | GB | 12 | — | TT |
| Ranasinghe et al. | 2011 | Retrospective | Australia | 34 | 52.8 ± 9.33 | GB | 31.79 | — | IIEF |
| Hammoud et al. | 2009 | Prospective | United States | 22 | 48.9 ± 1.2 | GB | 24 | Immunoassay | TT, FT, E2 |
| Alagna et al. | 2006 | Prospective | Italy | 20 | 21–63 | Others | 12 | — | TT, E2 |
| Bastounis et al. | 1998 | Prospective | Greece | 19 | 34.7 ± 7.7 | Others | 12 | — | TT, FT, E2, SHBG |
| Subgroup | No. of studies | WMD (95% CI) | Meta-analysis results | ||
|---|---|---|---|---|---|
| Sex hormones | |||||
| TT (nmol/L) at 1–3 months | |||||
|
| |||||
| GB | 4 | 5.50 (0.46, 10.54) | 0.032 | 88.7 | <0.001 |
| SG | 2 | 7.13 (5.42, 8.85) | <0.001 | 29.4 | 0.234 |
| GB and SG | 2 | 3.11 (1.50, 4.73) | <0.001 | 17.9 | 0.270 |
| TT (nmol/L) at 6–9 months | |||||
|
| |||||
| GB | 8 | 5.82 (4.85, 6.78) | <0.001 | 0.0 | 0.564 |
| SG | 4 | 6.11 (4.04, 8.18) | <0.001 | 81.2 | 0.001 |
| GB and SG | 10 | 7.17 (4.61, 9.74) | <0.001 | 96.1 | <0.001 |
| TT (nmol/L) at >12 months | |||||
|
| |||||
| GB | 10 | 7.51 (6.01, 9.00) | <0.001 | 90.2 | <0.001 |
| SG | 6 | 8.04 (3.36, 12.73) | 0.001 | 97.5 | <0.001 |
| GB and SG | 11 | 7.64 (4.50, 10.78) | <0.001 | 98.3 | <0.001 |
| Others | 2 | 13.04 (−4.45, 30.54) | 0.144 | 98.1% | <0.001 |
| FT (pmol/L) at 1–3 months | |||||
|
| |||||
| GB | 2 | 9.26 (−21.81, 40.32) | 0.559 | 0.0 | 0.576 |
| GB and SG | 2 | 11.98 (−15.12, 39.08) | 0.386 | 0.0 | 0.401 |
| FT (pmol/L) at 6–9 months | |||||
|
| |||||
| GB | 6 | 41.05 (21.42, 60.67) | <0.001 | 13.4 | 0.329 |
| GB and SG | 7 | 86.12 (56.17, 116.07) | <0.001 | 50.9 | 0.057 |
| FT (pmol/L) at >12 months | |||||
|
| |||||
| GB | 7 | 71.53 (5.47, 137.58) | 0.034 | 98.5 | <0.001 |
| SG | 1 | 140. (126.66, 153.34) | <0.001 | 0.0 | <0.001 |
| GB and SG | 7 | 86.62 (49.55, 123.69) | <0.001 | 78.6 | <0.001 |
| Others | 1 | 7.56 (−3.66, 18.78) | 0.187 | 0.0 | <0.001 |
| E2 (pmol/L) at 1–3 months | |||||
|
| |||||
| GB | 4 | 3.83 (−5.23, 12.88) | 0.407 | 44.5 | 0.144 |
| SG | 1 | −28.30 (−49.33, −7.27) | 0.008 | 0.0 | <0.001 |
| GB and SG | 2 | 1.07 (−16.66, 18.80) | 0.906 | 0.0 | 0.892 |
| E2 (pmol/L) at 6–9 months | |||||
|
| |||||
| GB | 9 | −14.44 (−25.39, −3.50) | 0.010 | 68.5 | 0.001 |
| SG | 1 | −32.67 (−132.92, 67.58) | 0.523 | 0.0 | <0.001 |
| GB and SG | 6 | −20.16 (−49.86, 9.55) | 0.184 | 83.1 | <0.001 |
| E2 (pmol/L) at >12 months | |||||
|
| |||||
| GB | 9 | −12.06 (−16.24, −7.88) | <0.001 | 39.8 | 0.102 |
| SG | 4 | −5.23 (−7.71, −2.75) | <0.001 | 0.0 | 0.993 |
| GB and SG | 10 | −9.89 (−18.19, −1.58) | 0.020 | 28.0 | 0.187 |
| Others | 2 | −89.34 (−123.41, −55.27) | <0.001 | 0.0 | 0.529 |
| SHBG (nmol/L) at 1–3 months | |||||
|
| |||||
| GB | 4 | 16.17 (6.82, 25.53) | 0.001 | 67.6 | 0.026 |
| GB and SG | 2 | 11.87 (−0.41, 24.14) | 0.058 | 77.5 | 0.035 |
| SHBG (nmol/L) at 6–9 months | |||||
|
| |||||
| GB | 9 | 19.82 (14.11, 25.53) | <0.001 | 68.6 | 0.001 |
| SG | 2 | 10.83 (3.85, 17.81) | 0.002 | 77.1 | 0.037 |
| GB and SG | 7 | 18.67 (8.04, 29.29) | 0.001 | 94.7 | <0.001 |
| SHBG (nmol/L) at >12 months | |||||
|
| |||||
| GB | 9 | 25.65 (14.29, 37.01) | <0.001 | 95.6 | <0.001 |
| SG | 3 | 16.16 (11.92, 20.39) | <0.001 | 50.5 | 0.133 |
| GB and SG | 10 | 18.92 (9.82, 28.01) | <0.001 | 95.5 | <0.001 |
| Others | 1 | 23.64 (10.63, 36.65) | <0.001 | 0.0 | <0.001 |
| Study | Year | Selection | Comparability | Outcome | Overall score | |||||
|---|---|---|---|---|---|---|---|---|---|---|
| #1 | #2 | #3 | #4 | #1 | #1 | #2 | #3 | |||
| Gao et al. | 2024 | * | * | * | — | * | * | — | — | 5 |
| Bombardieri et al. | 2024 | * | * | * | — | * | * | * | — | 6 |
| Javani et al. | 2023 | * | * | * | — | * | * | * | — | 6 |
| Kaur et al. | 2023 | * | * | * | — | * | * | — | * | 6 |
| Sultan et al. | 2023 | * | * | * | — | * | * | * | — | 6 |
| Abouelgreed et al. | 2023 | * | * | * | — | * | * | — | * | 6 |
| Jedamzik et al. | 2023 | * | * | * | — | * | * | * | — | 6 |
| Nosrati et al. | 2023 | * | * | * | — | * | * | — | * | 6 |
| Taskin et al. | 2022 | * | * | * | — | * | * | * | — | 6 |
| Chen et al. | 2022 | * | * | * | — | * | * | * | * | 7 |
| Farup et al. | 2022 | * | * | * | — | * | * | — | * | 6 |
| Miñambres et al. | 2022 | * | * | * | — | * | * | * | — | 6 |
| Dhindsa et al. | 2022 | * | * | * | — | * | * | * | — | 6 |
| Dilimulati et al. | 2021 | * | * | * | — | * | * | * | — | 6 |
| Fahmy et al. | 2021 | * | * | * | — | * | * | — | * | 6 |
| Fariello et al. | 2021 | * | * | * | — | * | * | * | * | 7 |
| Gokalp et al. | 2021 | * | * | * | — | * | * | * | * | 7 |
| Velotti et al. | 2021 | * | * | * | — | * | * | * | * | 7 |
| Machado et al. | 2021 | * | * | * | — | * | * | * | * | 7 |
| Öncel et al. | 2021 | * | * | * | — | * | * | * | * | 7 |
| Velde et al. | 2021 | * | * | * | * | * | * | * | * | 8 |
| Sarhan et al. | 2021 | * | * | * | — | * | * | * | * | 7 |
| Vincenzo et al. | 2020 | * | * | * | * | * | * | — | — | 6 |
| Karaca et al. | 2020 | * | * | * | — | * | * | — | — | 5 |
| Arolfo et al. | 2020 | * | * | * | — | * | * | * | * | 7 |
| Beiglböck et al. | 2020 | * | * | * | — | * | * | * | * | 7 |
| Calderón et al. | 2020 | * | * | * | — | * | * | * | — | 6 |
| Cobeta et al. | 2020 | * | * | * | — | * | * | * | * | 7 |
| Celikcan et al. | 2019 | * | * | * | * | * | * | — | — | 6 |
| Carette et al. | 2019 | * | * | * | — | * | * | * | — | 6 |
| Zhu et al. | 2019 | * | * | * | * | * | * | * | * | 8 |
| Rigon et al. | 2019 | * | * | * | * | * | * | * | — | 7 |
| Samavat et al. | 2018 | * | * | * | — | * | * | * | — | 6 |
| Chin et al. | 2018 | * | * | * | — | * | * | * | — | 6 |
| Liu et al. | 2018 | * | * | * | — | * | * | * | — | 6 |
| Gao et al. | 2018 | * | * | * | — | * | * | * | * | 7 |
| Aleid et al. | 2017 | * | * | * | — | * | * | * | — | 6 |
| Groutz et al. | 2017 | * | * | * | — | * | * | — | * | 6 |
| Bardisi et al. | 2016 | * | * | * | — | * | * | * | — | 6 |
| Boonchaya et al. | 2016 | * | * | * | — | * | * | * | — | 6 |
| Legro et al. | 2015 | * | * | * | — | * | * | * | — | 6 |
| Bekaert et al. | 2015 | * | * | * | — | * | * | — | * | 6 |
| Sarwer et al. | 2015 | * | * | * | — | * | * | * | * | 7 |
| Samavat et al.(A) | 2014 | * | * | * | — | * | * | * | * | 7 |
| Samavat et al.(B) | 2014 | * | * | * | — | * | * | * | — | 6 |
| Aarts et al. | 2014 | * | * | * | — | * | * | — | * | 6 |
| Calderón et al. | 2014 | * | * | * | — | * | * | * | * | 7 |
| Li et al. | 2014 | * | * | * | — | * | * | * | — | 6 |
| Mihalca et al. | 2014 | * | * | * | — | * | * | — | — | 5 |
| Facchiano et al. | 2013 | * | * | * | * | * | * | * | — | 7 |
| Ippersiel et al. | 2013 | * | * | * | — | * | * | * | * | 7 |
| Luconi et al. | 2013 | * | * | * | — | * | * | * | — | 6 |
| Carretero et al. | 2013 | * | * | * | — | * | * | * | — | 6 |
| Mora et al. | 2013 | * | * | * | — | * | * | * | * | 7 |
| Pellitero et al. | 2012 | * | * | * | — | * | * | — | * | 6 |
| Woodard et al. | 2012 | * | * | * | — | * | * | * | * | 7 |
| Ranasinghe et al. | 2011 | * | * | * | — | * | * | — | * | 6 |
| Hammoud et al. | 2009 | * | * | * | — | * | * | — | * | 6 |
| Alagna et al. | 2006 | * | * | * | — | * | * | * | * | 7 |
| Bastounis et al. | 1998 | * | * | * | — | * | * | * | * | 7 |
| No of studies | ES (95% CI) | Risk of bias | Inconsistency | Indirectness | Imprecision | Publication bias | Quality of evidence | |
|---|---|---|---|---|---|---|---|---|
| TT at 1–3 M | 7 | 5.46 (3.15, 7.77) | Not serious | Serious | Not serious | Not serious | Not serious | Moderate |
| TT at 6–9 M | 22 | 6.58 (5.12, 8.04) | Not serious | Serious | Not serious | Not serious | Not serious | Moderate |
| TT at >12 M | 29 | 8.02 (5.85, 10.18) | Not serious | Serious | Not serious | Not serious | Serious | Low |
| FT at 1–3 M | 4 | 10.80 (−9.62, 31.22) | Not serious | Not serious | Not serious | Serious | Not serious | Moderate |
| FT at 6–9 M | 13 | 65.61 (44.68, 86.55) | Not serious | Not serious | Not serious | Not serious | Serious | Moderate |
| FT at >12 M | 16 | 78.94 (42.82, 115.07) | Not serious | Serious | Not serious | Not serious | Not serious | Moderate |
| E2 at 1–3 M | 7 | 0.15 (−8.56, 8.87) | Not serious | Not serious | Not serious | Serious | Not serious | Moderate |
| E2 at 6–9 M | 16 | −14.52 (−24.63, −4.40) | Not serious | Serious | Not serious | Not serious | Not serious | Moderate |
| E2 at >12 M | 25 | −11.63 (−15.75, −7.51) | Not serious | Not serious | Not serious | Not serious | Not serious | High |
| SHBG at 1–3 M | 6 | 14.56 (7.61, 21.51) | Not serious | Serious | Not serious | Not serious | Not serious | Moderate |
| SHBG at 6–9 M | 18 | 18.08 (12.18, 23.98) | Not serious | Serious | Not serious | Not serious | Not serious | Moderate |
| SHBG at >12 M | 23 | 20.80 (15.70, 25.89) | Not serious | Serious | Not serious | Not serious | Serious | Low |
| PRL | 8 | −76.48 (−126.35, −26.61) | Not serious | Serious | Not serious | Not serious | Not serious | Moderate |
| IIEF | 11 | 9.36 (5.48, 13.24) | Not serious | Serious | Not serious | Not serious | Not serious | Moderate |
Peer Reviews
No public reviews on file for this paper yet. If you reviewed it on a platform where reviews are public (OpenReview, ICLR, NeurIPS, ICML), you can paste yours below so the community can read it here.
Videos
No videos yet. Explain this paper in a talk, walkthrough, or lecture? Add one.
Taxonomy
TopicsHormonal and reproductive studies · Diabetes, Cardiovascular Risks, and Lipoproteins · Ovarian function and disorders
Introduction
1
Obesity is a rapidly growing global epidemic with severe systemic consequences (1). Epidemiological studies estimate that by 2035, over 1.5 billion adults will have obesity, presenting a healthcare challenge (2). Annually, obesity is linked to over 4.72 million deaths worldwide and is a major risk factor for comorbidities including metabolic disease (3). Beyond this, its detrimental impact extends to reproductive health too (4). The pathophysiological hallmarks of obesity such as chronic inflammation and endocrine dysregulation impair reproductive function, contributing to male subfertility and female disorders like PCOS (4–6). Previous studies illustrated profound influence of adiposity on reproductive endocrine health.
Metabolic and bariatric surgery (MBS), primarily through procedures like Roux-en-Y gastric bypass (GB) and sleeve gastrectomy (SG), has become a cornerstone treatment for severe obesity (7). These interventions induce profound weight loss and ameliorate metabolic disorders via mechanisms such as gastric restriction, malabsorption, and altered gut hormone secretion (8, 9). Despite these well-documented systemic benefits, the specific impact of MBS on male reproductive function is an area of ongoing debate (10). While a body of evidence suggests potential benefits including increased serum testosterone, improved semen parameters, and enhanced sexual function, other studies report concerning outcomes, such as postoperative hormonal imbalance, worsening semen quality, and declines in sexual function scores (11, 12).
Given the expanding use of MBS and persistent uncertainties regarding its effects on male reproduction, an updated evidence synthesis is urgently needed. Prior meta-analyses, while indicating potential benefits, are limited by methodological shortcomings and are challenged by newer studies showing variable outcomes dependent on surgical technique and follow-up time. To address this, we conducted a systematic review and meta-analysis of recent evidence to comprehensively evaluate the impact of BS on male reproductive hormones, sexual function, and semen parameters. This work provides a refined evidence base to guide the clinical management of obese men with reproductive dysfunction and to inform relevant public health strategies.
Materials and methods
2
Our meta-analysis was conducted using the Preferred Reporting Items for Systematic Reviews and Meta-Analyses (PRISMA) (13). The study protocol was registered with the International Prospective Register of Systematic Reviews (PROSPERO: CRD420261309015).
Search strategy
2.1
A comprehensive systematic search was conducted through PubMed, Embase, Cochrane Library, and Web of Science databases from inception to July 2024. The systematic search using Medical Subject Headings (MeSH) is as below: “bariatric surgical procedure”, “weight reduction surgery”, “obesity operation,” “gonadal hormones,” “sex hormones”, “gonadal steroid hormones”, “semen quality analyses”, “international index of erectile function (IIEF)”, as well as “seminal plasma analysis”. In addition, hand-searching was done to avoid missing any relevant studies. The search strategy is available in Supplementary Table 1.
Eligibility criteria and extraction process
2.2
The screening process was completed by two investigators independently and any disagreement was discussed. The inclusion criteria were as follow: Participants: participants were obese male patients undergoing MBS; Outcomes: TT, E_2_, FT, luteinizing hormone (LH), follicle-stimulating hormone (FSH), SHBG, prolactin (PRL), sperm concentration (SC), total sperm count (TSC), semen volume (SV), percentages of morphologically normal, total motile sperm, and IIEF-5; Study design: observational cohort studies. While, studies with following criteria were excluded: animal or cellular studies, reviews, grey literature, including: ClinicalTrials.gov, WHO International Clinical Trials Registry Platform (ICTRP), and conference abstracts, study protocols, case reports letters, and incomplete data or serious methodological errors.
Based on eligibility criteria following data were extracted: first author, publication year, location, baseline characteristics of participants, type of MBS, follow-up duration, and reported outcomes.
Quality assessment
2.3
The methodological quality of included studies was assessed using the Newcastle-Ottawa Scale (NOS), which comprises eight items across three domains: selection, comparability, and exposure (14). The NOS yields a score ranging from 0 to 9, with a score of 6 or higher generally indicating high-quality studies, and a score of 5 or lower reflecting lower methodological quality. Following the GRADE approach, we evaluated the certainty of the evidence for each outcome based on five standard domains: risk of bias, inconsistency, indirectness, imprecision, and publication bias.
Statistical analysis
2.4
Statistical analysis was conducted using STATA software, version 18. The relationship between MBS and male reproductive function was evaluated by calculating WMDs alongside their 95% CIs. To quantify heterogeneity across studies, we employed the Cochrane Q test and the I^2^ statistic. Significant heterogeneity was predefined as an I^2^ statistic exceeding 50%. Based on this assessment, a random-effects model was applied when substantial heterogeneity was present; otherwise, a fixed-effects model was used. The robustness of the pooled results was examined through sensitivity analysis. We investigated potential sources of heterogeneity via subgroup analyses, stratified by surgical procedure and duration of follow-up. To explore potential sources of heterogeneity, we performed meta-regression analyses examining the impact of surgical type, follow-up duration, baseline BMI, and study quality (NOS score) as covariates. For outcomes reported in more than 10 studies, publication bias was assessed visually using funnel plots and quantitatively evaluated with Egger’s test, where a p-value <0.05 was considered indicative of significant bias (15).
Results
3
Study selection and characteristics
3.1
The systematic search retrieved 5,417 records. Then, 670 studies were detected as duplicates and were removed. The 4,747 remained studies were screened using title and abstract. Likewise, the remained studies were checked for their eligibility for this study and we assessed their full-text. Finally, 59 studies (comprising 60 study arms) met our inclusion criteria and were included in this study. The study selection flow diagram is provided in the Figure 1.
Flow diagram for selection and screening of studies.
The baseline characteristics of the included studies are presented in the Table 1. This meta-analysis included 2,401 men that were obese and undergone MBS. The study design of most of the included studies (49 studies) were prospective and 11 were retrospective. Included individuals were aged between 16.3 and 65 years. Also, included patients have experienced several type of MBS including Roux-en-Y GB, SG, a combination of GB and SG, and laparoscopic adjustable gastric banding (LAGB). The evaluated outcomes were as follow: TT, FT, E_2_, SHBG, PRL, and IIEF.
MBS and TT and FT
3.2
The included patients were followed in 3-time point including: 1–3, 6–9, and ≥12 months following MBS. Eight studies have reported the TT levels at 1–3 month, 22 at 6–9 month, and 29 at and ≥12 months pre and post MBS.
Analysis revealed a significant increase in serum TT levels following MBS across all post-operative intervals: 1–3 months (WMD: 5.46 nmol/L, 95% CI: 3.15, 7.77; p < 0.001); 6–9 months (WMD: 6.58 nmol/L, 95% CI: 5.12, 8.04, p < 0.001); and ≥12 months (WMD: 8.02 nmol/L, 95% CI: 5.85, 10.18, p < 0.001) (Figures 2A–C). However, subgroup analysis based on type of the surgery showed significant increase in serum TT levels in GB, SG, and GB plus SG across all time points (Table 2). Notably, at 6–9 months, GB-only studies demonstrated highly consistent effects (WMD: 5.82 nmol/L; 95% CI: 4.85–6.78; I^2^ = 0.0%) (Table 2).
Forest plots for the effect of bariatric surgery on TT at (A) 1–3 M, (B) 6–9 M, (C) ≥ 12 M.
While, MBS was associated with non-significant effect in FT at 1–3 months (4 studies, WMD: 10.8 nmol/L, 95% CI: −9.62, 31.22, p = 0.300), and significant increase at 6–9 months (13 studies, WMD: 66.61 nmol/L, 95% CI: 44.68, 86.55, p < 0.001), and ≥12 months (16 studies, WMD: 78.94 nmol/L, 95% CI: 42.82, 115.07, p < 0.001) (Figures 3A–C). In addition, subgroup analysis based on type of surgery revealed that serum FT levels has not been affected following surgery in GB and GB plus SG type at 1–3 months. While, it was increased in all type of surgery at 6–9, and ≥12 months (Table 2). FT effect estimates stratified by surgery type and follow-up duration presented significant increases emerging at 6–9 months across all procedure types including (GB; WMD: 41.05 nmol/L;, 95% CI: 21.42, 60.67, p < 0.001) and (GB + SG; WMD: 86.12 nmol/L;, 95% CI: 56.17, 116.07, p < 0.001) and persisting at ≥12 months (GB + SG; WMD: 86.62 nmol/L;, 95% CI: 49.55, 123.69, p < 0.001).
(A–C) Forest plots for the effect of bariatric surgery on FT at (A) 1–3 M, (B) 6–9 M, (C) ≥ 12 M.
MBS and E2
3.3
The pooled analysis indicated that the serum E_2_ levels was not affected following MBS at 1–3 months (7 studies; WMD: 0.15 pmol/L, 95% CI: −8.56, 8.87, p = 0.973). In contrast, analysis revealed a significant decrease in E_2_ levels at 6–9 months (16 studies; WMD: −14.52 nmol/L, 95% CI: −24.63, −4.40, p = 0.005), and ≥12 months (25 studies; WMD: −11.63 nmol/L; 95% CI: −15.75, −7.51, p < 0.001) (Figures 4A–C). Moreover, subgroup analysis indicated that the type of surgery whether GB or SG did not significantly influence the overall effect on E_2_ levels at 1–3 months. Whereas, based on subgroup analysis GB type showed significant decline in E_2_ levels at 6–9 months (WMD: −14.44 nmol/L; 95% CI: −25.39, −3.50, p < 0.001), nut no effect in GB plus SG type. Importantly, at ≥12 months all surgery types were accompanied with significant reduction in E_2_ levels (Table 2).
Forest plots for the effect of bariatric surgery on E2 at (A–C): (A) 1–3 M, (B) 6–9 M, (C) ≥ 12 M.
MBS and SHBG
3.4
The combined effect of included studies for SHBG value showed elevated levels of SHBG following bariatric surgery across all time points: 1–3 months (6 studies; WMD: 14.56 nmol/L, 95% CI: 7.61, 21.51; p < 0.001); 6–9 months (18 studies; WMD: 18.08 nmol/L, 95% CI: 12.18, 23.98, p < 0.001); and ≥12 months (23 studies; WMD: 23.64 nmol/L, 95% CI: 10.63, 36.65, p < 0.001) (Figures 5A–C). In addition, subgroup analysis indicated that any type of surgery is accompanied with a significant increase in the SHBG levels across all post-operative intervals except for GB plus SG surgery at 1–3 months which failed to show any significant changes in SHBG levels (Table 2).
Forest plots for the effect of bariatric surgery on SHBG at (A) 1–3 M, (B) 6–9 M, (C) ≥ 12 M.
MBS and PRL
3.5
Eight studies have evaluated the PRL levels and pooled analysis demonstrated that PRL levels was decreased (WMD: −76.48 mIU/L, 95% CI: −126.35, −40.0, p = 0.003; I^2^: 88.7%, p < 0.001) (Figure 6). Also, subgroup analysis based on type of surgery showed similar results in each surgery types including SG, and GB plus SG (Table 2).
Forest plots for the effect of bariatric surgery on PRL.
MBS and IIEF score
3.6
Eleven studies have evaluated the semen parameters and reported the IIEF levels. The combined effect of included studies showed that the IIEF score is increased following surgery (WMD: 9.36, 95% CI: 5.48, 13.24, p < 0.001; I^2^: 82.9%, p < 0.001) (Figure 7). Furthermore, subgroup analysis showed that SG, GB plus SG, and LAGB have shown increased level of IIEF score in post-operative state too. While, GB could not reveal significant changes following MBS (Table 2).
Forest plots for the effect of bariatric surgery on IIEF.
Sensitivity analysis and publication bias
3.7
This study employed sensitivity analysis to present robust findings. It has been demonstrated that leave-one-out approach did not show any study to affect the overall results which is a proof of the results robustness.
The publication bias was evaluated using Begg’s test and it has been shown that Begg’s test was >0.05 for all study outcomes across all post-operative intervals except for TT at >12 months (p = 0.002), FT at 6–9 months (p = 0.044), and SHBG at >12 months (p = 0.042). In addition, funnel plots have been provided for visual inspection too (Supplementary Figure 1).
Quality evaluation, meta-regression, and GRADE assessment
3.8
The results of quality assessment of included studies using NOS is provided in Table 3. Most of the included studies were scored ≥6 which offers an acceptable quality for studies. Meta-regression analyses revealed that none of the examined covariates, including surgical type, follow-up duration, baseline BMI, or study quality, significantly explained the observed heterogeneity (p > 0.05 for all).
The quality of evidence has been assessed using GRADE approach (Table 4). Accordingly, E_2_ at >12 M rated as high quality of evidence. However, other study outcomes were considered as moderate or low.
Discussion
4
The adverse effects of obesity on male reproductive function represent a significant and growing global public health concern. MBS has garnered increasing attention for its potential as an effective therapeutic strategy for obesity. In addition, evidence indicates that MBS have beneficial effects on reproductive health outcomes too (16). Accordingly, this meta-analysis synthesizes the available evidence to evaluate the impact of MBS on male sex hormone profiles, semen parameters, and sexual function. Our findings illustrated that MBS leads to significant improvements in the sex hormone status among obese men. However, its effect on semen quality appears to be challenging. The MBS has distinct effects on semen quality based on various surgical techniques and follow-up duration.
Our findings demonstrated that obese men have increased levels of TT and FT across all post-operative intervals. This consistent elevation in circulating androgens offers endocrinological responses to MBS. Obese individuals experience hypogonadotropic hypogonadism which is characterized by reduced testosterone and testicular function (15, 17, 18). Likewise, the MBS is able to reverse this process and exert its beneficial effects on TT and FT levels. Also, mechanistically MBS contribute to reduced adipose tissue which is accompanied with diminished activity of aromatase to converts androgens to estrogens (19, 20).
Despite the consistency in the direction and statistical significance of MBS, there was a statistical significance heterogeneity in pooled estimates for TT and FT. Subgroup analysis at 6–9 months, based on surgical procedure revealed that GB-type surgery was associated with very low heterogeneity (I^2^ = 0.0%) and a significant effect. This finding suggests that a standardized surgical approach, such as GB-type procedures, may lead to a more consistent hormonal response. For FT, heterogeneity measurement is critical too. It has been shown that, at 1–3 months, both GB- and (GB + SG)-type surgery presented low heterogeneity (I^2^ = 0.0%) with non-significant effects. It means that, no heterogeneity could not affect the FT levels in postoperative period and it may need more time to be altered. Furthermore, it was demonstrated that FT levels were significantly affected at 6–9 months and >12 months following GB-type, (GB + SG)-type, and SG-type surgeries, with low heterogeneity observed for each (I^2^ = 0.0%).
A decrease in E_2_ levels is ultimately associated with an increase in testosterone synthesis (21). An increase in testosterone of 8.02 nmol/L (over ≥12 months) is clinically significant, as it is sufficient to move a patient from the hypogonadal range (<8 nmol/L) into the eugonadal range (>12 nmol/L). For erectile function, the 9.36-point improvement in IIEF-5 score substantially exceeds the minimal clinically important difference (MCID) of 4-5 points, indicating a tangible and meaningful improvement for the patient. The 11.63 pmol/L reduction in E_2_ represents a normalization of the hyperestrogenic state typical of male obesity, thereby relieving inhibitory feedback on the HPG axis (22). The 23.64 nmol/L increase in SHBG reflects a resolution of underlying metabolic dysfunction and the normalization of hepatic protein synthesis (23).
Moreover, this surgical intervention was associated with decreased E_2_ levels in obese men at 6–9 months and beyond 12 months of follow-up. This finding constitutes a complementary finding to the abovementioned androgens. Increased circulating estrogens in obesity suppresses LH secretion and strengthens testosterone deficiency (24). Therefore, the decrease in E_2_ after surgery follows the elimination of the inhibitory effect of this signal. In this context, several underlying mechanisms are probable. It has been proposed that reduced availability of aromatase substrates, downregulation of aromatase activity, and altered SHBG may be involved in the reduced level of E_2_ (25–27). Increased levels of TT, FT, and decreased levels of E_2_ simultaneously suggest hypothalamic-pituitary-gonadal (HPG) axis homeostasis (28). Moreover, based on subgroup analysis, all subgroups demonstrated significant E_2_ reductions with low heterogeneity (GB: I^2^ = 39.8%; SG: I^2^ = 0.0%; GB + SG: I^2^ = 28.0%). Over time, heterogeneity decreased and the overall effect became statistically significant across all surgery types.
It is worth noting that SHBG levels are increased in post-operative state in obese men across all time points which is indicating a hallmark endocrinological improvement (29, 30). This finding shares a valuable effect of surgery in obese men. The postoperative increase in SHBG is attributable to several probable mechanisms. Previous studies have introduced the insulin resistance as a characteristic of obesity (31, 32). Whereas, significant reduction in insulin concentrations happens in postoperative state and contribute to improved insulin sensitivity (33, 34). However, the role of improved inflammatory cytokine could not be ignored in this regard (35, 36). Also, it seems that SHBG increase is integrated to observed increase in TT and FT levels androgen recovery, contributing to TT elevation.
The postoperative decline in PRL concentrations signifies the improvement of metabolic disturbance in obese patients. The role of PRL in male reproductive health explain the observed effect (37). The PRL modulates gonadotropin secretion in men (38). Accordingly, MBS is able to restore LH pulsatility and testosterone secretion in male (39, 40).
The recent meta-analysis by Puia et al. (41) shared distinct results in term of TT and SHBG levels in men. In contrast, our study employed a leave-one-out sensitivity analysis, which confirmed that no single study disproportionately influenced the pooled estimates, indicating robust and stable results. Additionally, we applied the GRADE framework to assess certainty of evidence; the findings were downgraded to moderate quality, reflecting methodological rigor and transparency. The discrepancy between our findings and those of Puia et al. may be attributed to several key differences: (i) the smaller number of studies included in the prior meta-analysis, which may have limited statistical power and precision; (ii) heterogeneity in study populations (e.g., baseline testosterone status, age, comorbidities); (iii) variations in surgical techniques; (iv) differences in follow-up duration, as longer-term testosterone changes may not be captured in studies with shorter observation periods; (v) study design; (vi) bile acid and microbiota signalling are affected in malaborptive procedure. Bile acids may suppress gonadotropin secretion, whereas microbiota exert direct spermatotoxic effects; (vii) nutritional deficiencies and malabsorption. Postoperative micronutrient deficiencies (specifically zinc, selenium, vitamin B12, and vitamin D) are associated with impaired spermatogenesis. Previous studies that did not report postoperative micronutrient status, this could explain more different results. These factors collectively underscore the importance of updated evidence synthesis with rigorous sensitivity and certainty assessments.
Accordingly, careful interpretation of reproductive outcomes following MBS must account for the potential role of micronutrient deficiencies. Patients undergoing GB-type procedures are at greater risk for such deficiencies compared to those undergoing SG. Several micronutrients are known to play critical roles in male reproductive function. Zinc is essential for spermatogenesis and testosterone synthesis (42). Selenium supports the antioxidant defense system and contributes to the maintenance of male reproductive health (43). Folate and vitamin B12 are involved in methylation processes, and deficiencies in these nutrients can lead to impaired spermatogenesis and increased sperm DNA fragmentation (44). Vitamin D deficiency has also been associated with impaired reproductive function, while vitamin E exerts protective effects through the prevention of oxidative damage (45, 46). Importantly, even with apparently adequate intake, deficiencies in key micronutrients such as copper, zinc, and vitamin D may develop over time. This observation underscores the importance of active, routine monitoring rather than passive supplementation alone. Individualized treatment approaches with follow-up at 3–6 month intervals may optimize reproductive outcomes. Therefore, periodic monitoring of predefined micronutrient status is strongly recommended in male patients following MBS.
Despite the important findings post-MBS, sustained weight loss and reproductive improvements are critical. A systematic review stated that 76% of SG patients had experienced significant weight regain at 6 year follow-up (47). Similarly, another meta-analysis declared overally, 49% weight regain for post-MBS and 42% weight regain for post-GB specifically (48). In this context, the Pham et al.’s (49) trial demonstrated that, FT and TT increment was persistent at 5 years. However, these improvements are guaranteed with sustained weight management in patients (49). While, Dhindsa et al.’s (50) study indicated that patients who had reported weight regain had a decrease in TT levels. Evidence supports that hormonal parameters do not revert to baseline when weight loss is sustained (50).
This study has some limitations too. First, high heterogeneity limits the generalizability of the findings. Second, the publication bias for TT at >12 months, FT at 6–9 months, and SHBG at >12 months affects the observed finding. Third, there was limited data in term of adverse effects such as micronutrient deficiency and their interaction with reproductive health. The influence of surgical type should not be overlooked. SG appears to exert a more consistent effect on SG than GB, possibly owing to the latter’s association with the malabsorption of key micronutrients such as zinc and selenium (51). The primary studies included in this meta-analysis provided limited and inconsistently reported data on micronutrient malabsorption. Consequently, we were unable to perform quantitative synthesis or subgroup analyses to assess the direct effect of specific nutrient deficiencies on study outcomes. Forth, lack of data on functional fertility endpoints (sperm DNA fragmentation, live birth rates). Fifth, the included studies span multiple WHO classification editions (4th, 5th, and 6th), which employ different reference values and methodologies. The pooled results may therefore be influenced by unrecognized differences in outcome classification across studies, and should be interpreted with caution.
Conclusion
5
The present meta-analysis provides a comprehensive and integrated synthesis of the available evidence examining the impact of MBS on male reproductive health. Our findings demonstrated that MBS is able to induce an increase on the levels of androgens including TT at all-time points and FT at 6–9, and >12 months follow-up duration. Moreover, it exerts favorable effects on E_2_ (at 6–9 and >12 months follow-up duration), PRL and IIEF score. In addition, SHBG level was affected following MBS significantly in obese men. However, there are many gaps which needs to shift from heterogeneous, underpowered retrospective studies that gather reproductive, nutritional, and metabolic signatures.
The reference list from the paper itself. Each links out to its DOI / PubMed record.
- 1Finer N. Medical consequences of obesity. Medicine. (2015) 43:88–93. doi: 10.1016/j.mpmed.2014.11.003 · doi ↗
- 2Ahmed SK Mohammed RA. Obesity: prevalence, causes, consequences, management, preventive strategies and future research directions. Metabol Open. (2025) 27:100375. doi: 10.1016/j.metop.2025.100375, 41041606 PMC 12486175 · doi ↗ · pubmed ↗
- 3Mohajan D Mohajan HK. Obesity and its related diseases: a new escalating alarming in global health. J Innov Med Res. (2023) 2:12–23. doi: 10.56397/jimr/2023.03.04 · doi ↗
- 4Schon SB Cabre HE Redman LM. The impact of obesity on reproductive health and metabolism in reproductive-age females. Fertil Steril. (2024) 122:194–203. doi: 10.1016/j.fertnstert.2024.04.036, 38704081 PMC 11527540 · doi ↗ · pubmed ↗
- 5Barbouni K Jotautis V Metallinou D Diamanti A Orovou E LiepinaitienėA . When weight matters: how obesity impacts reproductive health and pregnancy-a systematic review. Curr Obes Rep. (2025) 14:37. doi: 10.1007/s 13679-025-00629-9, 40238039 PMC 12003489 · doi ↗ · pubmed ↗
- 6Kang Y Li P Yuan S Fu S Zhang X Zhang J . Progress in investigating the impact of obesity on male reproductive function. Biomedicines. (2025) 13:2054. doi: 10.3390/biomedicines 13092054, 41007618 PMC 12467420 · doi ↗ · pubmed ↗
- 7Chacon D Bernardino T Geraghty F Rodriguez AC Fiani B Chadhaury A . Bariatric surgery with Roux-en-Y gastric bypass or sleeve gastrectomy for treatment of obesity and comorbidities: current evidence and practice. Cureus. (2022) 14:e 25762. doi: 10.7759/cureus.25762, 35812610 PMC 9270090 · doi ↗ · pubmed ↗
- 8Cordero P Li J Oben J. Bariatric surgery as a treatment for metabolic syndrome. J R Coll Physicians Edinb. (2017) 47:364–8. doi: 10.4997/JRCPE.2017.414, 29537411 · doi ↗ · pubmed ↗