Accuracy of AI-Based Nutrient Estimation from Standardized Hospital Meal Images: A Comparison with Registered Dietitians
Tomomi Isobe, Lim Wan Zhang, Hana Murakami, Miyu Kadono, Megumi Aso, Atsuko Kayashita, Jun Kayashita

TL;DR
AI models like ChatGPT-4o and Gemini 1.5 Pro can accurately estimate calories and carbs from hospital meal images but overestimate fats, suggesting the need for human oversight and better data.
Contribution
This study rigorously compares AI and dietitians in estimating nutrients from standardized meal images, revealing AI's overestimation of lipids.
Findings
AI models and dietitians showed high accuracy for energy and carbohydrates (r > 0.8, ±10% range).
AI models systematically overestimated lipids by more than 20%.
Protein estimation accuracy was significantly lower for all AI models.
Abstract
Background: Accurate dietary assessment is vital for preventing malnutrition in aging populations, particularly in home-care settings. Although Large Multimodal Models (LMMs) for nutrient estimation are evolving, their nutrient-specific accuracy requires rigorous validation. Methods: Fifteen standardized hospital meals were photographed under controlled conditions (90-degree angle, 500 lux). Ground truth values were determined by direct weighing. Estimates for energy and macronutrients were performed by 10 registered dietitians (RDs) and 10 AI models (including ChatGPT-4o and Gemini 1.5 Pro). Accuracy was assessed using Pearson’s correlation, Mean Absolute Error (MAE), and Bland–Altman analysis to quantify systematic bias. Results: For energy and carbohydrates, RDs and top-performing AI models (notably ChatGPT-4o and Gemini 1.5 Pro) demonstrated practical accuracy (r > 0.8, frequently…
Genes, proteins, chemicals, diseases, species, mutations and cell lines named across the full text — each resolved to its canonical identifier and authoritative record.
Click any figure to enlarge with its caption.
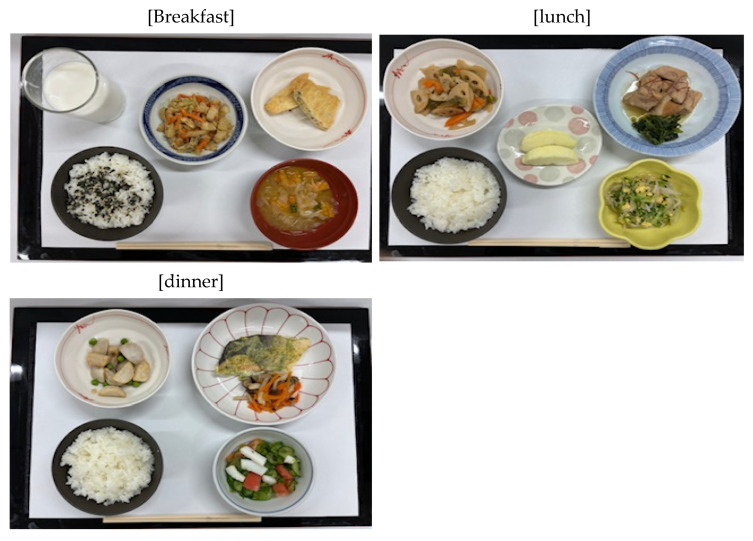 Figure 1
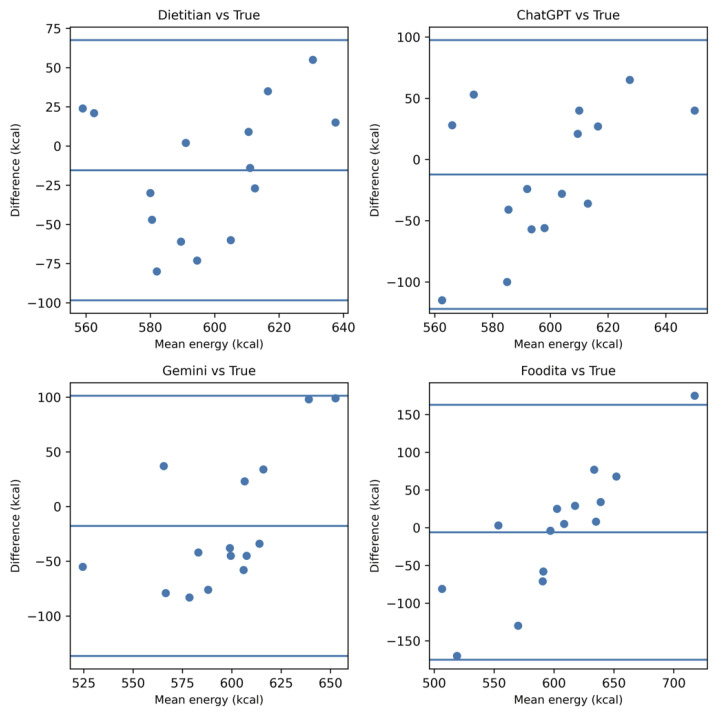 Figure 2
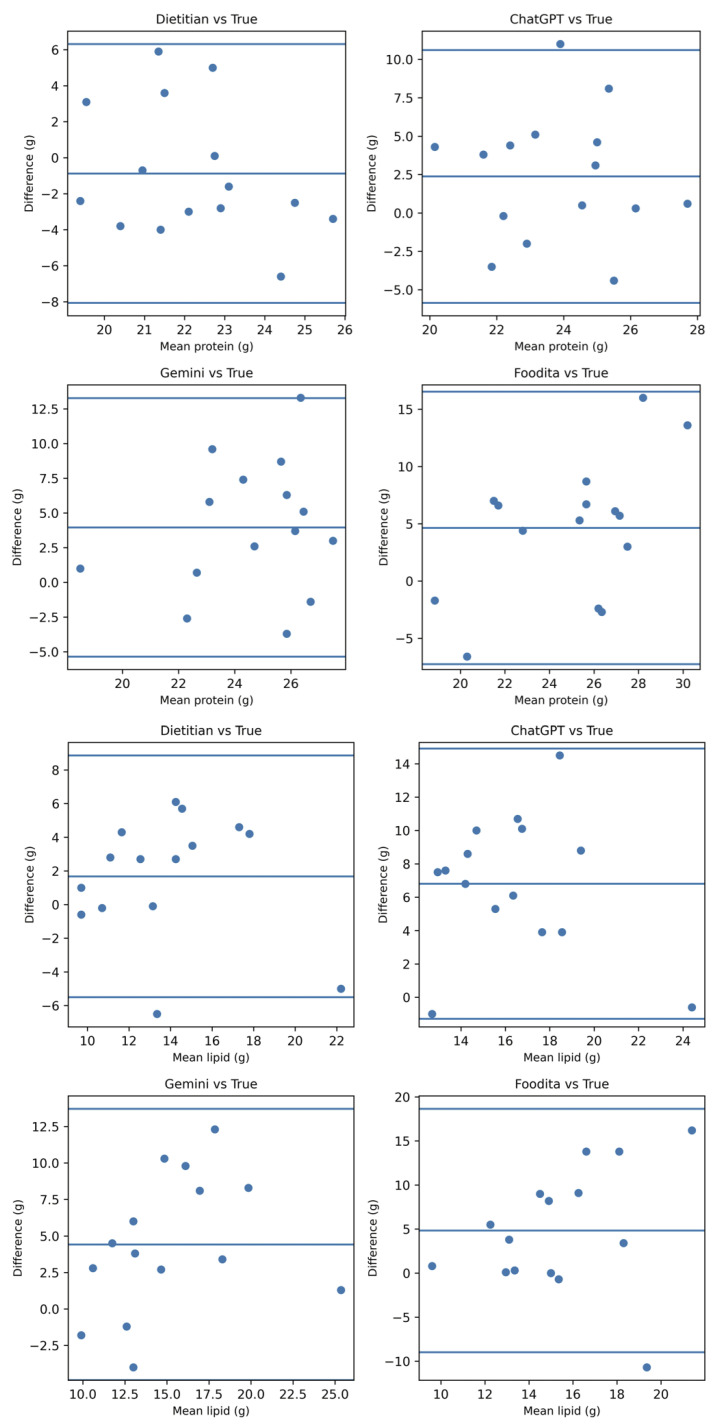 Figure 3
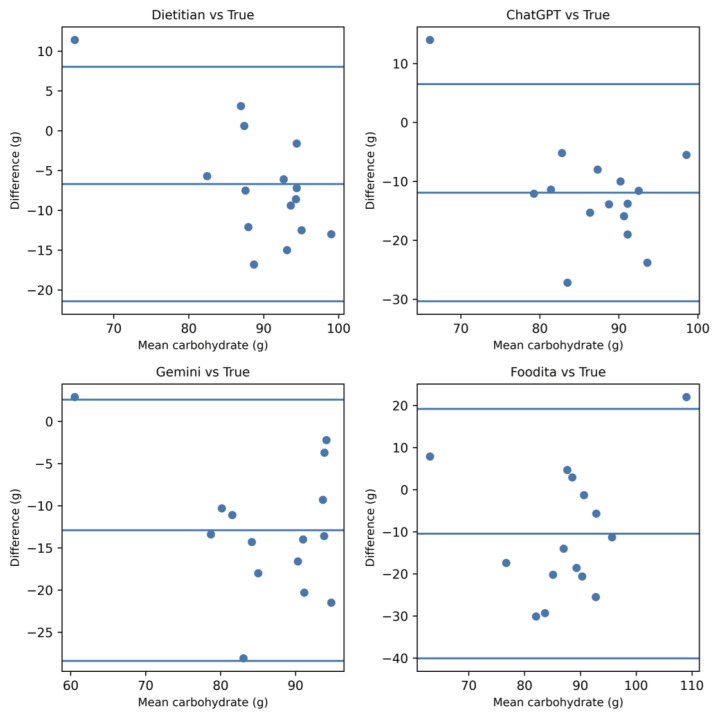 Figure 4
Peer Reviews
No public reviews on file for this paper yet. If you reviewed it on a platform where reviews are public (OpenReview, ICLR, NeurIPS, ICML), you can paste yours below so the community can read it here.
Videos
No videos yet. Explain this paper in a talk, walkthrough, or lecture? Add one.
Taxonomy
TopicsNutrition and Health in Aging · Nutritional Studies and Diet · Body Composition Measurement Techniques
1. Introduction
The progression of aging in Japan has made malnutrition among community-dwelling and home-care older adults a critical public health challenge [1,2,3]. By 2026, the elderly population in Japan is projected to reach approximately 30%, intensifying the shift in medical care from hospitals to home-care settings [1]. Recent meta-analyses from 2025 indicate that the global prevalence of malnutrition in older adults remains high, at approximately 18% [4]. In community-dwelling older adults, age-related functional decline, chronic diseases, and social factors often converge, leading to a significant proportion of individuals suffering from malnutrition or being at high risk [4,5,6,7]. Similar trends have been observed among patients receiving home care, where nutritional management is often fragmented [5,6]. Since malnutrition is directly associated with physical decline and poor clinical outcomes, such as increased mortality and morbidity [6,8], continuous and accurate nutritional assessment outside of hospital environments is urgently required.
Although countermeasures for malnutrition in the elderly are highly recommended, they are often insufficiently implemented in clinical practice [9]. In many clinical settings, screening tools like the Mini Nutritional Assessment-Short Form (MNA-SF) are utilized; however, their agreement with the Global Leadership Initiative on Malnutrition (GLIM) criteria is not always sufficient, which may lead to an underestimation of nutritional risk [10]. While nutritional interventions, including oral nutritional supplements (ONS), are effective in improving status and function [9,11], accurately evaluating actual dietary intake remains a significant hurdle. Traditional dietary records or 24 h recalls impose a substantial burden on both patients and caregivers, leading to potential inaccuracies in reporting and low compliance [11,12]. Therefore, a low-burden, objective, and automated method for capturing dietary intake is necessary to bridge this gap.
Recently, artificial intelligence (AI) technology for nutritional assessment via food images has advanced rapidly [13]. The integration of advanced image recognition and 2026-generation large multimodal models (LMMs) has enabled automated food identification and nutrient estimation, showing high feasibility for digital nutritional interventions even among older populations [14]. However, previous studies have reported that these methods are prone to systematic errors arising from meal complexity and nutrient characteristics. While visually prominent components, such as staple foods (carbohydrates) whose volume is easily captured by computer vision, are estimated with relative accuracy, the precision tends to decrease for fats, oils, seasonings, and mixed dishes [15,16]. Evaluations across multiple models have shown significant variability and a tendency for overestimation in certain contexts [17], emphasizing the need for expert oversight even when agreement rates are high [18]. Moreover, the nutritional adequacy of AI-generated diet plans remains a challenge [19], as do the ethical and practical considerations of AI implementation in clinical nutrition practice [20]. Particularly for older adults, maintaining precise nutrient intake is crucial for preventing sarcopenia and maintaining physical function [21].
Based on these findings, it is expected that AI-based nutritional estimation accuracy depends heavily on specific nutrient characteristics and the visibility of the food matrix. However, research directly comparing multiple 2026-generation AI models with professional registered dietitians (RDs) using standardized meals—where “ground truth” is precisely known—remains limited.
Our hypothesis is that AI-based nutritional estimation will demonstrate high agreement with ground truth for energy and carbohydrates due to their volumetric visibility, whereas the agreement will significantly decrease for proteins and lipids due to the inherent difficulty of visual-only density estimation and the “invisible” nature of cooking oils. Therefore, the objective of this study was to compare the nutrient estimations of 10 different AI models and experienced RDs using photographs of standardized hospital meals to verify nutrient-specific accuracy characteristics and define the current limitations of digital assessment tools in clinical settings.
2. Materials and Methods
2.1. Meal Samples and Ground Truth
Fifteen standardized hospital meals, comprising breakfast, lunch, and dinner over five non-consecutive days, were selected for this study. These meals were designed to represent a standard 1800 kcal/day diet (approximately 600 kcal per meal) commonly prescribed in Japanese hospital settings. The “ground truth” nutritional values for each meal (total energy, protein, lipids, and carbohydrates) were determined by direct weighing of all ingredients after cooking, based on the Standard Tables of Food Composition in Japan (8th Revised Edition).
2.2. Image Acquisition
Meal photographs were captured under standardized conditions to minimize confounding variables. Each meal was photographed using a smartphone camera (iPhone 15, Apple Inc., Cupertino, CA, USA) at a vertical (90-degree) angle. Lighting was maintained at a consistent intensity, and the distance between the camera and the meal was fixed at 50 cm. While these controlled conditions ensure high internal validity for comparing AI models, they represent a baseline “best-case scenario” for visual estimation.
2.3. Participants (Registered Dietitians)
Ten registered dietitians (RDs) with more than 5 years of clinical experience in hospital nutrition management participated in the study. Each RD independently estimated the nutrient content of the 15 meals based solely on the photographs provided. No additional textual information regarding the menu or portion sizes was provided to the RDs during the estimation process.
2.4. AI Models and Prompts
Ten different AI models and applications available as of early 2026 were evaluated. These included three Large Multimodal Models (LMMs)—ChatGPT-4o (OpenAI), Gemini 1.5 Pro (Google), and Claude 3.5 Sonnet (Anthropic)—alongside seven specialized dietary assessment applications: Foodita, Gemini 1.5 Flash, Calomil, Asken, FiNC, OWN, and CALO mama Plus.
For the three LMMs, a standardized Japanese prompt was used to ensure consistency across the models. The prompt instructed the AI to “estimate the energy, protein, lipid, and carbohydrate content from the provided meal image and provide specific numerical values.” These models were used in “image-only” mode, meaning no additional textual information, such as dish names or specific ingredients, was provided to influence the AI’s inference.
2.5. Screening and Selection Criteria
To provide a focused and clinically relevant analysis, the 10 models underwent an initial screening based on their performance in energy estimation. Three “top-performing” models were selected for detailed macronutrient analysis (Bland–Altman and systematic bias assessment). The selection criteria were: (1) Pearson’s correlation coefficient r > 0.80, (2) Mean Absolute Error (MAE) < 50 kcal, and (3) a hit rate (within ±10% of ground truth) > 50%. The performance metrics for the remaining models are reported in the Supplementary Materials (Table S1).
2.6. Statistical Analysis
Statistical analysis was performed using SPSS version 28.0 and the free statistical software EZR (Easy R) version 1.60. Continuous variables are presented as Mean ± Standard Deviation (SD). Accuracy was assessed using:
- Pearson’s Correlation Coefficient (r) to evaluate the linear association between estimations and ground truth.
- Mean Absolute Error (MAE) and Mean Bias (%) to quantify the magnitude and direction of estimation errors.
- Bland–Altman Analysis to identify systematic bias and calculate the 95% limits of agreement (LoA).
- Paired t-tests to determine if the mean difference between the estimated values and the ground truth was statistically significant. A p-value < 0.05 was considered statistically significant.
2.7. Ethical Considerations
This study was approved by the Institutional Review Board of Itsukaichi Memorial Hospital (Approval No. 26-2). All meal photographs were anonymized, and no personal data from patients were used. The involvement of RDs was voluntary, and their data were processed anonymously. The AI models were used as technical tools for performance validation, and their use did not involve clinical decision-making for human subjects during the study period (Table 1 and Figure 1).
3. Results
3.1. Screening of AI Models and Identification of Top Performers
The initial evaluation of 10 AI models revealed a significant disparity in nutrient estimation performance. Pearson’s correlation coefficients (r) for total energy ranged from 0.21 to 0.89. Based on the predefined screening criteria (Section 2.5), three models were identified as “Top Performers”: ChatGPT-4o, Gemini 1.5 Pro, and Foodita. These models consistently achieved r > 0.80, energy MAE < 50 kcal, and a hit rate within ±10% exceeding 50%. Detailed performance metrics for all 10 evaluated models, including the middle and lower groups, are provided in the Supplementary Materials (Table S1). Subsequent detailed analyses focus on these top three models in comparison with the Registered Dietitian (RD) group.
3.2. Comparative Accuracy of Top AI Models and RDs
The nutrient-specific estimation results for the RD group and the top three AI models are summarized in Table 2.
Energy and Carbohydrates: For total energy and carbohydrates, both the RDs and the top three AI models demonstrated high accuracy. No statistically significant differences were observed between their estimations and the ground truth (p > 0.05). The Mean Bias (%) for energy was minimal, ranging from −1.0% to −2.9%, which was comparable to the RD group’s performance (−0.8%).Protein and Lipids: In contrast, significant discrepancies were observed for protein and lipids. While the RD group maintained high accuracy (Bias < 5%), the AI models showed a clear tendency toward overestimation. For protein, ChatGPT-4o and Gemini 1.5 Pro showed a significant overestimation (p < 0.05). The most substantial errors occurred in lipid estimation, where all three top AI models exhibited a massive systematic overestimation, with Mean Bias (%) ranging from +23.6% to +30.4% (p < 0.01).
3.3. Systematic Bias Analysis (Bland–Altman Analysis)
Bland–Altman plots were generated to visualize the agreement between ground truth and estimations for the top three models and the RD group (Figure 2).
For energy and carbohydrates, the mean bias remained near zero with relatively narrow 95% limits of agreement (LoA), indicating high reliability. However, for lipid estimation, the plots clearly illustrated a significant positive systematic bias across all AI models. The LoA for lipids were considerably wider than those for other nutrients, confirming that the magnitude of error increases with meal complexity (e.g., hidden oils), even among the most advanced models.
3.4. Within ±10% Accuracy Rates
The proportion of estimations falling within ±10% of the ground truth for energy followed the same hierarchy as the screening: ChatGPT-4o (73.3%), Gemini 1.5 Pro (60.0%), and Foodita (53.3%). In contrast, for lipid estimation, the ±10% accuracy rate dropped significantly (below 20% for all models), further reinforcing the nutrient-specific limitations of image-based AI analysis.
4. Discussion
The present study demonstrated that AI-based nutrient estimation from meal photographs provides a high level of accuracy comparable to that of registered dietitians (RDs) for standardized hospital meals. This aligns with recent advancements in deep learning algorithms that have shown increasing proficiency in food image recognition and volume estimation [22,23]. Our findings suggest that AI technology can be a reliable and efficient tool for nutritional monitoring in clinical settings, potentially transforming traditional dietary assessment methods.
4.1. Comparison with Registered Dietitians and Previous AI Research
The high correlation between AI estimations and RD assessments for energy and macronutrients indicates that the AI algorithm has achieved a level of proficiency suitable for clinical use. Previous studies have highlighted the challenges of image-based estimation in non-standardized environments, such as restaurants or home settings, where varied portion sizes and ingredients often lead to higher error rates [24]. However, in the controlled environment of standardized hospital meals, the AI was able to leverage consistent plating and ingredient profiles, resulting in the high precision observed in our results. This indicates that while general-purpose AI may still face hurdles, specialized clinical applications are already reaching a stage of practical utility, particularly as a means to address the high global prevalence of malnutrition in older adults [25]. Despite this overall proficiency, a notable discrepancy was observed in lipid estimation. This systematic overestimation of lipids by AI models may stem from the models’ inability to distinguish between the visual presence of oil and the actual absorbed amount, or a tendency to default to standard recipe values that assume higher fat content than those used in standardized hospital meals. This “invisible nutrient” bias represents a critical technical hurdle that differentiates AI from experienced RDs, who can adjust their estimations based on clinical knowledge of hospital-specific preparation methods.
4.2. Clinical Implications and Digital Health Integration
Implementing AI-based dietary assessment in hospitals could significantly reduce the administrative burden on healthcare professionals. The integration of mobile-based dietary record apps has been shown to improve patient compliance and the accuracy of longitudinal data collection compared to traditional paper-based methods [26]. By automating the routine task of calculating energy and nutrient intake from leftovers, RDs can transition from data entry to high-level clinical interventions, such as personalized nutrition counseling and medical nutrition therapy.
4.3. Limitations and Future Perspectives
Despite the promising results, certain limitations remain. The AI’s performance may vary under different lighting conditions or camera angles, which are common variables in real-world clinical environments. Furthermore, while the accuracy for standardized meals is high, further validation is required for modified-texture diets (e.g., minced or pureed meals) common in geriatric care. Future research should focus on refining the algorithm to handle these specific food forms and integrating AI with electronic medical records (EMR) for seamless nutritional management.
5. Conclusions
In conclusion, the AI-based system evaluated in this study offers a precise and labor-saving alternative for nutrient estimation in standardized hospital settings. Supported by the growing body of evidence regarding deep learning in nutritional informatics [22,23,24,25,26], this technology is poised to become an indispensable component of digital health, ensuring accurate and efficient nutritional management for hospitalized patients, especially in the context of global aging and the increasing risk of malnutrition.
The reference list from the paper itself. Each links out to its DOI / PubMed record.
- 1Atwater W.O. Bryant A.P. The Availability and Fuel Value of Food Materials U.S. Department of Agriculture, Office of Experiment Stations Bulletin Washington, DC, USA 1900 Volume 85
- 2Widdowson E.M. Mc Cance R.A. The Nutritive Value of Fruits, Vegetables and Nuts Medical Research Council Special Report Series No. 213HMSO London, UK 1936
- 3Beaton G.H. Milner J. Corey P. Mc Guire V. Cousins M. Stewart E. de Ramos M. Hewitt D. Grambsch P.V. Kassim N. Sources of variance in 24-h dietary recall data: Implications for nutrition study design and interpretation Am. J. Clin. Nutr.1979322546255910.1093/ajcn/32.12.2546506977 · doi ↗ · pubmed ↗
- 4Willett W. Nutritional Epidemiology 3rd ed.Oxford University Press New York, NY, USA 2012
- 5Subar A.F. Kipnis V. Troiano R.P. Midthune D. Schoeller D.A. Bingham S. Sharbaugh C. Trabulsi J. Runswick S. Ballard-Barbash R. Using intake biomarkers to evaluate the extent of dietary misreporting J. Am. Diet. Assoc.20031031002100710.1093/aje/kwg 09212835280 · doi ↗ · pubmed ↗
- 6Livingstone M.B.E. Black A.E. Markers of the validity of reported energy intake J. Nutr.2003133895 S 920S 10.1093/jn/133.3.895S 12612176 · doi ↗ · pubmed ↗
- 7Shim J.S. Oh K. Kim H.C. Dietary assessment methods in epidemiologic studies Epidemiol. Health 201436 e 201400910.4178/epih/e 201400925078382 PMC 4154347 · doi ↗ · pubmed ↗
- 8Dhurandhar N.V. Schoeller D. Brown A.W. Heymsfield S.B. Thomas D. Sorensen T.I.A. Speakman J.R. Jeansonne M. Allison D.B. Energy balance measurement: When something is not better than nothing Int. J. Obes.2015391109111310.1038/ijo.2014.19925394308 PMC 4430460 · doi ↗ · pubmed ↗