Underlying Mechanisms for Growth Promotion by Low-Concentration Single Salt and Alkali Stresses and Growth Inhibition by Combined Salt-Alkali Stress in Quercus mongolica
Fan Huang, Xinrui Wu, Laixue Zou, Te Li, Tongbao Qu

TL;DR
This study explores how low salt or alkali stress can promote growth in Quercus mongolica, but combined stress inhibits it, revealing mechanisms related to soil and microbial responses.
Contribution
The study identifies specific soil and microbial mechanisms that explain growth promotion under single stress and inhibition under combined salt-alkali stress in Quercus mongolica.
Findings
Low-concentration single salt or alkali stress promotes Quercus mongolica seedling growth.
Combined salt-alkali stress disrupts microbial networks and reduces soil enzyme activities, inhibiting growth.
Microbial responses enhance network cooperation and stability under individual stress conditions.
Abstract
Soil salinization is a global ecological issue that severely constrains forest tree growth and ecological restoration. The salt-alkali stress response mechanisms of Quercus mongolica, a key temperate forest species in China, remain unclear. A two-factor pot experiment was conducted using NaCl (0, 50, 100, 200 mmol·L−1) and NaHCO3:Na2CO3 (1:1; 0, 50, 100, 150 mmol·L−1). Plant traits, soil properties, and enzyme activities were measured. Furthermore, high-throughput sequencing revealed that microbial responses enhanced network cooperation under 100 mmol·L−1 salt stress and improved network stability under 50 mmol·L−1 alkali stress. These responses also upregulated resistance genes and increased soil enzyme activities. This activation of seedling antioxidant and osmotic adjustment systems was directly associated with an increase in growth parameters. Under combined stress, however, soil…
Genes, proteins, chemicals, diseases, species, mutations and cell lines named across the full text — each resolved to its canonical identifier and authoritative record.
Click any figure to enlarge with its caption.
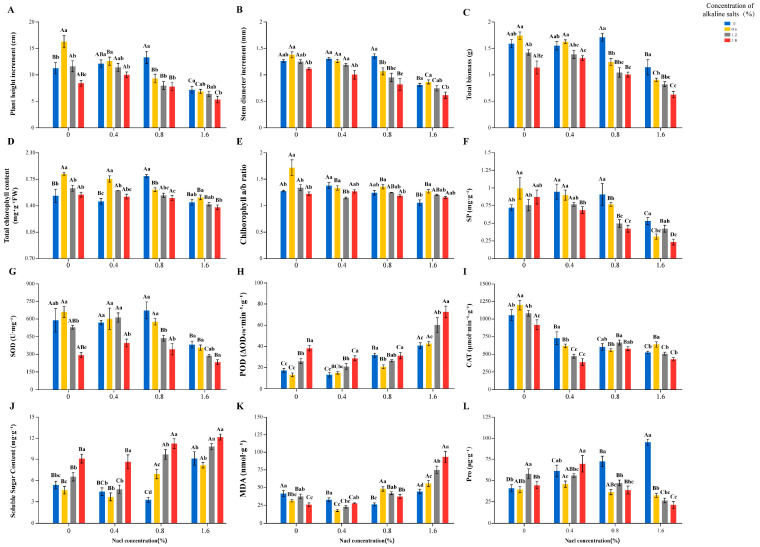 Figure 1
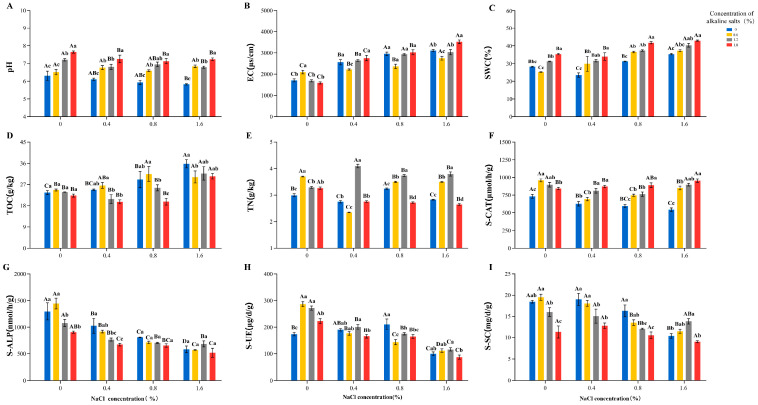 Figure 2
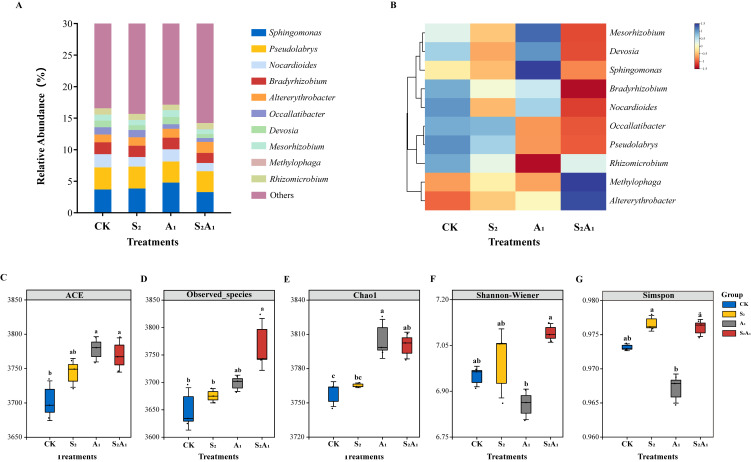 Figure 3
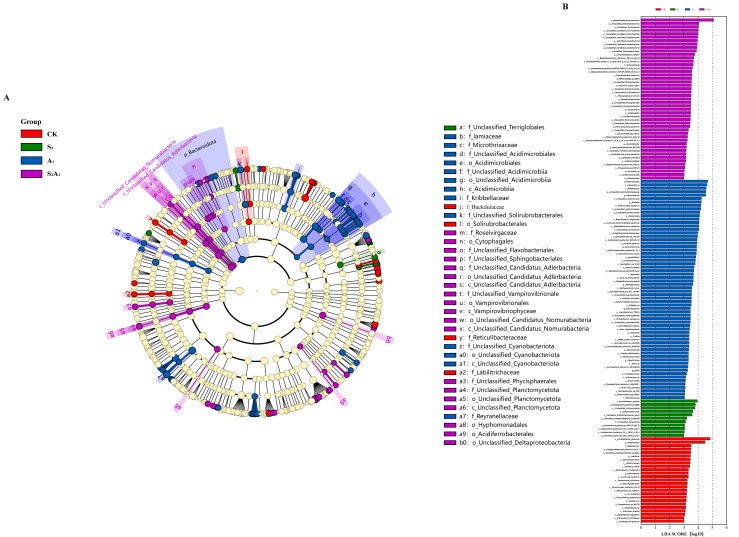 Figure 4
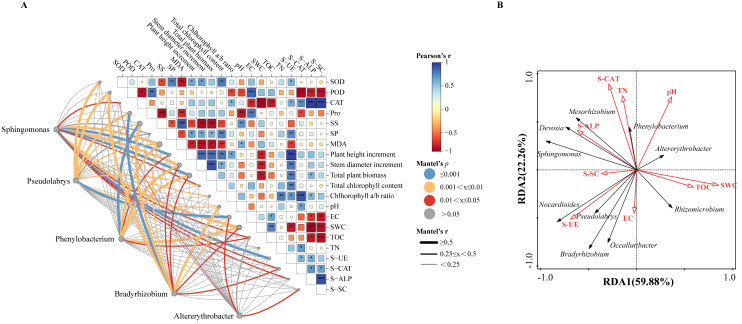 Figure 5
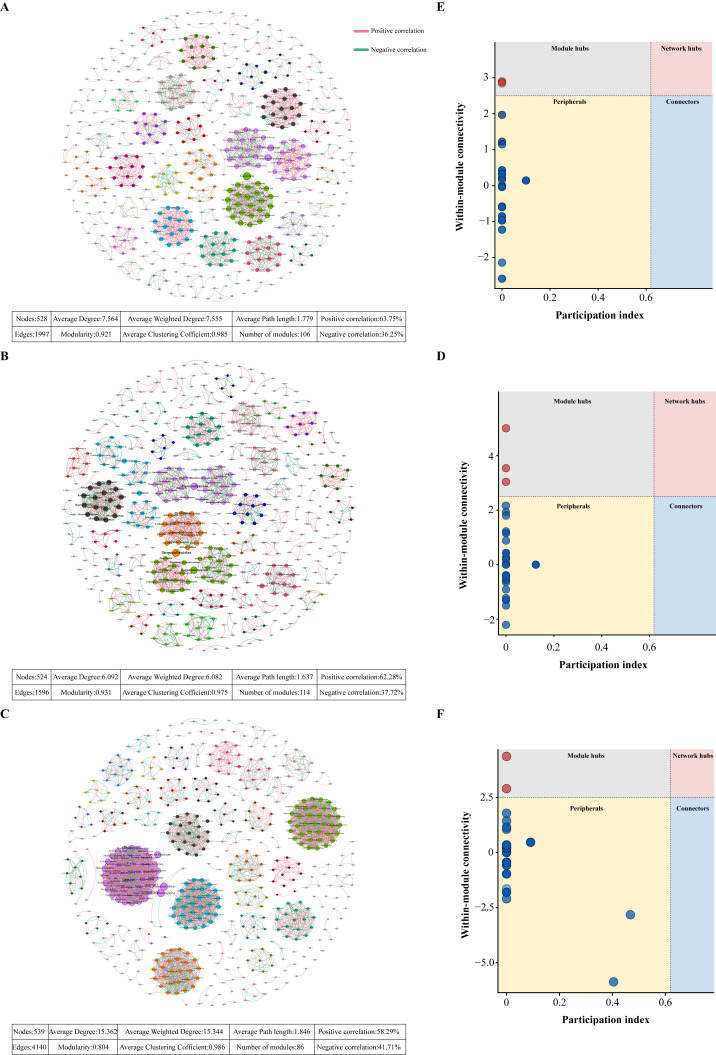 Figure 6
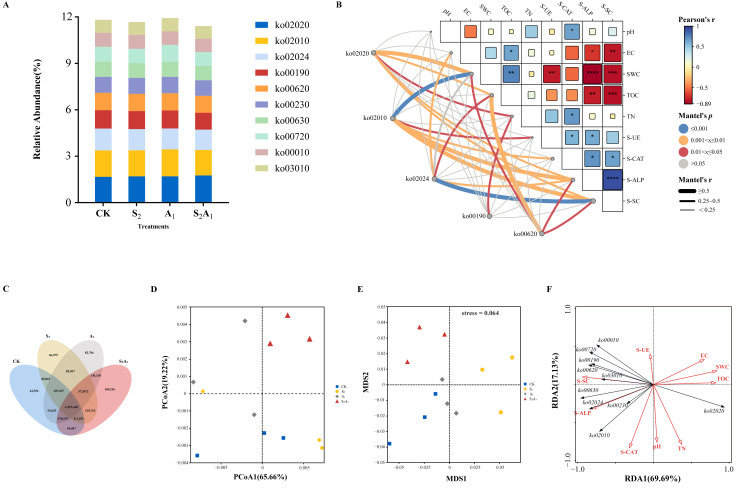 Figure 7
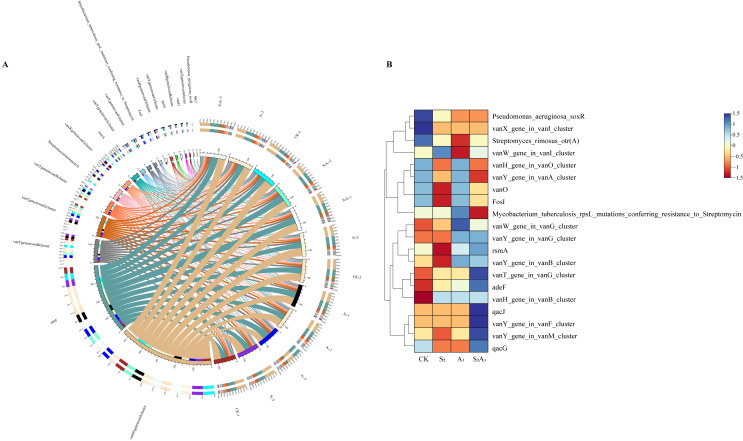 Figure 8
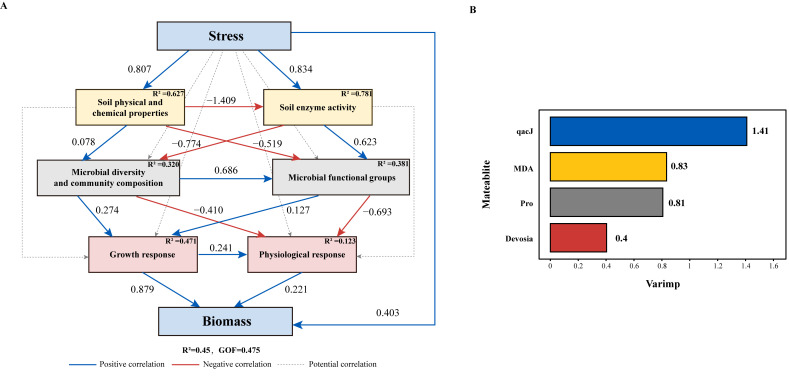 Figure 9
- —Jilin Provincial Science and Technology Department Project
Peer Reviews
No public reviews on file for this paper yet. If you reviewed it on a platform where reviews are public (OpenReview, ICLR, NeurIPS, ICML), you can paste yours below so the community can read it here.
Videos
No videos yet. Explain this paper in a talk, walkthrough, or lecture? Add one.
Taxonomy
TopicsPlant Stress Responses and Tolerance · Aluminum toxicity and tolerance in plants and animals · Smart Materials for Construction
1. Introduction
Soil salinization is a global ecological issue [1,2], with over 1.381 billion hectares of saline-alkali land worldwide expanding annually by 1% to 2% [3]. Soil salinization impairs the physiological functions of forest trees through ionic toxicity, osmotic stress, and nutrient immobilization [4], thereby inducing photosynthetic inhibition, membrane damage, and growth retardation [5], and ultimately markedly compromising the capacity for seedling establishment and survival [6]. In the face of this ecological challenge, investigating plant responses to saline-alkaline stress has become a major research focus.
Single salt stress, such as NaCl, can significantly reduce stem diameter and plant height in Lagenaria siceraria, as well as decrease seedling biomass in Triticum aestivum and Gossypium hirsutum [7,8,9]. It generally induces a decline in photosynthetic performance, reduction in chlorophyll content, and aggravation of membrane lipid peroxidation in leaves [10,11]. Concurrently, levels of stress-related substances, such as antioxidant enzyme activity, proline (Pro), and abscisic acid, are observed to increase markedly in plants [12,13,14]. Certain species, such as Viola tricolor, may exhibit transient growth promotion under low salt concentrations, but this shifts to inhibition as stress intensifies [15]. Ultimately, the suppression of morphological development and disruption of physiological metabolism contribute to significant growth inhibition in plants. Compared to salt stress, alkaline stress imposes a dual pressure of high pH and high Na^+^, typically exerting stronger inhibitory effects on plants [16]. For instance, it significantly suppresses the growth and root development of T. aestivum seedlings and various Avena sativa cultivars and interferes with the absorption and translocation of mineral elements, such as phosphorus and sulfur, in G. hirsutum [17,18,19]. Alkaline stress also elevates antioxidant enzyme activities and Malondialdehyde (MDA) content in the leaves of plants such as Prunus humilis and Trachyspermum ammi. In contrast, species such as Hordeum jubatum and Leymus chinensis exhibit increases in chlorophyll content and antioxidant enzyme activities, or alterations in nitrogen metabolite accumulation and soluble sugar (SS) content, respectively [20,21,22,23]. These complex and divergent responses highlight the distinctive impact of alkaline stress. However, in natural habitats, soil salinization and alkalization processes frequently co-occur, imposing more complex combined salt-alkali stress on plants; however, studies on such combined stress remain limited [24,25].
Currently, elucidating the rhizosphere microbe-mediated adaptation processes is a key step in deciphering plant response mechanisms under salt-alkali stress [26,27]. This salt-alkali stress alters the physicochemical properties of rhizosphere soil, such as pH and nutrient availability, creating a distinct microenvironment for microorganisms [28]. This subsequently induces significant shifts in the structure and function of the microbial community [22,29], which in turn affects the activity of key soil enzymes [30,31,32]. This microbe-mediated rhizosphere process ultimately influences key physiological states of plants, such as photosynthetic performance [33], antioxidant systems, and biomass allocation [34], by modulating their nutrient and water uptake [35]. However, current research following the pathway of salt-alkali stress, the rhizosphere microbiome, and plant responses has primarily focused on herbaceous species [27]. Related investigations in woody plants remain relatively limited [36], with existing studies largely concentrating on physiological responses and molecular regulatory mechanisms under single salt stress [37]. Systematic comparative studies examining how salt stress, alkaline stress, and their combination differentially affect the multidimensional system of plant physiology, rhizosphere soil, and microbe interactions are still lacking.
Quercus mongolica is an important tree species with both ecological and economic value in northern forest regions [38]. Current research primarily focuses on its genetic breeding [39], physiological responses to abiotic stress [40], and growth-promotion mechanisms mediated by exogenous microorganisms [41]. While the influence of abiotic stress on rhizosphere microbial communities is extensively studied [42], preliminary observations from our study revealed an unusual physiological response of Q. mongolica under specific saline-alkali conditions, which deviates from the typical behavior of glycophytes. Whether salt stress, alkaline stress, and their combined effects regulate the reshaping of the rhizosphere microbial community of Q. mongolica through different pathways, and thereby differentially affect its stress adaptability, remains to be clarified. Therefore, this study analyzed the growth and physiological responses of Q. mongolica and the properties of its rhizosphere soil under different saline-alkali stress conditions. Key stress treatments were selected for in-depth microbiome analysis to achieve the following objectives: (1) to systematically clarify the specific effects of different stress types on Q. mongolica and its rhizosphere environment; (2) to reveal the potential mechanisms by which different stress types differentially reshape the structural and functional characteristics of the rhizosphere microbial network; and (3) to elucidate the role of plant–soil–microbe interactions in regulating the saline-alkali adaptability of Q. mongolica.
2. Materials and Methods
2.1. Plant Material and Experimental Design
This study was conducted at the Plant Basic Research Center of Jilin Agricultural University. The cultivation substrate was nutrient soil, which was prepared by mixing peat, perlite, and vermiculite at a volume ratio of 2:1:1. Initiated in June 2024, all test seedlings were grown from seeds collected from the campus of Jilin Agricultural University (125°24′28.8″–125°25′12″ E, 43°48′–43°48′57.6″ N). Based on pre-experimental results and target soil salinity-alkalinity gradients, three concentration levels were assigned to single salt stress and single alkali stress to cover both hormetic and inhibitory effects. The alkali stress was imposed using a 1:1 molar mixture of NaHCO_3_ and Na_2_CO_3_. For combined salinity-alkalinity stress, nine treatment groups were established using an orthogonal design, with detailed protocols provided in Table 1. Seedlings with consistent growth performance were transplanted into plastic pots filled with the test substrate for final establishment, and trays were placed at the bottom of the pots for the collection of leachate. In accordance with the preset soil salt content, expressed as a mass fraction for each treatment, salts and alkalis were precisely weighed, dissolved to form aqueous solutions, and evenly irrigated into each pot in three successive applications at a volume of 250 mL per application, with a 12-day interval between consecutive applications. During the experiment, soil moisture was replenished as needed to maintain a 50% water-holding capacity. Thirty days after the last stress treatment, plant growth parameters were measured, and mature intact leaves from upper shoots were collected for physiological index determination, with three seedlings randomly selected as samples per treatment and three biological repeats. Following sample collection, part of the leaf samples were reserved for chlorophyll content measurement, and the rest were weighed and stored at −80 °C for subsequent physiological analysis. Soil samples were collected from rhizosphere soil adhering to Q. mongolica seedling roots, placed in sealed plastic bags after impurity removal, and divided into two parts: one sieved through a 60-mesh sieve and stored at 4 °C for soil physicochemical properties and enzyme activity determination, and the other flash-frozen in liquid nitrogen for soil metagenomic sequencing.
2.2. Determination of Plant Growth-Physiological Indices, Soil Physicochemical Properties, and Enzyme Activities
Plant height increment was defined as the difference between the initial and final measurements from the stem base to the apical growing point, taken with a tape measure. Stem diameter increment was quantified as the difference between initial and final stem base diameters through an electronic vernier caliper. Total biomass was determined as the sample dry weight. Samples were first treated at 105 °C for 30 min for enzyme deactivation and then dried to constant weight at 75 °C before weighing. Chlorophyll content was measured by the ethanol extraction method. Superoxide dismutase (SOD), peroxidase (POD), and catalase (CAT) activities were assayed using the nitroblue tetrazolium (NBT) method [43], the guaiacol method [44], and ultraviolet spectrophotometry, respectively [45]. MDA content was determined by the thiobarbituric acid (TBA) colorimetric method [46]. SS, proline (Pro), and soluble protein (SP) contents were assayed through the anthrone colorimetric method, the acidic ninhydrin colorimetric method [47,48], and the Coomassie Brilliant Blue G-250 method, respectively [49].
Soil pH was determined using a Leici PHS-25 pH meter, and EC was measured using a Leici DDS-307A conductivity meter. Soil water content (SWC) was measured by the oven-drying method. Soil total organic carbon (TOC) content was quantified via the potassium dichromate oxidation-external heating method [50], and TN content was determined using an elemental analyzer [51]. Soil urease (S-UE), soil catalase (S-CAT), and soil sucrase (S-SC) activities were assayed by indophenol blue colorimetry [52], ultraviolet spectrophotometry [53], and 3,5-dinitrosalicylic acid (DNS) colorimetric method [54], and soil alkaline phosphatase (S-ALP) activity was determined via thep-nitrophenylphosphate (pNPP) colorimetry in a corresponding fashion [55].
2.3. Selection of Treatments for Metagenomic Analysis
Based on the growth response characteristics of Quercus mongolica seedlings to gradient concentrations in preliminary experiments, representative treatments were selected for metagenomic sequencing in combination with two-way ANOVA results. The analysis showed that salt stress and alkaline stress had significant main effects on growth and physiological indices, soil physicochemical properties, and enzyme activities (p < 0.05), with significant interactive effects observed for certain parameters under combined stress. Following this differentiated pattern of plant–soil responses, four treatments were selected for metagenomic sequencing—CK, S_2_, A_1_, and S_2_A_1_—with three biological replicates per treatment. Microbial community diversity data were compared using one-way ANOVA.
2.4. DNA Extraction, Library Preparation, and High-Throughput Sequencing
Soil metagenomic sequencing was performed by Novogene Co., Ltd. (Beijing, China). Briefly, 1 µg of genomic DNA per sample was randomly sheared to a target fragment size of approximately 350 bp using a Covaris ultrasonicator (Covaris, Inc., Woburn, MA, USA). Sequencing libraries were constructed using standard procedures, including end repair, A-tailing, adapter ligation, and PCR amplification [56,57,58]. Library size distribution and integrity were evaluated with a Fragment Analyzer system (Advanced Analytical Technologies, Inc., Ames, IA, USA). Libraries satisfying the expected size criteria were then precisely quantified using quantitative PCR (qPCR) to ensure an effective concentration exceeding 3 nM, which is a critical prerequisite for reliable library pooling [59] (He et al., 2025). Subsequently, qualified libraries were pooled at equimolar ratios according to their qPCR-derived effective concentrations and the desired sequencing depth. Equimolar pooling was conducted based on qPCR-determined concentrations and desired depth, followed by PE150 sequencing, yielding ≥10 Gb raw data per sample with Q30 ≥ 85%.
2.5. Co-Occurrence Network Construction and Analysis
The rhizosphere microbial co-occurrence network was constructed using genus-level relative abundance data from metagenomic sequencing. Genera present in ≥5 samples with relative abundance ≥0.02% were retained. Data were Hellinger-transformed via the vegan package in R v4.5.2, and significant pairwise Spearman correlations (|r| ≥ 0.7, p < 0.05) were identified using corrplot to generate an edge list [60]. The network was visualized in Gephi (version 0.10.1). Nodes (representing genera) were sized proportionally to their relative abundance. Positive and negative correlations were depicted by red and green edges, respectively. The layout was optimized using the Fruchterman Reingold algorithm with parameters set to 10,000 iterations, a gravity of 10, and a speed of 1.0 [61].
Network visualization was performed in Gephi v0.10.1. Nodes representing genera were sized by relative abundance. Positive and negative correlations were shown as red and green edges, while layout was optimized via the Fruchterman Reingold algorithm with 10,000 iterations, gravity = 10, and speed = 1.0. Topological properties, including nodes, edges, average degree, and modularity, were calculated in R using igraph and ggplot2. Nodes were classified into four topological roles based on Zi-Pi values [62] and color-coded by function, elucidating genus interactions, dominant taxa, and key roles under salt-alkali stress.
2.6. Partial Least Squares Path Modeling
To quantify microbial mediating roles, Partial Least Squares Path Modeling (PLS-PM) was implemented in R v4.5.2 using the plspm package. PLS-PM was conducted to elucidate cascading pathways in the soil–microbe–plant system under saline-alkali stress. Six latent variables were constructed based on measured indicators: soil physicochemical properties (pH, EC, SWC, TOC, TN), soil enzyme activities (S-UE, S-ALP, S-CAT, S-SC), microbial community (diversity indices and key taxa abundances), microbial function (metabolic pathway abundances and resistance gene abundances) [63], plant physiology (antioxidant enzyme activities, osmolytes, chlorophyll parameters), and plant growth (plant height increment, stem diameter increment). Path relationships were hypothesized based on a conceptual model in which soil properties drive microbial communities, which in turn influence soil enzyme activities and ultimately plant physiology and growth. The measurement model was evaluated using indicator loadings (>0.7), average variance extracted (AVE > 0.5), and composite reliability (CR > 0.7) following recommended thresholds. Overall goodness-of-fit (GoF) was calculated as the square root of the mean R^2^ of endogenous latent variables, with GoF > 0.36 indicating satisfactory fit [64].
2.7. Statistical Analysis
All results were expressed as the mean ± standard deviation (±SD) of three independent experiments. Statistical analyses were performed using Origin 2024 (SR1), Microsoft Excel 2016, and other software, with a significance level set at p < 0.05. For plant growth, physiological, and soil indices, normality and homogeneity of variances were tested first, followed by analysis of variance (ANOVA) for intergroup differences. Duncan‘s new multiple range test was used for post hoc comparisons following ANOVA. Graphs were plotted using Graphpad Prism 10.1.2 and Origin 2024. Microbial community composition and diversity were analyzed via R packages vegan (α/β diversity indices) and DESeq (community differences), with p-values adjusted using the Benjamini–Hochberg procedure to control the false discovery rate. Genus-level boxplots were generated by Origin 2024. LEfSe analysis was conducted on the Novogene Cloud Platform (https://magic.novogene.com/customer/main#/homeNew, accessed date 22 February 2026), while Mantel tests and redundancy analysis (RDA) were performed using Chiplot (https://chiplot.online/, accessed date 22 February 2026) and Canoco 5 (https://www.canoco5.com/, accessed date 22 February 2026), respectively. For Mantel tests performed via Chiplot, no multiple comparison correction was applied, as each test examined an independent hypothesis and the number of tests was limited. Microbial functional analyses were completed using STAMP software (Windows ver. 2.1.3) and R packages clusterProfiler (4.6.0), rhierbaps (1.1.0), and plspm (0.4.9). The relative abundance of functional genes and antibiotic resistance genes (ARGs) was calculated from three biological replicates, with standard errors determined. Functional enrichment and differential metabolic pathway analyses were implemented via clusterProfiler and STAMP (p < 0.05). Spearman’s correlation coefficients assessed associations between metabolic pathways, plant physiological indices, and soil properties, while partial Mantel tests evaluated correlations between soil properties and ARG profiles. Graphs were generated using R packages ggplot2 (ver. 3.2.0) and pheatmap (1.0.12), with heatmaps produced by pheatmap. Circos-algorithm-based genomic circle maps showing functional gene distribution were plotted on the Novogene Cloud Platform, and PLS-PM models were constructed through plspm and validated by Bootstrap resampling (1000 iterations).
3. Results
3.1. Differential Responses of Quercus mongolica Growth Physiology and Rhizosphere Soil Properties to Salt-Alkali Stress
3.1.1. Effects of Salt-Alkali Stress on Growth Characteristics of Quercus mongolica Seedlings
Under single salt stress, all three parameters were observed to attain maximum values at the S_2_ treatment (Figure 1, Table S1), with respective increases of 18.29%, 7.93%, and 7.55% relative to the CK, whereas their minimum values were recorded at the S_3_ treatment, corresponding to decreases of 36.94%, 35.71%, and 28.30%. A parallel trend was detected under single alkali stress (Figure 1). Maxima were attained at the A_1_ treatment with respective increases of 44.58%, 9.52%, and 9.43%, and minima were determined at the A_3_ treatment with respective decreases of 25.22%, 11.11%, and 28.30%. Growth performance was significantly suppressed under combined saline-alkali stress (Figure 1), with the S_3_A_3_ treatment inducing the most severe inhibition, corresponding to reductions of 52.58%, 50.79%, and 60.38% compared with the CK.
3.1.2. Effects of Salt-Alkali Stress on Physiological Characteristics of Quercus mongolica Seedlings
Under single salt stress, SOD activity showed an overall decreasing trend (Figure 1, Table S1), with its maximum and minimum values recorded in the S_2_ and S_3_ treatment, respectively, representing a 14.27% increase and a 35.05% decrease compared to the CK, respectively. POD activity, MDA, and SS contents were found to decrease first and then increase with increasing salt concentration; the minimum POD activity was noted in the S_1_ group, while the minimum MDA and SS contents were both recorded in the S_2_ group (Figure 1). These three minimum values were 23.39%, 36.79%, and 38.69% lower than those in the CK, respectively, and their maximum values were all documented in the S_3_ group, representing a 136.10%, 6.89%, and 70.28% increase compared to the CK, respectively (Figure 1). An inverse variation trend was observed between CAT activity and Pro content, with a minimum of CAT activity noted in the S_3_ group, a 49.97% decrease compared to the CK, while Pro content was recorded at its maximum in the S_3_ group, a 131.89% increase relative to the CK. SP content showed a trend of increasing first and then decreasing, with its maximum value recorded in the S_1_ group, a 31.94% increase relative to the CK, and its minimum value noted in the S_3_ group, a 26.39% decrease relative to the CK (Figure 1).
Under single alkali stress, SOD and CAT activities were both observed as increasing first and then decreasing with increasing alkali concentration, with their maximum values recorded in the A_1_ group, a 12.06% and 13.51% increase compared to the CK respectively, and minimum values noted in the A_3_ group, a 50.10% and 12.96% decrease relative to the CK, respectively (Figure 1). POD activity and SS content showed a trend of decreasing first and then increasing, with their minimum values observed in the A_1_ group, representing a 24.03% and 13.64% decrease compared to the CK group, respectively, and maximum values noted in the A_3_ group, representing a 122.23% and 69.72% increase relative to the CK group, respectively (Figure 1). MDA and Pro contents exhibited an initial decrease, a subsequent increase, and a final decrease. The minimum values of MDA and Pro content were recorded in the A_3_ and A_1_ groups, showing decreases of 37.44% and 4.49%, respectively. The maximum Pro content value was recorded in the A_2_ group, representing a 41.21% increase relative to the CK (Figure 1). SP content showed an opposite trend to that of MDA and Pro, with its maximum value recorded in the A_1_ group, a 38.89% increase compared to the CK (Figure 1).
Under combined saline-alkali stress with a fixed salt concentration, SOD activity, SP content, and CAT activity were all found to show a decreasing trend with increasing alkali concentration, with their minimum values detected in the S_3_A_3_ and S_1_A_3_ treatment, corresponding to a 60.50%, 68.06%, and 63.17% decrease compared to the CK, respectively (Figure 1). In contrast, for POD activity and MDA, SS and Pro contents exhibited an increasing trend, with the maximum values of POD activity, MDA, and SS contents recorded in the S_3_A_3_, representing 321.13%, 124.85%, and 127.48% increases compared to the CK, respectively. The maximum Pro content was observed in the S_1_A_3_, representing a 69.81% increase relative to the CK (Figure 1).
Under single salt stress, the total chlorophyll content peaked at S_2_, with a significant increase of 16.99% compared to the CK. Conversely, the maximum of the chlorophyll a/b ratio was found in the S_1_ group, which was 7.81% higher than the CK (Figure 1). However, when the salt concentration was raised to S_3_, the total chlorophyll content decreased by 5.89%, and the chlorophyll a/b ratio decreased by 17.97%, relative to the CK (Figure 1). Under single alkali stress, peak values of total chlorophyll content and chlorophyll a/b ratio were shown in the A_1_ groups, increasing by 18.95% and 34.38% relative to the CK, respectively (Figure 1). With increasing alkali concentration, total chlorophyll remained marginally above the CK at A_3_, whereas the chlorophyll a/b ratio was decreased to its minimum, showing a 4.68% decrease (Figure 1). Under combined saline-alkali stress, total chlorophyll content exhibited an overall decreasing trend, whereas no significant change was observed in the chlorophyll a/b ratio (Figure 1). However, at the same salt concentration, parameters declined with increasing alkali levels. The S_3_A_3_ treatment could be considered a threshold for stress effects. In this treatment, total chlorophyll content and the chlorophyll a/b ratio were slightly elevated compared to the CK, by 5.23% and 6.25%, respectively (Figure 1).
3.1.3. Effects of Salt-Alkali Stress on Soil Characteristics in the Rhizosphere of Quercus mongolica Seedlings
Multiple rhizosphere soil indicators of Q. mongolica seedlings were analyzed, and distinct indicator-specific response patterns of soil physicochemical properties were induced by different stress types (Figure 2, Table S2). Under single salt stress, pH, S-CAT, and S-ALP were found to decrease with rising salt concentration, with minima recorded at S_3_, which were reduced by 7.61%, 30.55%, and 37.87% relative to the CK, respectively. Conversely, EC, SWC, and TOC underwent a gradual increase to maxima at S_3_, with respective increases of 82.21%, 43.70%, and 27.90% in comparison with the CK, respectively. An initial increase followed by a decrease was exhibited by S-UE and S-SC. The maximum of S-UE was attained at S_2,_ corresponding to an increase of 21.52% relative to the CK. The maximum of S-SC was achieved at S_1_ with an increase of 2.92% compared with the CK. The minimums of both indicators were recorded at S_3_, which were reduced by 42.28% and 43.81% in comparison with the CK, respectively.
Under single alkali stress, pH was observed to increase steadily with rising alkali concentration, with the maximum attained at A_3_ and a 21.24% increase relative to the CK. EC, TOC, TN, S-CAT, S-ALP, S-UE, and S-SC were found to reach their maximum at the A_1_, exceeding the CK by 22.89%, 4.76%, 23.75%, 30.83%, 11.41%, 65.50% and 5.68%, respectively. At A_3_, TN, S-CAT, and S-UE were detected to remain above the CK, though reduced from their peak values at A_1_, while EC, TOC, S-ALP, and S-SC were observed to decline to their minimum values, which were 6.84%, 5.27%, 30.43%, and 38.67% lower compared with the CK. SWC exhibited a unique response pattern, which decreased by 10.71% at A_1_ relative to the CK and subsequently rose to its peak at A_3_ with a 25% increase in comparison with the CK.
Under combined saline-alkali stress with a constant salt concentration, distinct differences were observed in how various soil properties responded to increasing alkali levels. Soil pH, EC, SWC, and S-CAT were demonstrated to increase steadily as the alkali concentration increased progressively, with their maximum values all recorded in S_3_A_3_. These parameters were increased by 14.74%, 106.45%, 53.57%, and 29.96%, respectively, compared with the CK. In contrast, TN and S-UE activity exhibited fluctuating changes, with a decrease–increase–decrease trend identified, with the alkali concentration elevated continuously, and their lowest values were detected in S_3_A_3_, which were reduced by 11.37% and 49.46%, respectively. TOC, S-ALP, and S-SC activity showed an overall decreasing trend as alkali concentration increased.
3.2. Variations in Rhizosphere Soil Microbial Community Composition and Diversity
To clarify the microbial role in promoting Q. mongolica seedling growth under low-concentration single salt or alkali stress and its inhibitory role under combined stress, metagenomic sequencing was employed in this study to analyze rhizosphere soil microbial communities from four groups with three biological replicates each, including the CK, S_2_, A_1_, and S_2_A_1_. Raw sequencing data of 137,540 Mbp were generated, with 198 phylum-level and 4228 genus-level taxa identified. Genus-level taxonomic composition remained stable across treatments, whereas significant differences in the relative abundance were detected.
3.2.1. Analysis of Community Composition and Diversity
At the genus level, Sphingomonas, Pseudolabrys, Nocardioides, Bradyrhizobium, and Altererythrobacter were identified as dominant genera. Occallatibacter, Devosia, and Mesorhizobium were determined as secondary dominant genera (Figure 3A,B and Table S3). Under the S_2_ treatment, no significant overall difference from the CK was noted, but Sphingomonas, Nocardioides, and Devosia exhibited slight decreases. Altererythrobacter and Pseudomonas showed marginal increases. Under the A_1_ treatment, the abundances of Sphingomonas, Devosia, and Mesorhizobium increased, whereas Pseudolabrys, Occallatibacter, and Rhizomicrobium decreased. More pronounced shifts were detected under the S_2_A_1_ treatment, with the abundances of most genera decreasing significantly; exceptions were Altererythrobacter and Mesorhizobium, whose abundances continued to increase.
Significant inter-group variations were exhibited by rhizosphere soil microbial richness and diversity indices across four treatments (Figure 3). Among richness indices, minimum ACE and Chao1 index values were assigned to the CK, while peak values were attributed to A_1_ (Figure 3C,D). The minimum observed_species number value was also recorded in the CK, with its maximum assigned to S_2_A_1_ (Figure 3E). In contrast, the extreme-value attribution pattern of diversity indices differed from that of richness indices. The minimum Shannon–Wiener index value was documented in A_1_ and its maximum attributed to S_2_A_1_, while Simpson’s minimum was consistent with Shannon’s, and its peak was assigned to S_2_ (Figure 3F,G).
3.2.2. Linear Discriminant Analysis
Linear discriminant analysis effect size (LEfSe) was employed, with a threshold value of 3 set as the screening criterion, to identify statistically significant differential biomarkers across treatment groups. A total of 37 differential biomarkers were identified (Figure 4B). Among these biomarkers, Beakduiaceae, Reticulibacteraceae, and Labilitrichacea were defined as the characteristic differential biomarkers of the CK (Figure 4A). Unclassified_Terriglobales was confirmed as the core differential species in the S_2_ treatment (Figure 4A). The number of differential biomarkers in the A_1_ treatment was higher than that in both the CK and S_2_ treatments, with Bacteroidota and Acidimicrobiia showing the most significant differences (Figure 4A). Under the S_2_A_1_ treatment, Unclassified_Candidatus_Nomurabacteria, and Unclassified_Candidatus_Adlerbacteria were identified as the characteristic differential biomarkers (Figure 4A). The effect sizes for all treatment groups were above 3, with some exceeding 4.
3.3. Association Analysis of Plant Physiology, Rhizosphere Soil Properties, and Microbial Community
To identify microbial factors associated with physiological and soil physicochemical indices linked to Q. mongolica seedling growth, a Mantel test was performed on 21 indices. Different correlations between genus-level microbial communities and these indices across treatments were observed (Figure 5A). Pearson correlation analysis was conducted. CAT showed strong positive correlations with S-ALP and S-SC. Plant height increment was confirmed to show positive correlations with stem diameter increment, total biomass, and S-UE. Conversely, POD was identified as negatively correlated with CAT, S-AT, S-ALP, and S-SC. SS was determined to be inversely correlated with stem diameter. Total biomass and chlorophyll. EC, SWC, and TOC exhibited strong negative correlations with S-ALP and S-SC. Correlation analysis of five dominant genera revealed that the prominent associations through thicker blue and orange-red lines (p < 0.01) were represented by Sphingomonas and Pseudomonas, while weaker associations through thinner gray lines (p > 0.05) were demonstrated by Bradyrhizobium.
RDA was employed to reveal the correlations between genus-level rhizosphere soil microorganisms and soil physicochemical properties. 59.88% and 22.26% of the variation in microbial community structure were accounted for by the first and second ordination axes, respectively (Figure 5B). The results showed that the arrow lengths of SWC, S-UE, and S-CAT were the longest. Sphingomonas, Devosia, Mesorhizobium, and Phenylobacterium exhibited positive correlations with S-ALP, S-CAT, and TN. The pH was shown to be closely correlated with the abundance distribution of Altererythrobacter. Meanwhile, genera including Bradyrhizobium and Pseudolabrys were characterized by positive correlations with S-UE, S-SC, and EC, whereas positive correlations with TOC and SWC were demonstrated by genera such as Rhizomicrobium.
3.4. Characterization of Microbial Co-Occurrence Network
The structure of the rhizosphere soil microbial co-occurrence network of Q. mongolica seedlings was significantly influenced by saline-alkali stress. In the CK versus S_2_ comparison group, the number of nodes, edges, average degree, average weighted degree, and modularity coefficient of the network were all intermediate between the corresponding indices of the other comparison networks. The proportion of positive correlations among microorganisms reached the maximum proportion of 63.75% (Figure 6A). Three module hub species, namely Pseudogulbenkiania, Microlunatus, and Azoarcus, were identified from the co-occurrence network through Zi-Pi topological analysis (Figure 6B).
In the CK versus A_1_ comparison group, the number of nodes, edges, average degree, average weighted degree, and average path length of the network were the lowest among the three groups, whereas its modularity coefficient and number of modules were found to attain the maximum values of 0.931 and 114, respectively (Figure 6C). Aurantiacibacter and Rugosimonospora were identified as the module hub species in this network (Figure 6D).
In the CK versus S_2_A_1_ comparison group, the number of nodes, edges, average degree, average weighted degree, and average clustering coefficient of the co-occurrence network were higher than those of the other two groups. However, compared with the networks, this group showed the lowest modularity coefficient, number of modules, and proportion of positive correlations among microorganisms, the latter of which decreased to 58.29% (Figure 6E). Two module hub species that met the screening criteria (Zi < 2.5 and Pi < 0.62) were identified through Zi-Pi topological analysis, namely Aurantiacibacter and Thermogemmata (Figure 6F).
3.5. Effects of Salt-Alkali Stress on the Functional Potential of Microbial Communities
3.5.1. Response of Core Metabolic Pathways Based on the KEGG Database
To clarify the functional traits closely associated with microbial populations, KEGG functional annotation was conducted (Figure 7). It was observed that among the top 10 third-level functional pathways sorted by relative abundance, the overall inter-group differences in expression levels were minor, with only a few pathways exhibiting significant inter-group differentiation (Figure 7A). It was determined that under the S_2_, only the abundance of ko02020 was higher than the CK. Under A_1_, the abundances of ko02020 and ko01010 were identified to be distinctly elevated relative to the CK (Figure 7A). Compared with the other three groups, the S_2_A_1_ group exhibited the most significant increase in the abundance of ko02020, while the other pathways showed a decreasing trend (Figure 5A). Mantel analysis was performed, showing that ko02020 was closely correlated with SWC, TOC, S-CAT, S-ALP, and S-SC. ko02010 exhibited the strongest association with SWC, followed by that with S-ALP and S-SC. ko02024 was tightly linked to S-SC variations. ko00190 correlated exclusively with TOC content, and ko00620 abundance changes were shown to be associated with TOC, SWC, S-ALP, and S-SC (Figure 7B). A Venn diagram of gene counts was generated, and it was revealed that the combined saline-alkali stress group shared the largest associated gene number with the other three groups (Figure 7C). Principal coordinate analysis (PCoA) was carried out, and it was illustrated that axes 1 and 2 explained 65.66% and 19.22% of the total sample variation, respectively. The combined saline-alkali stress group exhibited distinct separation from other groups (Figure 7D). Non-metric multidimensional scaling (NMDS) was implemented, and a stress value of 0.064 was obtained. This value indicated satisfactory fitting consistency with PCoA results (Figure 7E). RDA showed that environmental factors collectively explained 86.82% of the variation in microbial KEGG pathway abundance, with S-SC, TOC, and S-CAT identified as the most significant regulatory drivers (Figure 7F). Correlation analysis was conducted, and it was found that ko00010 and ko00720 were positively correlated with S-SC, ko00630 was negatively correlated with TN, and ko00910 was positively correlated with TN (Figure 7F).
3.5.2. Responses of Antibiotic Resistance Genes Based on the CARD
Non-redundant gene sets were annotated against the resistance gene database and subsequently compared with the Comprehensive Antibiotic Resistance Database (CARD). The top 20 antibiotic resistance genes in the CARD from Q. mongolica rhizosphere soil samples under different treatments were compared (Figure 8A). Results showed that antibiotic resistance gene expression levels were most significant under A_1_ and S_2_A_1_, with notable differences with the CK (Figure 8B). Only the vanW_gene_in_vanl_cluster gene showed a significant positive correlation under S_2_, while the overall expression level of resistance genes remained low (Figure 8B). Under A_1_, vanW_gene_in_vanG_cluster and other genes, including rsmA and adeF, exhibited a significant divergence from the CK (Figure 8B). Under S_2_A_1_, genes including qacJ were confirmed to present distinct variation relative to the CK, with their expression levels increasing substantially (Figure 8B).
3.6. Partial Least Squares Path Modeling (PLS-PM) Analysis
It was indicated by PLS-PM analysis that saline-alkali stress at the first level induced a strong positive effect on soil physicochemical properties and enzyme activities (Figure 9A). At the second level, soil physicochemical properties were observed to have a strong positive effect on microbial diversity and composition. However, they showed a strong negative correlation with microbial functional groups. In contrast, soil enzyme activities exhibited the opposite trend (Figure 9A). At the third level, microbial diversity was found to mildly promote plant growth. However, it was also found to inhibit physiological responses. Microbial functional groups were revealed to produce a weaker effect. Additionally, a significant negative trade-off was identified between plant growth and physiological responses (Figure 9A). Plant growth was defined as the core biomass driver; saline-alkali stress was confirmed to generate a direct, strong promotion effect on biomass (Figure 9A).
The evaluation of the PLS-PM measurement model showed that all latent variables except microbial function (Func) met the recommended thresholds for indicator loadings (>0.7), average variance extracted (AVE > 0.5), and composite reliability (CR > 0.7), indicating generally good convergent validity and internal consistency. The Func latent variable had slightly lower AVE (0.41) and CR (0.43), likely reflecting the distinct functional dimensions captured by metabolic pathway and resistance gene abundances (Table S4). The model’s GoF value was determined to be 0.475 (above 0.36 threshold), confirming a good fit. Its mean R^2^ was relatively small but still explained 45% of biomass variation. The varimp value of qacJ was measured to reach 1.41, recognized as the top core variable, followed by MDA, Pro, and Devosia (Figure 9B).
4. Discussion
As a woody glycophyte typically considered salt-sensitive, Q. mongolica unexpectedly exhibited growth promotion under low-concentration salt stress (100 mmol·L^−1^ NaCl) and alkaline stress (50 mmol·L^−1^ Na_2_CO_3_), displaying a clear biphasic hormetic response. This deviates from the expected pattern of monotonic growth reduction with increasing salinity commonly observed in glycophytes [65,66]. This unusual behavior suggests that the boundary between glycophytic and halophytic strategies may not be absolute for woody perennials [67], which can exhibit intermediate adaptive responses depending on stress intensity and duration. The following sections discuss the underlying mechanisms for this hormetic response under each stress type as well as the contrasting inhibitory effects under combined stress.
4.1. The Growth-Promoting Effects and Underlying Mechanisms of Low-Concentration Salt Stress
Extensive research indicates that sublethal salt stress can serve as an ecological signal to induce adaptive responses in plants, manifesting as a hormetic effect that stimulates growth at low concentrations [68,69]. This study reveals further evidence that Q. mongolica seedlings exhibit a biphasic dose-response pattern to salt stress, characterized by growth promotion at low concentrations and inhibition at high concentrations.
4.1.1. Soil Physicochemical Changes Under Salt Stress
Under salt stress, the rhizosphere microenvironment exhibits a typical ion-dominated response pattern. This pattern manifests through three interconnected aspects. First, the increased influx of Na^+^ elevates rhizosphere EC, which in turn activates the root plasma membrane H^+^-ATPase to extrude H^+^. This process achieves Na^+^ exclusion and induces rhizosphere acidification [70,71]. This root-mediated acidification is regarded as a fundamental mechanism for enhancing plant salt tolerance [28]. Second, salt ions decrease soil water potential, triggering physiological water retention, as evidenced by increased SWC (Figure 2). Consequently, a decrease in osmotic potential reduces plant-available water, leading to physiological drought [72,73]. Third, the synchronous accumulation of TOC and TN (Figure 2) may reflect alterations in carbon and nitrogen cycling processes. This pattern is consistent with the inhibitory effects of salt ions on microbial-mediated turnover of organic matter, as previously reported [74].
4.1.2. Microbial Community and Functional Responses Under Salt Stress
This selective pressure is directly associated with a multi-level, systematic restructuring of microbial community [75], selecting for and enriching taxa with specific adaptive strategies, such as Pseudolays [76]. This genus likely contributes to host homeostasis under salt stress through three complementary mechanisms: ACC deaminase production reduces stress-induced ethylene levels, preventing premature senescence; exopolysaccharide secretion enhances soil aggregation and binds Na^+^ ions, reducing their availability to plants; and ion transport regulation may facilitate K^+^/Na^+^ homeostasis in the rhizosphere [77,78]. These microbe-mediated processes collectively alleviate ion toxicity and oxidative stress, explaining the observed enhancement of plant antioxidant capacity. Concurrently, root-secreted organic acids restructure microbial networks through rhizosphere modulation, thereby enhancing systemic stress resistance by fostering positive interactions and functional synergies within these networks [79]. Hub species such as Pseudogulbenkiania and Microlunatus (Figure 2) were identified as potential keystone taxa associated with network stability [80]. Functional gene analysis revealed two key adaptive strategies at the molecular level: increased abundance of the ko02020 two-component system pathway indicates enhanced microbial capacity for sensing and responding to osmotic and ionic signals; enrichment of the vanW resistance gene reflects genetic-level adaptation to cell wall stress under high salinity. Together, these adjustments enhance community-level salt tolerance [81,82], maintaining a functional microbiome capable of supporting plant growth under stress. By inhibiting overall microbial function and thereby causing a decreased rate of organic matter decomposition, the restructuring of the microbial community is associated with a general decline in soil enzyme activity [83,84]. An exception was observed for S-UE, whose activity increased relative to the CK (Figure 2), presumably as an adaptive response to nitrogen limitation through enhanced urea hydrolysis [85].
4.1.3. Plant Physiological Responses Under Salt Stress
Synergistic regulation of physicochemical, microbial, and enzymatic activities ultimately impacted the physiology of Q. mongolica seedlings. Characteristic activation of the antioxidant enzyme system was observed, with significantly increased SOD and POD activities (Figure 1). This response corresponds to the primary oxidative damage pathways induced by salt stress [86]: enhanced SOD activity converts superoxide radicals into H_2_O_2_, while increased POD activity subsequently detoxifies H_2_O_2_, maintaining redox homeostasis and regulating ROS within a controlled range. This coordinated antioxidant defense alleviates membrane lipid peroxidation, as evidenced by reduced MDA content [87,88,89]. A significant accumulation of Pro was observed (Figure 1), providing osmotic adjustment [90] by stabilizing protein structures and maintaining cellular turgor under reduced water potential. In addition, an increase in total chlorophyll content, alongside a stable chlorophyll a/b ratio, was observed in seedlings (Figure 1), indicating structural integrity of photosystem II (PSII) reaction centers and light-harvesting complexes (LHCs). This preservation of photosynthetic apparatus, supported by microbial-mediated nutrient availability and reduced oxidative damage, enables optimized light-energy utilization efficiency [91].
Collectively, these rhizosphere-to-plant responses constitute a coordinated hormetic mechanism. At low salt concentrations, moderate selective pressure activates rhizosphere processes and plant defense systems with minimal energy cost, yielding net benefits such as maintained photosynthetic capacity and membrane integrity. This growth promotion is underpinned by enhanced antioxidant and osmotic regulation (e.g., increased SOD/POD activities, Pro accumulation), supported by rhizosphere microbial activities such as Pseudolays enrichment. This multi-level coherence provides empirical evidence for the hormesis threshold in a woody species and underscores the energetic trade-off underlying plant stress adaptation. These findings also suggest that moderate salt regimes could promote seedling establishment in saline habitats, while excessive accumulation risks disrupting microbe-mediated support systems.
4.2. The Growth-Promoting Effects and Underlying Mechanisms of Low-Concentration Alkali Stress
A similar biphasic response is observed in Q. mongolica seedlings under both alkaline and salt stress, characterized by growth promotion at low concentrations and inhibition at high concentrations. However, the optimal concentration range for growth promotion differs between the two stressors.
4.2.1. Soil Physicochemical Changes Under Alkaline Stress
Under low-concentration alkaline stress, a distinct set of interconnected changes occurs in the rhizosphere environment. First, increases in pH, EC, and TN were observed (Figure 2). The increase in TN content may be related to the suppression of ammonia volatilization under alkaline conditions [92]. Second, the activities of soil enzymes, including S-UE, S-ALP, S-CAT, and S-SC, were synergistically enhanced (Figure 2). Mechanistically, the increase in S-UE and S-ALP activities is attributed to the elevated pH, which optimizes their catalytic microenvironment, as both enzymes exhibit optimal activity in neutral to alkaline conditions [93]. In parallel, the increase in S-CAT and S-SC may be associated with the enrichment of alkaline-tolerant microorganisms and accelerated carbon turnover [94]. Together, these coordinated responses contribute to a positive feedback loop between alkaline stress and soil enzyme activity [95], which alleviates stress-induced nutrient limitations. As a direct consequence of these physicochemical and enzymatic shifts, the rhizosphere microbial community undergoes multi-level functional restructuring in response to elevated pH [96].
4.2.2. Microbial Community and Functional Responses Under Alkaline Stress
At the population level, taxa such as Sphingomonas, Devosia, and Mesorhizobium were enriched (Figure 4), which are recognized for their dual roles in plant growth promotion and stress tolerance [97]. This genus likely improves plant performance through multiple mechanisms that are particularly beneficial under alkaline conditions: phytohormone secretion (e.g., IAA) can directly stimulate root growth; phosphate solubilization increases P availability, which is often limited in alkaline soils; and enhanced nitrogen transformation may alleviate N limitation induced by high pH [98,99,100]. Furthermore, co-occurrence network analysis revealed a significant increase in community modularity, indicating the formation of more specialized and functionally cohesive microbial groups adapted to the alkaline environment [101]. Within this restructured network, hub species, including Aurantiacibacter and Rugosimonospora, were identified as potential keystone taxa associated with module stability [97]. Functional gene analysis provided further insight into microbial adaptation strategies. The increased abundances of the ko02020 two-component system and ko01010 energy metabolism pathways (Figure 5) may reflect enhanced microbial capacity for environmental signal perception and nutrient acquisition in response to alkaline conditions [15,102]. Additionally, the activation of resistance genes, such as rsmA, vanY, and adeF (Figure 6), indicates that multiple genetic-level defense mechanisms—including stress response regulation (rsmA), cell wall modification (vanY), and multidrug efflux (adeF)—were recruited to enhance microbial survival under alkaline conditions [103,104].
4.2.3. Plant Physiological Responses Under Alkaline Stress
These adaptations collectively enhance the adaptability of the rhizosphere microbiome, which in turn enables it to support plants under stress. The enrichment of growth-promoting taxa, restructuring of microbial networks, and activation of stress-adaptive functional genes created a favorable rhizosphere environment that facilitated plant physiological adaptation. This was evidenced by enhanced antioxidant capacity (increased SOD and CAT activities with reduced MDA content, Figure 1), indicating efficient ROS scavenging and protection against oxidative membrane damage [105]. In contrast to salt stress, seedlings under alkaline stress preferentially accumulated SP (Figure 1), reflecting a metabolic shift toward synthesis of functional proteins (e.g., stress-responsive enzymes, chaperones) that support cellular function under high pH [42,92,106]. Concurrently, increases in both total chlorophyll content and the chlorophyll a/b ratio were observed (Figure 1), suggesting maintained PSII integrity and light-harvesting efficiency, indicating that photosynthetic machinery was preserved under alkaline stress.
In summary, the adaptive growth of Q. mongolica under low-concentration alkaline stress is supported by a multi-tiered network spanning the rhizosphere environment, microbial function, soil enzymes, and plant physiology. This integrated response constitutes a coordinated hormetic mechanism distinct from salt stress, characterized by pH-driven optimization of enzyme catalysis, enrichment of alkaline-tolerant taxa (e.g., Sphingomonas), and enhanced community modularity. These rhizosphere adjustments occur with minimal energy cost yet yield improved nutrient availability, maintained photosynthetic capacity, and enhanced antioxidant protection. The metabolic shift toward soluble protein accumulation rather than osmotic regulators reflects a stressor-specific adaptive strategy, providing empirical evidence for species-specific hormesis thresholds and energetic trade-offs shaping adaptation to different stress types. These findings also suggest that moderate alkalinity could be utilized to enhance seedling performance in alkaline soils, while highlighting soluble protein as a potential indicator for assessing plant adaptive status under alkaline conditions.
4.3. The Inhibitory Effects and Underlying Mechanisms of Combined Salt-Alkali Stress
The synergistic inhibitory effect of saline-alkali combined stress on Q. mongolica seedlings is mediated by a cascading pathway from the rhizosphere to the plant.
4.3.1. Soil Physicochemical Changes Under Combined Stress
This synergistic pathway initially induces a severe deterioration of the rhizosphere soil environment through multiple interacting mechanisms. First, the combined stress significantly increases EC and SWC (Figure 2), reflecting enhanced osmotic stress and ion toxicity that directly impair microbial cell stability [107,108]. Second, the elevated TOC and TN contents were observed (Figure 2). Mechanistically, these increases likely result from two concurrent processes: the suppression of microbial decomposition and nitrogen fixation functions under stress, coupled with a relatively increased input of root exudates [109].
4.3.2. Microbial Community and Functional Responses Under Combined Stress
This degraded soil environment disrupted microbial community structure and function. Unlike under single stressors, networks under combined stress exhibited high complexity but low synergy (Figure 4). This topological shift indicates that cooperative metabolic exchanges (e.g., cross-feeding) were replaced by competitive interactions, impairing community functional integration [59]. Within this loosened network, keystone taxa, such as Aurantiacibacter and Thermogemmatispora, were associated with reduced stability, suggesting that these taxa were unable to coordinate cross-module functions essential for community resilience under dual stress [110]. Only a limited number of taxa, including Altererythrobacter and Mesorhizobium, were significantly enriched. Altererythrobacter is primarily associated with soil electrical conductivity and salinity [111]. Although Mesorhizobium is recognized for its plant growth-promoting potential, including nitrogen fixation, this capacity is compromised under high salinity and pH conditions, which significantly suppress nodulation and nitrogen fixation efficiency [112]. Functional gene analysis revealed a metabolic reprioritization from mutualistic functions toward stress adaptation and cellular maintenance, evidenced by the suppression of core metabolic pathways alongside the activation of ko02020 (Figure 5) and the resistance genes qacJ and vanT (Figure 6). The ko02020 two-component system enhances bacterial signal perception for stress survival, while resistance gene activation reflects genetic-level adaptation to oxidative stress and membrane damage [113]. Together, these shifts indicate that microbial energy allocation was redirected from growth-promoting functions (e.g., nutrient cycling) toward self-preservation. The functional imbalance of the microbial community was reflected in differential responses in soil enzyme activities. Notably, elevated S-CAT activity may indicate an intense microbial antioxidative stress response [114], whereas inhibition of S-ALP, S-UE, and S-SC suggests that microbial capacity to provision nutrients to plants was compromised [30,115].
4.3.3. Plant Physiological Responses Under Combined Stress
The deterioration of the soil environment and the disruption of nutrient supply were ultimately transmitted to and exacerbated physiological disorders in the plants. In the antioxidant system, increased POD activity (Figure 1), which, together with an insufficient ROS scavenging capacity, resulted in elevated MDA content (Figure 1). This indicates that membrane lipid peroxidation damage could not be mitigated, as microbial-mediated support for plant antioxidant systems was diminished under combined stress [116]. Simultaneously, Pro content was decreased (Figure 1), suggesting a potential impairment of its biosynthetic pathway [117], potentially linked to reduced microbial supply of precursors or signaling molecules. Marginal increases in total chlorophyll content and chlorophyll a/b ratio (Figure 1) align with inhibited chlorophyll synthesis and PSII impairment, rather than healthy physiological adjustment [118,119].
Collectively, the inhibitory effect of saline-alkali combined stress on Q. mongolica seedlings arises from synergistic disruption of the plant–soil–microbe continuum, fundamentally distinct from the hormetic responses under single stressors. Combined stress imposes dual pressures of high Na^+^ toxicity and elevated pH that overwhelm regulatory capacity, shifting energy balance from growth investment to damage repair. The interaction of stressors amplifies negative effects beyond the sum of individual stresses, revealing woody plant vulnerability to complex saline-alkali environments. This highlights the need to prioritize the management of either salinity or alkalinity individually in afforestation practices to avoid synergistic inhibition.
5. Conclusions
This study reveals that Q. mongolica responds to saline-alkali stress through coordinated rhizosphere–microbe–plant interactions. Under single salt or alkali stress, beneficial microorganisms such as Altererythrobacter under salt stress and Sphingomonas and Devosia under alkali stress were enriched, maintaining soil enzyme activities and activating antioxidant and osmotic systems to promote growth. Under combined stress, however, these microbial groups persisted but functional decoupling occurred, with enzyme activities declining and physiological regulation failing, leading to oxidative damage and growth inhibition. This decoupling identifies a critical threshold at which microbial enrichment no longer ensures functional maintenance, marked by the synergistic increase in pH and EC. These findings offer a mechanistic basis for defining survival thresholds of Q. mongolica and guiding stress management in temperate forest restoration.
The reference list from the paper itself. Each links out to its DOI / PubMed record.
- 1Tang H. Du L. Xia C. Luo J. Bridging gaps and seeding futures: A synthesis of soil salinization and the role of plant-soil interactions under climate changei Science 20242711080410.1016/j.isci.2024.11080439286506 PMC 11404172 · doi ↗ · pubmed ↗
- 2Yue Y. Shao T. Long X. He T. Gao X. Zhou Z. Liu Z. Rengel Z. Microbiome structure and function in rhizosphere of Jerusalem artichoke grown in saline land Sci. Total Environ.202072413825910.1016/j.scitotenv.2020.13825932247981 · doi ↗ · pubmed ↗
- 3Tedeschi A. Xue X. Crop Response to Soil and Water Salinity Soil Syst.202592710.3390/soilsystems 9010027 · doi ↗
- 4Huang G. Sun Y. Zhang X. Rodríguez L.G. Luo J. Chen Z. Ou Y. Gao Y. Ghaffari H. Yao Y. Adaptation to low nitrogen and salt stresses in the desert poplar by effective regulation of nitrogen assimilation and ion balance Plant Physiol. Biochem.2022193142410.1016/j.plaphy.2022.10.02136308848 · doi ↗ · pubmed ↗
- 5Liu C. Jiang X. Yuan Z. Plant Responses and Adaptations to Salt Stress: A Review Horticulturae 202410122110.3390/horticulturae 10111221 · doi ↗
- 6Su T.-H. Shen Y. Chiang Y.-Y. Liu Y.-T. You H.-M. Lin H.-C. Kung K.-N. Huang Y.-M. Lai C.-M. Species selection as a key factor in the afforestation of coastal salt-affected lands: Insights from pot and field experiments J. Environ. Manag.202436012112610.1016/j.jenvman.2024.12112638761629 · doi ↗ · pubmed ↗
- 7Başak H. Aydin A. Yetişir H. Turan M. Salt Stress Effects on Hybrid Bottle Gourd (Lagenaria siceraria) Rootstock Candidates Plant Growth, Hormones and Nutrient Content J. Crop Health 2025772810.1007/s 10343-024-01087-4 · doi ↗
- 8Quamruzzaman M. Manik S.M.N. Livermore M. Johnson P. Zhou M. Shabala S. Multidimensional screening and evaluation of morpho-physiological indices for salinity stress tolerance in wheat J. Agron. Crop Sci.202220845447110.1111/jac.12587 · doi ↗