Transcriptome Profiling of Powdery Mildew-Stressed ‘Yeniang No. 2’ Grapevine Reveals Differential Expression, Alternative Splicing, and the Identification of 1232 Annotated Novel Genes
Huan Yu, Essam Elatafi, Wen Liu, Rui Zhang, Basma Elhendawy, Shuyu Xie, Xiongjun Cao, Xianjin Bai, Qiumi Huang, Chunfen Jiang, Lei Wang, Jinggui Fang, Jiayu Han

TL;DR
This study identifies genes and splicing events in grapevines infected with powdery mildew, revealing how the plant defends itself and offering tools for breeding resistant cultivars.
Contribution
The study identifies 1232 novel genes and reveals transcriptomic changes in grapevines under powdery mildew stress, including alternative splicing and defense-related pathways.
Findings
1219 differentially expressed genes were identified, with 790 upregulated and 429 downregulated in response to powdery mildew.
1883 novel genes and 22,210 alternative splicing events were discovered, primarily involving skipped exons and intron retention.
Key defense pathways activated include plant-pathogen interaction, phenylpropanoid biosynthesis, glutathione metabolism, and oxidative phosphorylation.
Abstract
Background: The global transcriptome reprogramming in grapevines in response to powdery mildew remains poorly understood, despite its economic implications, especially the new cultivars. Methods: Thus, this study aimed to elucidate these changes through RNA sequencing in ‘Yeniang No. 2’ grapevine leaves infected with powdery mildew compared to healthy ones. Results: A total of six samples were subjected to transcriptome sequencing, resulting in 36.85 Gb of clean data. A minimum of 5.89 Gb of clean data was generated for each sample, with at least 92.24% of the clean data attaining a quality score of Q30. Clean reads from each sample were aligned to the designated reference genome. The mapping ratio varied between 88.77% and 89.66%. The high-quality sequencing data revealed 1219 differentially expressed genes (DEGs), of which the infection upregulated 790 and downregulated 429.…
Genes, proteins, chemicals, diseases, species, mutations and cell lines named across the full text — each resolved to its canonical identifier and authoritative record.
Click any figure to enlarge with its caption.
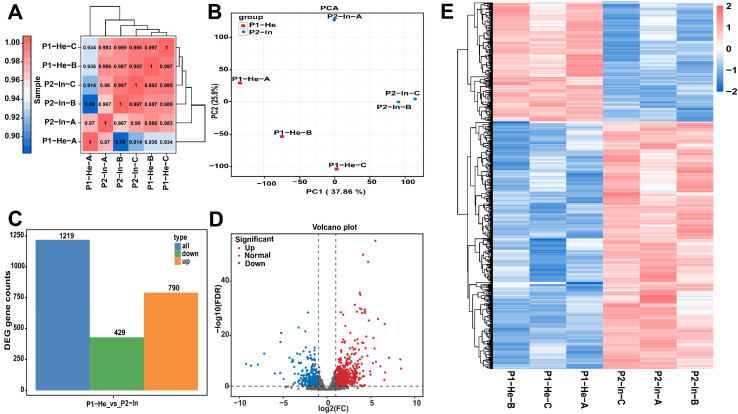 Figure 1
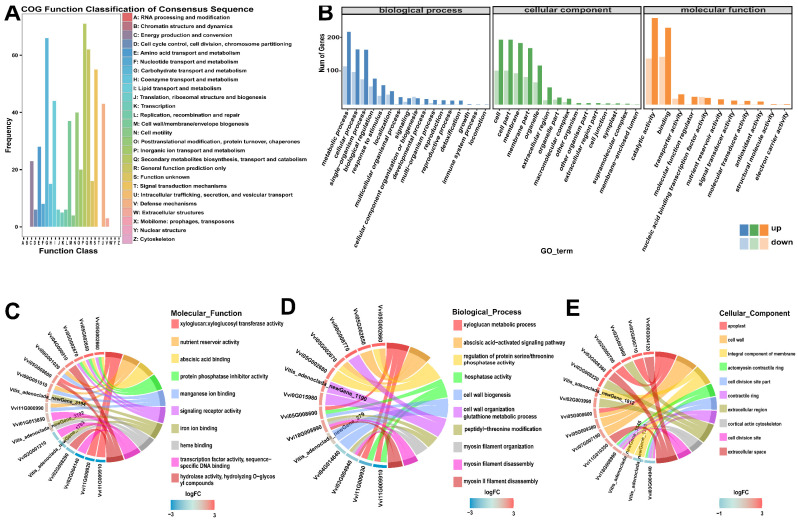 Figure 2
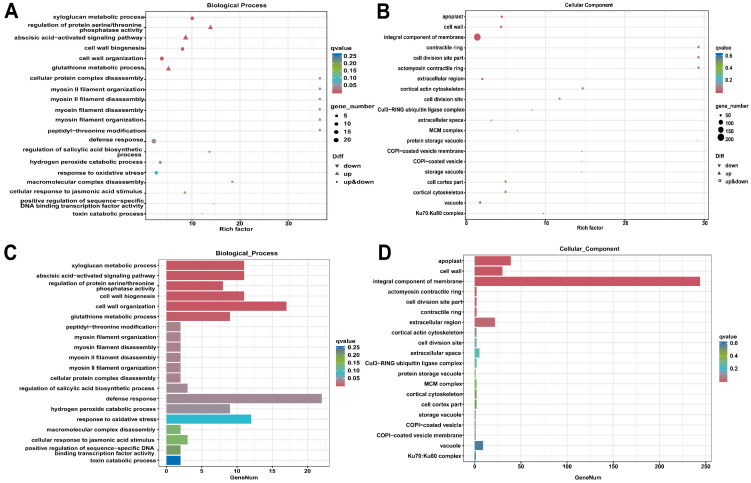 Figure 3
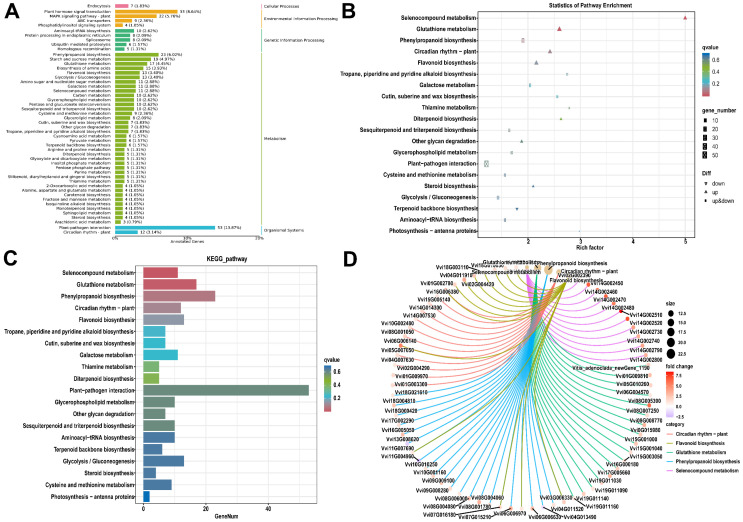 Figure 4
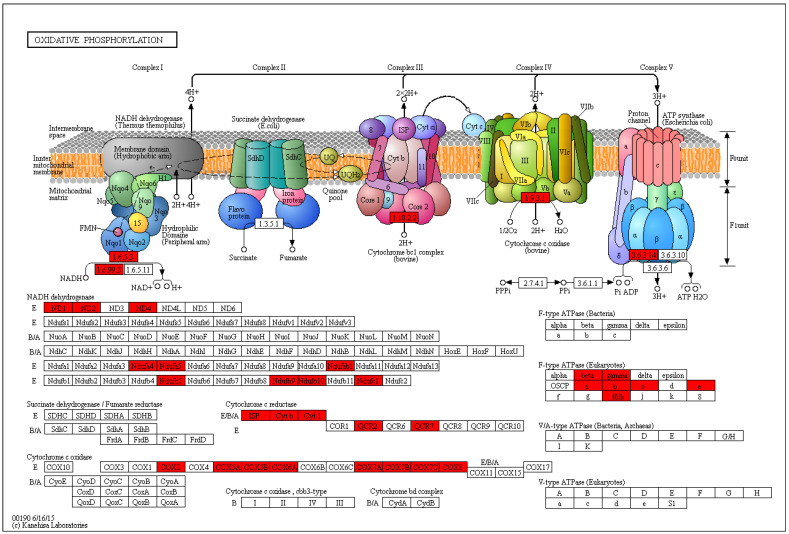 Figure 5
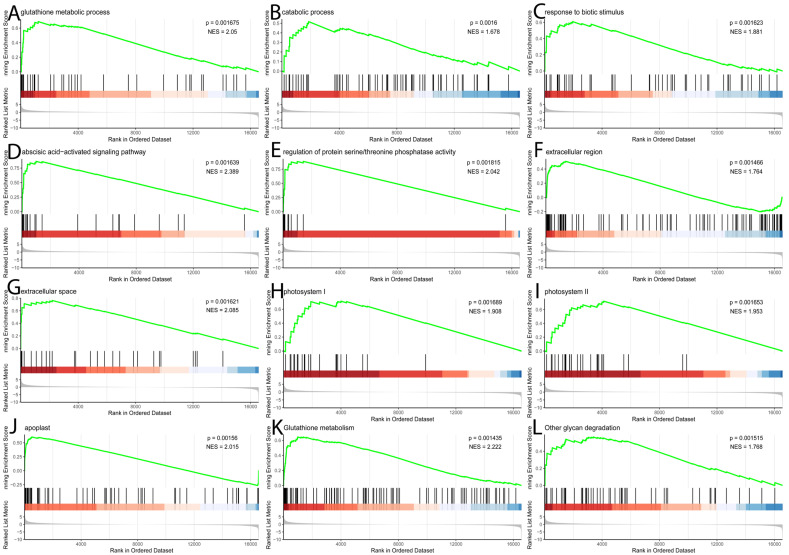 Figure 6
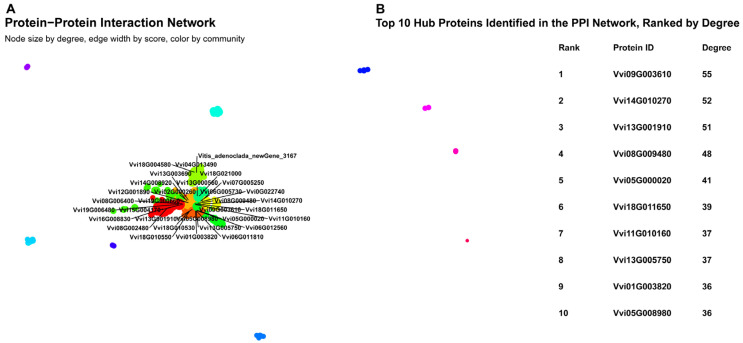 Figure 7
- —Basic Scientific Research Service Special Project of Guangxi Academy of Agricultural Sciences
- —2025 ‘Bagui Zhiguang’ Visiting Study and Training Program
- —Guangxi Key Research and Development Program
- —Guangxi Characteristic Crop Experiment Station
- —Guangxi Jingxi High-Altitude Characteristic Crop Experiment Station
- —Opening of Scientific and Technological Talents in the Wine Industry Technology Collaborative Innovation Center at the East Foot of Helan Mountain in Ningxia
- —Shandong Key R&D Plan (Agricultural Improved Seed Project)
Peer Reviews
No public reviews on file for this paper yet. If you reviewed it on a platform where reviews are public (OpenReview, ICLR, NeurIPS, ICML), you can paste yours below so the community can read it here.
Videos
No videos yet. Explain this paper in a talk, walkthrough, or lecture? Add one.
Taxonomy
TopicsHorticultural and Viticultural Research · Plant Gene Expression Analysis · Plant Molecular Biology Research
1. Introduction
Grapevines (Vitis spp.) are a significant horticultural crop cultivated globally [1,2]. Most planted grapes presently belong to the species Vitis vinifera. They are extremely vulnerable to powdery mildew, a disease induced by the obligate biotrophic fungal pathogen Erysiphe necator Schw. Erysiphe necator originated in North America and disseminated to England and France in the 1840s, ultimately infiltrating all other viticultural regions globally [3]. The disease affects all green tissues during their growing seasons, significantly reducing productivity, fruit quality, and wine quality, compelling grape growers to provide frequent and expensive fungicide treatments [4]. Within the European Union, more than 80,000 tons of fungicides are utilized each year to manage powdery mildew, accounting for around 67% of the total fungicides employed across all crops, despite just 3.3% of agricultural land being allocated to grape cultivation. Powdery mildew accounts for approximately 20% of the expenses associated with wine grape cultivation in California. Excessive fungicide use is hazardous to both the environment and human health, while simultaneously heightening selection pressure on pathogen populations to adapt and develop greater fungicide resistance [5,6]. Consequently, developing grapevine varieties that are resistant to diseases presents a more sustainable and effective option while also being environmentally friendly.
Different grapevine species and cultivars have significantly different levels of resistance to powdery mildew. Although commercially prevalent Vitis vinifera varieties are often vulnerable, some wild species, including North American Muscadinia rotundifolia and Vitis cinerea; Chinese Vitis species such as Vitis piasezkii, Vitis romanetii, Vitis quinquangularis, and Vitis pseudoreticulata; and certain Central Asian accessions of Vitis vinifera ssp. sylvestris have been identified as having genetic resistance to powdery mildew [7,8,9]. Complex molecular networks, including various defense signaling pathways, secondary metabolite production, and cell wall modifications, primarily govern these differences in tolerance [4,5]. A prior work has shown that the R-gene Resistance against Erysiphe necator 1 (Run1), mediated by a hypersensitive reaction, confers powdery mildew resistance in Muscadinia rotundifolia [10]. Fung et al. [11] utilized the Vitis GeneChip to report that 625 transcripts in Vitis vinifera and merely three transcripts in Vitis aestivalis were implicated in host responses to powdery mildew. Fekete et al. [12] found 25 genes in Vitis vinifera (cv. Cabernet Sauvignon) that were selectively elevated in response to Erysiphe necator and are susceptible to powdery mildew. Prior research offers significant insights into powdery mildew interactions within European and North American grape species.
Wine grape varieties exhibited differing degrees of sensitivity to powdery mildew due to their descent from Vitis vinifera L., a species that evolved without exposure to this fungus [13]. Conversely, the Chinese wild Vitis species co-evolved with Erysiphe necator and exhibited varying degrees of powdery mildew resistance, rendering these species a significant resource for investigating powdery mildew resistance in grapes. The Chinese wild Vitis quinquangularis Rehd. has potentially enduring, non-race-specific resistance to powdery mildew among wild Vitis species [9]. Genes conferring disease resistance have been effectively transferred from wild species of Chinese Vitis to Vitis vinifera.
The mechanisms of powdery mildew resistance in the Chinese wild species Vitis pseudoreticulata and Vitis quinquangularis were examined with a suppression subtractive hybridization cDNA library derived from Erysiphe necator-infected leaves [8]. Xu et al. [14] developed a cDNA library from Vitis pseudoreticulata infected with powdery mildew and discovered the expression of five sequence tags associated with powdery mildew protection. Investigations into gene expression profiling related to Vitis pseudoreticulata resistance have revealed the expression of pathogenesis-related (PR) genes, including PR10, a transcription factor potentially involved in conferring resistance to powdery mildew in grapevines [15]. Additional genes may significantly contribute to powdery mildew resistance, including VpWRKY1, VpWRKY2, ethylene response factor, VpWRKY3, VpNAC1, ring finger protein VpRFP1 and its promoter, heat shock transcription factor VpHsf1, retinoblastoma-related proteins, stilbene synthase (STS), glyoxal oxidase, and aldehyde dehydrogenases [16,17]. Zhang et al. [18] employed the Vitis microarray to examine gene expression in Vitis pseudoreticulata and identified the expression of 11,906 out of the 16,602 genes included on the microarray. Therefore, comprehending the genetic and molecular foundations of disease resistance and pinpointing the essential genes responsible for resistance in resilient germplasm should yield significant insights for employing molecular breeding to create novel grape varieties that demonstrate powdery mildew resistance while maintaining superior fruit quality. Consequently, the cultivar ‘Yeniang No. 2,’ derived from wild Chinese species, represents an underexplored genetic resource. It exhibits broad-spectrum disease resilience, including documented resistance to downy mildew [19,20]. Crucially, our field observations indicate that ‘Yeniang No. 2’ also possesses strong resistance to powdery mildew (Erysiphe necator). However, unlike its better-understood agronomic traits, the specific transcriptional mechanisms and key genes conferring this powdery mildew defense have not yet been identified.
In this study, we performed an extensive transcriptome analysis to delineate the molecular response of the ‘Yeniang No. 2’ grapevine to powdery mildew infection. Our primary objectives were to: (1) identify differentially expressed genes (DEGs) that are significantly up- or down-regulated following pathogen challenge; (2) discover novel, previously unannotated genes and analyze differential alternative splicing events associated with the defense response; and (3) perform functional enrichment analyses using GO, KEGG, and GSEA to elucidate the key biological pathways and protein interaction networks involved in powdery mildew resistance. This research seeks to delineate the transcriptional landscape of the grapevine–powdery mildew interaction, thereby offering a significant repository of candidate genes and pathways for subsequent functional investigations and the advancement of resistant cultivars via molecular breeding.
2. Materials and Methods
2.1. Plant Material, Growth Conditions, and Treatments
The experiment was carried out in a vineyard located at the Institute of Grapes and Wine in Nanning, Guangxi Province (22°36′39″ N, 108°13′51″ E). The grapevines utilized in the experiment were identified as ‘Yeniang No. 2.’ The cultivation occurred under a rain shelter, oriented in an east–west direction, with a spacing of 1.6 m between vines and 3.0 m between rows. A vertical canopy system alongside a conventional field management system was employed. The average irrigation rate was recorded at 21.6–36.0 L per vine per day during sunny conditions, while it was applied every other day under cloudy conditions. The cultivation and management of powdery mildew-infected ‘Yeniang No. 2’ were conducted using identical techniques to those employed for healthy ‘Yeniang No. 2,’ with the sole exception that no fungicide was utilized. Two experimental groups were utilized: healthy leaves (He) and leaves infected with powdery mildew (In). Each group consisted of three biological replicates, each of which comprised three grapevines. Throughout the winter fruit development period, spanning from late August to early January, the mean temperature recorded was 21.05 °C, accompanied by an average relative humidity of 81.40%. These climatic conditions were conducive to the proliferation of powdery mildew, particularly during the months of October to November, when the temperature reached 21.26 °C and relative humidity increased to 82.81%. The leaf samples were taken in autumn (18 November 2021), when the weather was drier with less rainfall, and powdery mildew was more severe. The leaves were collected from the third and fourth nodes, counting from the top. The samples were immediately frozen in liquid nitrogen after collection and stored at −80 °C for further analysis.
2.2. Total RNA Extraction and Transcriptome Sequencing
Grapevine leaf samples weighing 80 mg were ground in liquid nitrogen. Each sample underwent three biological replicates. The plant total RNA was extracted using the RNAprep Pure Plant Kit (Tiangen, Beijing, China) according to the instructions provided by the manufacturer. Subsequently, RNA concentration and purity were measured using NanoDrop 2000 (Thermo Fisher Scientific, Wilmington, DE, USA). RNA integrity was assessed using the RNA Nano 6000 Assay Kit of the Agilent Bioanalyzer 2100 system (Agilent Technologies, Santa Clara, CA, USA). Next, 1 μg RNA per sample was used as input material for the RNA sample preparations. Sequencing libraries were generated using Hieff NGS Ultima Dual-mode mRNA Library Prep Kit for Illumina (Yeasen Biotechnology, Co., Ltd., Shanghai, China) following manufacturer’s recommendations, and index codes were added to attribute sequences to each sample. mRNA was purified from total RNA using poly-T oligo-attached magnetic beads. Fragmentation was carried out using divalent cations under elevated temperature in NEBNext First Strand Synthesis Reaction Buffer (5X). First-strand cDNA was synthesized using random hexamer primer and M-MuLV Reverse Transcriptase. Second-strand cDNA synthesis was subsequently performed using DNA Polymerase I and RNase H. Remaining overhangs were converted into blunt ends via exonuclease/polymerase activities. After adenylation of 3’ ends of DNA fragments, NEBNext adaptors with hairpin loop structures were ligated to prepare for hybridization. To select cDNA fragments of preferentially 240 bp in length, the library fragments were purified with the AMPure XP system (Beckman Coulter, Beverly, MA, USA). Then 3 μL USER Enzyme (NEB, Ipswich, MA, USA) was used with size-selected, adaptor-ligated cDNA at 37 °C for 15 min followed by 5 min at 95 °C before PCR. Then PCR was performed with Phusion High-Fidelity DNA polymerase, Universal PCR primers, and Index (X) Primer. The PCR products were purified (AMPure XP system), and library quality was assessed on the Agilent Bioanalyzer 2100 system. At last, the clustering of the index-coded samples was performed on a cBot Cluster Generation System using TruSeq PE Cluster Kit v4-cBot-HS according to the manufacturer’s instructions. After cluster generation, the library preparations were sequenced on an Illumina NovaSeq6000 platform, and paired-end reads were generated. Following the library quality assessment, sequencing was commissioned to Shenzhen BGI Genomics Technology Co., Ltd. (Shenzhen, China) utilizing the DNBSEQ platform.
2.3. Quality Control and Sequencing Data Analysis
Raw reads underwent quality correction to yield valid sequences (clean reads). At the same time, Quality Score (Q) Q20, Q30, GC-content, and the sequence duplication level of the clean data were calculated [21]. For subsequent analysis, a proprietary reference genome of Vitis adenoclada (version Customer_v2) was used. This genome assembly was provided by Beijing Biomarker Biotechnology Co., Ltd., Beijing, China and is not publicly accessible but is available from the corresponding author upon reasonable request. Clean reads were aligned to this reference using HISAT2 [22]. StringTie [23] was applied to assemble the mapped reads by using Hisat2 alignment results. The quality of the RNA libraries was comprehensively evaluated prior to sequencing. We assessed RNA degradation and fragmentation randomness by examining the distribution of mapped reads across the genome. The library’s length dispersion was confirmed by analyzing the insert size distribution. Furthermore, the sufficiency of library volume was validated by generating a saturation curve, which correlated the number of genes identified with a specific expression accuracy to an increasing number of sampled mapped reads. Gene expression levels were quantified using FPKM (fragments per kilobase per million fragments mapped) by StringTie using the maximum flow algorithm [24]. The equation for FPKM is FPKM = cDNA Fragments/Mapped Fragments (Millions) ∗ Transcript Length (kb), where cDNA Fragments represents the number of PE reads mapped to the specific transcript; Mapped Fragments (Millions) is the number of all mapped reads, which is counted as 10^6^; and Transcript Length (kb) is the length of the transcript in units of 10^3^ b.
Differential expression analysis of two groups was performed using the DESeq2 [25] with three biological replicates. The criteria for identifying differentially expressed genes (DEGs) were set as a Fold Change (FC) of ≥2 and a False Discovery Rate (FDR) of <0.05. The p-values obtained were adjusted employing the Benjamini and Hochberg method to control the false discovery rate (FDR) [26]. Gene ontology (GO) enrichment analysis of DEGs was implemented by the GOseq R package based on Wallenius’ non-central hypergeometric distribution by using the clusterProfiler package according to Young et al. [27], which can adjust for gene length bias in DEGs. KOBAS digital library and clusterProfiler (v4.4.4) software were used to analyze the enrichment of DEGs in the KEGG (kyoto encyclopedia of genes and genomes) pathways [28] in the KEGG database. Gene set enrichment analysis (GSEA) was processed for all genes based on expression level. Gene sets of KEGG pathway and GO terms on biological process, cellular component, and molecular function were employed as gene sets of interest. Genes from each group were used as a background gene set. Enriched gene sets were identified with a p-value < 0.001 and FDR < 0.05 [29]. The sequences of the DEGs were blasted (blastx) to the genome of a related species (the protein–protein interaction (PPI) of which exists in the STRING database: http://string-db.org/ accessed on 2 November 2022) to get the predicted PPI of these DEGs.
The protein–protein interaction (PPI) network was constructed and analyzed using RStudio (v2025.09.2+418) with the tidyverse (v2.0.0), tidygraph (v1.3.0), and ggraph (v2.2.0) packages. The initial dataset, comprising a list of protein interactions with confidence scores and a corresponding node attribute file, was rigorously preprocessed to ensure data quality. Interactions with missing source or target identifiers were removed. To deal with duplicate entries where one protein pair had more than one interaction score, only the interaction with the highest score was kept for each unique pair. The network was treated as undirected. This filtering and cleaning procedure resulted in a final, high-confidence network of 1117 unique interactions among 427 distinct proteins (nodes). Topological properties of the network were calculated using functions from the tidygraph package. The degree centrality of each node was computed to quantify its number of connections. “Hub genes” were defined as the nodes within the top 10th percentile of the network’s degree distribution. To identify densely interconnected functional modules, a community detection analysis was performed using the Louvain algorithm, implemented via the group_louvain function. The algorithm was weighted by the Score of each interaction, giving higher-confidence interactions greater influence on the resulting community structure. The final PPI network was visualized using the ggraph package. The Fruchterman–Reingold force-directed layout algorithm, weighted by the interaction Score, was applied to organize the network structure, pulling tightly linked nodes closer together. To enhance interpretability, visual aesthetics were mapped to key topological attributes: node size was made proportional to its degree, and node color was assigned based on community membership. Edge width and transparency were mapped to the interaction score to highlight high-confidence connections. To maintain clarity, only the identified hub genes were labeled.
To investigate differential alternative splicing (AS), we analyzed RNA-seq data using the replicate multivariate analysis of transcript splicing (rMATS) pipeline [30]. We estimated the number of AS events in each sample separately. The analysis focused on five major types of AS events: skipped exon (SE), alternative 5’ splice site (A5SS), alternative 3’ splice site (A3SS), mutually exclusive exons (MXE), and retained intron (RI). For each event, the proportion of inclusion isoforms was quantified as the Percent Spliced In (PSI, or ψ) value, calculated from the counts of reads mapping to splice junctions. A likelihood-ratio test was conducted to evaluate the statistical significance of the disparity in PSI values between the two experimental groups. To account for multiple hypotheses testing, the resulting p-values were corrected using the Benjamini–Hochberg method to generate an FDR. Significant differential splicing events were defined as those meeting the following criteria: an FDR < 0.05 and an absolute change in PSI (|Δψ|) > 0.0001 [31].
The DEGs sets were used as candidate genes, and transcription factors (TFs) for plants were predicted using the software iTAK (v1.0) [32]. To identify genes with differential exon usage (DEU) between experimental conditions, we employed the DEXSeq package [32]. This method models exon-level read counts with a negative binomial distribution and utilizes a generalized linear model (GLM) to assess whether the relative usage of an exon, in proportion to the overall expression of its parent gene, differs significantly across sample groups. An FDR threshold of <0.05 was used to define statistically significant differential exon usage.
To validation the transcriptome results, ten DEGs were chosen for qPCR analysis utilizing the ChamQ Universal SYBR qPCR Master Mix Kit (Vazyme, Nanjing, China) and a Bio-Rad CFX-connected real-time system. The reaction conditions included pre-denaturation at 95 °C for 3 min, denaturation at 95 °C for 10 s, and annealing at 55 °C for 30 s. The final two steps were executed for 40 cycles. The data were analyzed using the 2^−∆∆CT^ technique [33], with VvActin serving as the internal reference gene. Primers were identified and developed utilizing the NCBI website (https://www.ncbi.nlm.nih.gov/) and Primer3 Plus software (v3.2.0) (Supplementary Table S1).
2.4. Statical Analysis
Analysis was performed using the statistical function prompt in R (v3.6.1). Unit variance was measured before unsupervised PCA. HCA results for samples were presented as dendrogram heatmaps [34]. Supplementary File S1 lists the software versions and their primary parameters along with a list of databases used in this study.
3. Results
3.1. Data Quality
Statistical analysis of clean sequencing data for all six samples (P1-He-A/B/C and P2-In-A/B/C) of ‘Yeniang No. 2’ grapevine confirmed the high quality of the run, which generated a total of 36.85 Gb of clean data (Supplementary Table S2). Each sample yielded 19.66 to 21.12 million clean reads, providing sufficient sequencing depth. Data quality was consistently high, demonstrated by stable GC content (45.88–46.55%) and excellent base call accuracy, with the percentage of bases exceeding a Phred score of 30% (≥Q30) consistently above 92.24%.
The quality of the RNA sequencing data, detailed in Supplementary Figures S1 and S2, was further assessed by aligning reads to the reference genome. The alignment resulted in a high overall mapping rate of 88.77% to 89.66% (Supplementary Table S3). The majority of these reads mapped uniquely (84.07–85.37%), with a low percentage of multi-mapping reads (3.70–4.81%), and no significant strand-specific bias was detected. Reads were uniformly distributed across all linkage groups without bias (Supplementary Figure S3), and a high proportion originated from exon regions (86.40–88.45%), confirming the successful capture of the expressed transcriptome (Supplementary Figure S4).
Three key quality control metrics ensured the reliability of the data. First, the uniform and symmetrical distribution of reads across normalized gene bodies indicated successful and random mRNA fragmentation (Supplementary Figure S5). Second, library insert sizes were consistent across all samples, showing a primary peak at approximately 320 bp, which confirmed the robustness of the preparation protocol (Supplementary Figure S6). Finally, sequencing saturation analysis demonstrated that the sequencing depth was sufficient for the reliable and accurate quantification of most expressed genes (Supplementary Figure S7).
3.2. Alternative Splicing Prediction
To characterize the landscape of AS, RNA-Seq data from all samples were analyzed using the ASprofile pipeline [21]. Following transcript assembly with StringTie [23], a comprehensive identification and classification of AS events was performed. Events were categorized into 12 distinct types as shown in Supplementary Table S4. The frequency of each AS event type was quantified across all six samples (P1-He-A/B/C and P2-In-A/B/C), and the results are presented in Supplementary Figure S8A. A consistent distribution pattern was observed across all biological replicates and conditions. The most predominant forms of alternative splicing were Alternative 5’ first exon (TSS) and Alternative 3’ last exon (TTS), with the number of events for each type consistently exceeding 15,000 in every sample (Figure 1A). This suggests that variability in transcription initiation and termination is a major source of transcript diversity. Following TSS and TTS, Alternative Exon ends (AE) was the next most abundant category, with several thousand events detected per sample. Other common but less frequent events included Intron Retention (IR) and Skipped Exon (SKIP). In contrast, more complex events such as Multi-exon SKIP (MSKIP), Multi-Intron Retention (MIR), and all approximate-boundary variants (prefixed with ‘X’) were detected at significantly lower frequencies. The high degree of similarity in AS profiles across all samples indicates a stable and reproducible splicing landscape under the conditions studied. Additionally, the detailed catalog of all identified AS events was generated as shown in the Supplementary File S2.
3.3. Gene Structure Optimization and Novel Gene Analysis
To enhance the precision of the initial annotations derived from a reference genome, an analysis to optimize gene structure was conducted. This process involved correcting gene boundaries by examining mapped sequencing reads. In cases where continuous reads were found extending beyond the originally annotated gene boundaries, the untranslated regions (UTRs) were extended either upstream or downstream to refine the gene model. Through this analysis, a total of 2950 genes were successfully optimized. A detail of these genes was described in the Supplementary File S3, which compares the original annotated regions with the newly optimized regions.
To enhance the genomic annotation, a comprehensive analysis was conducted to identify and characterize novel genes. Novel transcripts were discovered by assembling mapped sequencing reads using StringTie and comparing the resulting assemblies against the existing reference genome annotation. Transcripts not corresponding to any previously annotated features were designated as novel. Following a filtering step to remove putative transcripts encoding peptides shorter than 50 amino acids and those comprising only a single exon, a total of 1883 novel genes were identified. The structural details of these genes, including their genomic coordinates, were compiled in Supplementary File S4.
To infer the biological roles of these newly identified genes, they were subjected to extensive functional annotation using a suite of bioinformatics tools and databases. Homology-based annotation was performed using DIAMOND [35] against the NR (Non-Redundant) [36], Swiss-Prot [37], COG (Clusters of Orthologous Groups) [38], KOG (eukaryotic Orthologous Groups) [39], and KEGG (Kyoto Encyclopedia of Genes and Genomes) [40] databases. Protein domains and families were identified by searching the Pfam [41] database using HMMER [42]. Additionally, Gene Ontology (GO) [43] terms were assigned using InterProScan [44], which integrates multiple signature-recognition methods (Supplementary File S5).
The annotation results were analyzed (Supplementary File S6). Of the novel genes analyzed, 1232 received a functional annotation in at least one of the queried databases. The TrEMBL database yielded the highest number of annotations (1198 genes), followed by GO (850 genes) and eggNOG (824 genes). Significant numbers of genes were also annotated against the KEGG (597), Pfam (585), Swiss-Prot (525), KOG (355), and COG (131) databases. Conversely, 1216 of the novel genes could not be assigned a function with the methods used, suggesting they may represent unique or lineage-specific genes requiring further investigation.
3.4. Expression and Differential Gene Analysis
Gene expression levels across six samples (P1-He-A/B/C and P2-In-A/B/C) were quantified as FPKM using StringTie (Supplementary File S7). Quality control analysis was performed to assess the comparability and integrity of the sequencing data. The distribution of gene expression values was found to be highly consistent across all samples, with each exhibiting a single, prominent peak, which indicates the absence of significant global biases. Box plot analysis of log10 (FPKM) values (Supplementary Figure S8B) confirmed this finding by showing that the medians and interquartile ranges of the samples were very similar. These results collectively demonstrate that the expression data were well normalized, with consistent magnitude and dispersion, rendering them suitable for subsequent differential expression analysis.
To evaluate the reproducibility among biological replicates and identify potential outliers [45], we performed correlation and clustering analyses. A Pearson correlation coefficient r was constructed and visualized as a heatmap (Figure 1C). The results demonstrated strong intra-group correlation, indicating high reproducibility among replicates within the same condition. For example, the correlation coefficients (r) between replicates in the P2-In group were 0.997, 0.980, and 0.967, while the coefficient between P1-He-B and P1-He-C was 0.997. Hierarchical clustering, illustrated by the dendrograms, segregated the samples into two distinct clusters corresponding precisely to the P1-He and P2-In experimental groups. This confirms that the primary source of variation in the dataset is the biological condition.
To further visualize the sample relationships, principal component analysis (PCA) was conducted on the FPKM data (Figure 1D). The PCA plot clearly and strongly separated the two experimental groups along the first principal component (PC1), which made up 37.86% of the total variance. The three P1-He replicates (red squares) clustered together, while the three P2-In replicates (blue circles) formed another well-defined cluster. This clear separation corroborates the heatmap analysis, providing strong evidence that the biological differences between the groups are the dominant feature in the gene expression data. Collectively, these quality control analyses confirm the high quality of the data and the consistency of the biological replicates, validating the dataset for subsequent analysis of differentially expressed genes.
To identify genes with significant expression changes between the P1-He and P2-In conditions, a differential expression analysis was performed using the DESeq2 package [25]. The analysis revealed a total of 1219 DEGs between the two groups. Of these, a majority of 790 genes were found to be significantly up-regulated in the P2-In group compared to the P1-He group. The remaining 429 genes were significantly down-regulated (Figure 1E). This indicates a substantial transcriptional response, with more genes being induced than repressed in the P2-In condition. The differential expression analysis output was shown in Supplementary File S8.
The overall distribution and statistical significance of the DEGs were visualized using a volcano plot (Figure 1D). The plot separates the significantly up-regulated genes (red points) and down-regulated genes (blue points) from the non-significant genes (grey points). The y-axis (−log10 (FDR)) shows that many of the identified DEGs have a high level of statistical confidence. The x-axis (log2(FC)) shows a wide range of fold changes, with some genes showing changes greater than 5-log2FC. This plot confirms that differential expression was detected across the full spectrum of gene expression levels, from lowly to highly expressed genes, and corroborates the set of significant up-regulated (red) and down-regulated (blue) genes.
To assess the overall expression patterns of the 1219 DEGs across all samples (Supplementary File S9), a hierarchical clustering analysis was performed. The resulting heatmap (Figure 1E) illustrates distinct transcriptional profiles between the P1-He and P2-In groups. The biological replicates within each condition (P1-He-A/B/C and P2-In-A/B/C) cluster tightly together, demonstrating high intra-group consistency and clear separation between the two conditions. The heatmap reveals two major gene clusters. The upper cluster consists of genes with consistently higher expression levels in the P2-In samples (shown in red) and lower expression in the P1-He samples (shown in blue), corresponding to the 790 up-regulated genes. Conversely, the lower cluster represents the 429 down-regulated genes, which exhibit lower expression in the P2-In samples and higher expression in the P1-He samples. This clear segregation of expression patterns confirms a robust and consistent transcriptional reprogramming between the P1-He and P2-In conditions.
3.5. Differential Gene Enrichment Analysis
To elucidate the biological functions of the 1200 DEGs identified between the P1-He and P2-In groups, a comprehensive functional analysis was conducted. The majority of DEGs were successfully annotated against multiple public databases (Supplementary File S10). The results shows that a vast majority of the DEGs received functional annotations. Specifically, 1198 DEGs were annotated in the non-redundant (NR) protein database, 1063 in the Pfam database, 1034 in the eggNOG database, 1008 in the gene ontology (GO) database, 967 in the swiss-prot database, and 877 were mapped to pathways in the kyoto encyclopedia of genes and genomes (KEGG) database. Furthermore, 458 DEGs were classified into the clusters of orthologous groups (COG) database, enabling a broad functional characterization.
Functional classification using the COG database revealed that the most highly represented categories were related to secondary metabolite and carbohydrate metabolism (Figure 2A; Supplementary File S11). Similarly, broad gene ontology (GO) classification showed that DEGs were most abundant in “metabolic process,” “cellular process,” “cell,” “membrane,” “catalytic activity,” and “binding” (Figure 2B; Supplementary File S12). Additionally, the top 10 enrichment GO terms were selected to draw an enrichment string graph, and the results were as shown in Figure 2C–E.
Subsequent GO and KEGG pathway enrichment analyses identified statistically over-represented functional categories and pathways (Figure 3, Figure 4, Figures S9, S13 and S14). Key enriched pathways included “Plant–pathogen interaction,” “Plant hormone signal transduction,” “Phenylpropanoid biosynthesis,” and “Starch and sucrose metabolism,” indicating that DEGs are primarily involved in plant defense, signal transduction, and metabolic regulation.
A detailed examination of the “Oxidative Phosphorylation” pathway (Figure 5) reveals a striking and consistent pattern of gene regulation. The analysis showed a widespread upregulation of genes encoding subunits for all five major complexes of the mitochondrial electron transport chain. Specifically, multiple genes for NADH dehydrogenase (Complex I), such as ND1, ND2, ND3, ND4, ND4L, ND5, and ND6, were significantly upregulated. Likewise, parts of Succinate dehydrogenase (Complex II), the Cytochrome bc1 complex (Complex III), and Cytochrome c oxidase (Complex IV), such as COX1, COX2, and COX3, were also upregulated. This trend extended to ATP synthase (Complex V), where genes encoding subunits of the F-type ATPase were likewise upregulated. The pervasive upregulation across this entire pathway suggests a significant increase in mitochondrial respiratory activity and ATP production in the experimental condition relative to the control.
Gene set enrichment analysis (GSEA) corroborated these findings, demonstrating significant enrichment of upregulated genes in pathways related to plant defense (“response to biotic stimulus”), secondary metabolism (“Phenylpropanoid biosynthesis”), signal transduction (“abscisic acid-activated signaling pathway”), and photosynthesis (Figure 6; Supplementary Figure S10, File S16). Significantly enriched biological processes included stress signaling (“abscisic acid-activated signaling pathway”) and the biosynthesis of defensive secondary metabolites (“Flavonoid biosynthesis,” “Phenylpropanoid biosynthesis”), along with robust oxidative stress management (“Glutathione metabolism”). This response was driven by key molecular functions, such as “manganese ion binding” and “UDP-glycosyltransferase activity.” At the cellular level, enrichment was concentrated in the “extracellular space” and “apoplast,” indicating active cell wall remodeling and secretion, while enrichment for “photosystem” suggests dynamic regulation of the photosynthetic machinery.
3.6. Differential Alternative Splicing and Differential Exon Analysis
The analysis of differential alternative splicing identified five primary types of AS events: skipped exon (SE), alternative 5’ splice site (A5SS), alternative 3’ splice site (A3SS), mutually exclusive exons (MXE), and retained intron (RI) (Supplementary Figure S11; Supplementary File S17). The analysis revealed a substantial number of differentials AS events, totaling 22,210 across all categories (Supplementary Table S4). Skipped exon (SE) was the most prevalent type of splicing event, with 15,139 instances identified. This was followed by intron retention (RI), with 2427 events. In order to visualize each differential splicing, the differential variable splicing results are visualized using rmats2sashimiplot software (v4.0.2). Taking an AS event of type SE as an example (Supplementary Figure S12).
DEU analysis was performed using the DEXSeq package (Supplementary File S18). DEU analysis provides insights into expression differences between sample groups at the exon level, enabling the identification of specific exons that influence the expression of functional genes. This approach, in conjunction with the study of alternative splicing events, facilitates a more detailed understanding of gene expression regulatory mechanisms. For example, Table 1 presents a selection of exons identified as having significant differential usage between the experimental groups. The analysis identified exons with both increased (positive log2(FC)) and decreased (negative log2(FC)) usage. For instance, exon E001 of the gene Vad01G006980 exhibited a highly significant increase in usage (log2(FC) = 0.86, FDR = 7.70 × 10^−7^), while exon E002 of Vad01G003820 showed significantly decreased usage (log2(FC) = −0.76, FDR = 0.029). All listed exons met the significance threshold (FDR < 0.05), indicating specific alternative splicing events that differ between the conditions.
Additionally, the Supplementary Figure S13 provides a detailed visualization of a significant DEU event identified in the gene ENSSSCG00000000886, comparing a “P2-In,” group (red lines) to a “P1-He” group (blue lines). The analysis revealed that exon E007, highlighted in purple, exhibits markedly reduced usage in the “P2-In” group. This finding is supported from multiple perspectives within the figure. The modeled expression estimates show a clear drop in the relative abundance of exon E007 in the “P2-In” group (Panel A), a trend that is confirmed by the lower normalized read counts across individual biological replicates (Panel C). Critically, after normalizing for overall gene expression differences, the splicing model (Panel D) demonstrates a sharp decrease in the relative inclusion rate of exon E007. This isolates the change as a specific splicing event rather than a consequence of lower gene-level transcription. Collectively, these visualizations provide compelling evidence for a condition-specific alternative splicing event, likely the skipping of exon E007, in the “P2-In” group.
3.7. Protein–Protein Interaction Network
Figure 7A shows a protein–protein interaction network. The overall topology reveals one large, densely interconnected component surrounded by several smaller, isolated subgraphs and individual nodes (Supplementary File S19). The main component is characterized by a high degree of connectivity, with numerous edges converging on central nodes. These larger, central nodes represent “hub” proteins, which are involved in a high number of interactions and are likely critical for the network’s integrity and function. A community detection analysis, visualized by color, indicates a modular structure. The main component is composed of multiple, closely interacting communities, primarily colored red, orange, yellow, and green (Supplementary File S19). This modularity suggests the presence of distinct functional modules or protein complexes within the larger network. The smaller, disconnected subgraphs also form their own communities (e.g., cyan, blue, and magenta), indicating groups of proteins that interact with each other but not with the main network component. Additionally, the table in Figure 7B gives a numerical summary of the network’s most important proteins. It shows the top 10 hub proteins, which were found and ranked based on their degree. The protein with the highest connectivity is Vvi09G003610, with a degree of 55. The degrees of the top 10 hub proteins range from 55 down to 36, highlighting the key players within the interaction network.
3.8. Validation of qPCR
To validate the accuracy of transcriptome sequencing, 10 DEGs were randomly chosen for qPCR investigation. The expression patterns of these genes corresponded with the transcriptome sequencing data (Supplementary Figure S14). The results unequivocally proved the trustworthiness and precision of the transcriptome sequencing data.
4. Discussion
This comprehensive transcriptome analysis demonstrated that the ‘Yeniang No. 2’ grapevine exhibited a significant transcriptional response to powdery mildew infection. A total of six samples were subjected to transcriptome sequencing, resulting in 36.85 Gb of clean data. A minimum of 5.89 Gb of clean data was generated for each sample, with at least 92.24% of the clean data attaining a quality score of Q30. Clean reads from each sample were aligned to the designated reference genome. The mapping ratio varied between 88.77% and 89.66%. Alternative splicing prediction, gene structure optimization, and novel gene discovery were conducted based on mapping results, leading to the identification of 1883 genes and the annotation of 1232 novel genes with putative functions. Furthermore, DEGs were identified using the criteria of Fold Change ≥ 2 and FDR < 0.01, resulting in a total of 1219 DEGs, predominantly upregulated (790 genes).
Our study demonstrates that high sequencing depth, stable GC content, and Q30 scores exceeding 92% reflect superior sequencing quality, consistent with established benchmarks for plant RNA-seq research. The consistent exon mapping rate (86.40–88.45%) and elevated unique mapping (84.07–85.37%) indicate effective library preparation and dependable transcriptome coverage. Technical performance is recognized as crucial for accurate quantification and reproducibility in RNA-seq-based research on plant stress [46,47,48]. The strong intra-group correlation, distinct group separation in PCA, and well-normalized FPKM distributions underscore significant biological repeatability and minimal technical noise. Previous RNA-seq studies on grapevine drought and salt stress have highlighted the critical role of correlation and clustering among replicates in differentiating genuine biological responses from artifacts [46,49]. Additionally, hierarchical clustering and volcano plot visualization demonstrate substantial DEGs discovery, a trend seen in Vitis investigations under drought or salinity where extensive transcriptome remodeling underpins adaptive responses. DEGs enrichment in plant–pathogen interaction, MAPK signaling, phenylpropanoid, flavonoid, and glutathione metabolism pathways matches significant molecular themes in grapevine and other crops under biotic and abiotic stressors. These pathways are linked to stress signaling, secondary metabolite production, and detoxification [50,51,52,53,54].
In our findings, according to the GO analysis, the most DEGs were found in broad functional categories such as “metabolic process,” “cellular process,” “cell,” “membrane,” “catalytic activity,” and “binding.” Enrichment analysis revealed that these broad categories, as well as more particular pathways linked to membrane systems, organelles, and enzymatic processes, are the most significantly over-represented and biologically relevant. Upregulated genes were primarily related with these enriched terms. A KEGG enrichment analysis indicated that the DEGs response was mostly linked to plant defense mechanisms and significant metabolic alterations. The most notably enhanced pathways were “Plant–pathogen interaction” and “MAPK signaling,” signifying a major involvement in defense responses. Moreover, a pervasive activation of genes throughout all complexes in the oxidative phosphorylation pathway indicated a substantial enhancement in mitochondrial energy generation. Significant enrichment was observed in key metabolic pathways for secondary metabolites (“Phenylpropanoid biosynthesis,” “Flavonoid biosynthesis”) and primary metabolism (“Starch and sucrose metabolism,” “Biosynthesis of amino acids”), highlighting a thorough reprogramming of both defense and metabolic processes. GSEA indicated a statistically significant and coordinated upregulation of genes associated with a comprehensive biotic stress response. This includes the activation of defense and secondary metabolite pathways, stress hormone signaling, oxidative stress management, and adaptive remodeling of photosynthetic and extracellular systems. In Vitis and other stress transcriptomics literature, functional annotation and KEGG/GO enrichment results showed metabolic adjustment (starch/sucrose, amino acids), hormone signaling, and antioxidant defense are involved. GSEA confirmed the induction of defense, signaling, photosynthetic repair, and oxidative stress responses, similar to grape, tomato, cucumber, and flax treated with stress combos or dynamic abiotic triggers [49,54,55,56,57,58,59].
Our results from a comprehensive analysis of differential alternative splicing (DAS) identified five primary types of alternative splicing (AS) events, totaling 22,210 significant AS events, predominantly consisting of skipped exon (SE) types (15,139). Additionally, differential exon usage analysis confirmed specific exons that exhibited altered splicing between the experimental conditions. The identification of extensive alternative splicing (AS), characterized by predominant TSS, TTS, and AE, along with numerous significant differential splicing events, particularly SE and RI, aligns with existing multi-cultivar grape RNA-seq analyses. These studies acknowledge AS a key factor in proteome plasticity under stress conditions. The prevalence of exon skipping and the stability of alternative splicing profiles across replicates have been emphasized in recent cross-stress studies involving grapevine and other crops, raising awareness about the importance of alternative splicing in adaptive gene regulation [47,58,60]. Furthermore, the identification of 1883 new genes and the development of gene models demonstrate the ongoing expansion of annotated grapevine transcriptomes in our study, where the recent Vitis investigations indicated that high-depth RNA-seq routinely identifies lineage-specific, stress-regulated new genes with potential roles in adaptation, prompting continued annotation improvements [46,59].
In our findings, the developed PPI network exhibited a highly centralized structure, primarily characterized by two principal hub proteins, Vvi09G003610 and Vvi14G010270. Their extensive connectedness and closely linked neighbors indicate that these hubs are crucial regulatory proteins essential to the functional interactions among the DEGs. Analyses of protein–protein interaction networks indicate that hub regulators align with recent co-expression and PPI studies in grapevine related to drought, heat, and pathogen responses. In these analyses, central nodes often correspond to transcription factors, kinases, and regulators of stress pathways [48,49,52,61]. In addition to using rMATS and DEXSeq to determine condition-specific alternative splicing and differential exon use, recent stress transcriptomics techniques have been developed to analyze post-transcriptional complexity. Condition-associated AS events support the idea that stress affects gene abundance and isoform variety, affecting plant plasticity and adaptation [58,60].
Altogether, the current results confirm and extend significant molecular trends identified in grapevine and broader plant transcriptomics. Specifically, stress induces extensive transcriptional reprogramming, alternative splicing, and the enrichment of defense, metabolic, and signaling networks. The integration of AS, DEU, network analysis, and novel gene discovery illustrates a complex, multi-layered regulatory response in Vitis, which is increasingly acknowledged as essential for resilience to both biotic and abiotic challenges [47,49,52,53].
5. Conclusions
This comprehensive transcriptome analysis revealed that the ‘Yeniang No. 2’ grapevine exhibited a significant transcriptional response to powdery mildew infection, identifying 1219 differentially expressed genes (DEGs), predominantly upregulated (790 genes). Functional enrichment analyses, including GO, KEGG, and GSEA, indicated significant activation of defense-related pathways, such as plant–pathogen interaction, phenylpropanoid and flavonoid biosynthesis, glutathione metabolism, and oxidative phosphorylation. This data indicates a systematic approach to the development of antimicrobial agents, reduction in oxidative stress, and enhancement of energy production. Our study identified 1883 unique genes and significant post-transcriptional regulation, revealing 22,210 distinct alternative splicing events, primarily consisting of skipped exon and intron retention, indicating a complex layer of gene expression control. A limitation of the current study, however, is that these alternative splicing events were identified computationally. Future experimental validation of these specific transcriptional variants, such as verifying skipped exons and intron retentions via RT-PCR, is required to confirm these in silico transcriptomic predictions. The identification of key hub proteins in protein interaction networks and the common exon-level alterations underscore a complex defense strategy involving transcriptional reprogramming, metabolic transitions, and advanced splicing processes. Consequently, the genes and molecular markers discovered here represent valuable resources for marker-assisted breeding. Developing functional markers based on favorable splice variants or expression polymorphisms of hub genes following their experimental validation could accelerate the development of new durable–resistant grapevine cultivars.
The reference list from the paper itself. Each links out to its DOI / PubMed record.
- 1Elatafi E. Elhendawy B. Elshahat A. Iqbal S. Ren Y.H. Xuan X.X. Li W.T. Li F.Y. Fan S.X. Hakeem A. A Comprehensive Analysis of Cadmium Contamination in Viticulture: From Soil and Grape to Ecological Risks and Remediation J. Soil Sci. Plant Nutr.2025251401143110.1007/s 42729-025-02210-8 · doi ↗
- 2Iqbal S. Elatafi E. Tariq K. Ali S. Hakeem A. Shaonan L. Aziz R.B. Mauligen E.Q. Fang J. Drought Stress in Viticulture: An Update Review of the Effects, Mechanisms, Tolerance Strategies, and Mitigation Approaches J. Soil Sci. Plant Nutr.2025259049909110.1007/s 42729-025-02712-5 · doi ↗
- 3Gadoury D.M. Cadle-Davidson L. Wilcox W.F. Dry I.B. Seem R.C. Milgroom M.G. Grapevine powdery mildew (Erysiphe necator): A fascinating system for the study of the biology, ecology and epidemiology of an obligate biotroph Mol. Plant Pathol.20121311610.1111/j.1364-3703.2011.00728.x 21726395 PMC 6638670 · doi ↗ · pubmed ↗
- 4Yu H. Li H. Wei R. Cheng G. Zhou Y. Liu J. Xie T. Guo R. Zhou S. Widely targeted metabolomics profiling reveals the effect of powdery mildew on wine grape varieties with different levels of tolerance to the disease Foods 202211246110.3390/foods 1116246136010461 PMC 9407376 · doi ↗ · pubmed ↗
- 5Amrine K.C. Blanco-Ulate B. Riaz S. Pap D. Jones L. Figueroa-Balderas R. Walker M.A. Cantu D. Comparative transcriptomics of Central Asian Vitis vinifera accessions reveals distinct defense strategies against powdery mildew Hortic. Res.201521506710.1038/hortres.2015.37PMC 459167826504579 · doi ↗ · pubmed ↗
- 6Jones L. Riaz S. Morales-Cruz A. Amrine K.C. Mc Guire B. Gubler W.D. Walker M.A. Cantu D. Adaptive genomic structural variation in the grape powdery mildew pathogen, Erysiphe necator BMC Genom.201415108110.1186/1471-2164-15-1081 PMC 429894825487071 · doi ↗ · pubmed ↗
- 7Wu X.-C. Liu N. Zhang J.-X. Wang Y.-J. Field natural identification of resistance of grape resources from USA and Xinjiang of China to primary fungi diseases Guoshu Xuebao/J. Fruit Sci.201128849856
- 8Wan Y. Schwaninger H. He P. Wang Y. Comparison of resistance to powdery mildew and downy mildew in Chinese wild grapes Vitis Geilweilerhof 200746132