Uric Acid Variability Is Associated with Poor Prognosis in Heart Failure
Viana Copeland, Shir Elimeleh, Assi Milwidsky, Noam Makmal, Ranel Loutati, Boris Fishman, Yishay Wasserstrum, Moti Zwilling, Elad Maor, Ehud Grossman

TL;DR
Fluctuating uric acid levels in heart failure patients are linked to worse outcomes, suggesting that tracking these changes could help predict and manage the disease better.
Contribution
This study demonstrates that uric acid variability, not just its average level, is independently associated with mortality and hospitalization in heart failure patients.
Findings
Low uric acid variability was associated with reduced mortality and hospitalization risks in heart failure patients.
High uric acid variability was linked to increased mortality and hospitalization risks, even after adjusting for other factors.
The association between uric acid variability and outcomes remained consistent across different heart failure subgroups.
Abstract
Aims: Elevated uric acid (UA) levels correlate with worse heart failure (HF) outcomes, but past studies used single UA measurements. The effect of intra-individual UA fluctuations, beyond mean levels, is unclear. This study assesses the relationship between serum UA variability and adverse clinical outcomes in HF patients. Methods: We analyzed 18,115 HF patients from the SHEBAHEART registry (2009–2025) with at least three UA measurements within three years of diagnosis. UA variability was quantified as the mean deviation (MD) from each patient’s average UA level and divided into quartiles: Q1 (≤−0.69 mg/dL), Q2–Q3 (>−0.69 and <1.53 mg/dL, reference), and Q4 (≥1.53 mg/dL). All-cause mortality was the primary outcome and HF hospitalization was secondary. Cox regression, propensity score matching, and subgroup analyses were used. Results: Over a median follow-up of 4.3 years (IQR 1.6–7.7),…
Genes, proteins, chemicals, diseases, species, mutations and cell lines named across the full text — each resolved to its canonical identifier and authoritative record.
Click any figure to enlarge with its caption.
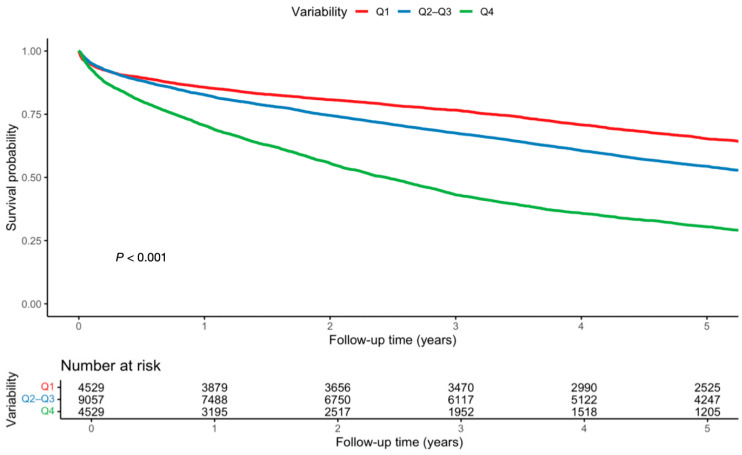 Figure 1
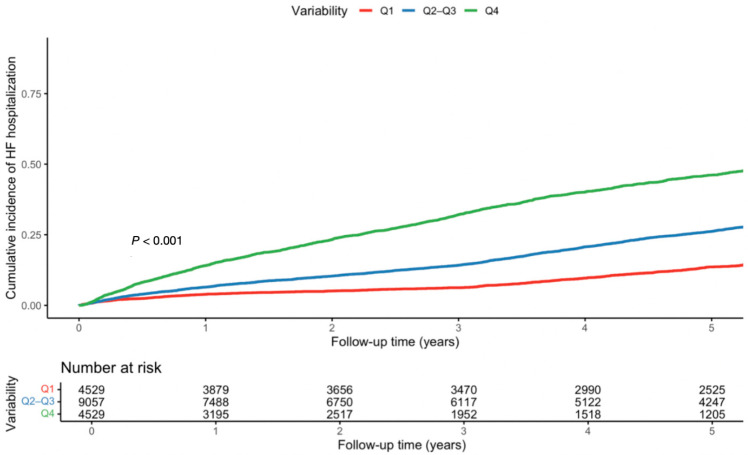 Figure 2
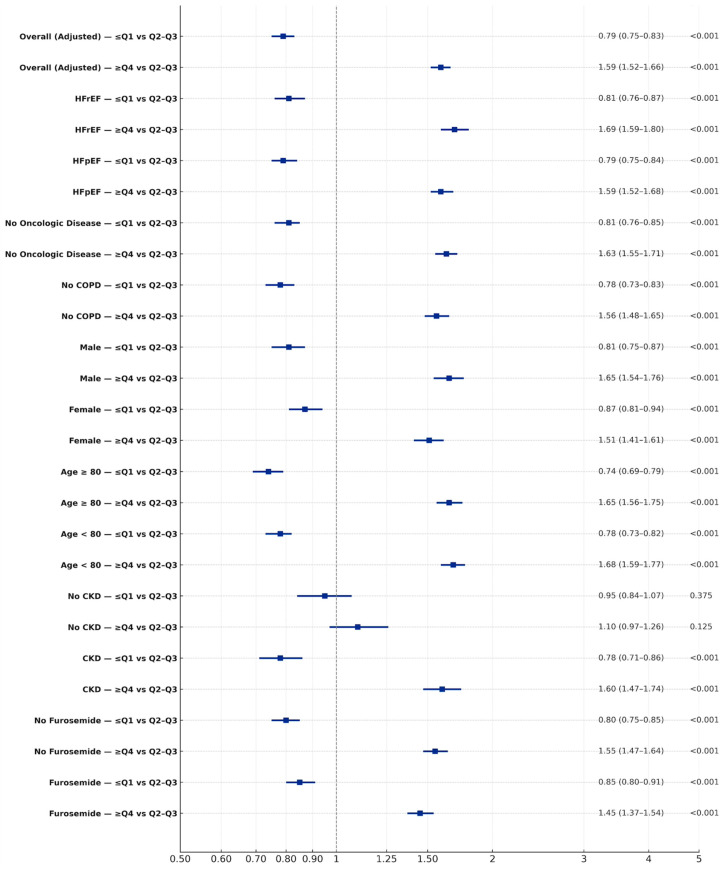 Figure 3
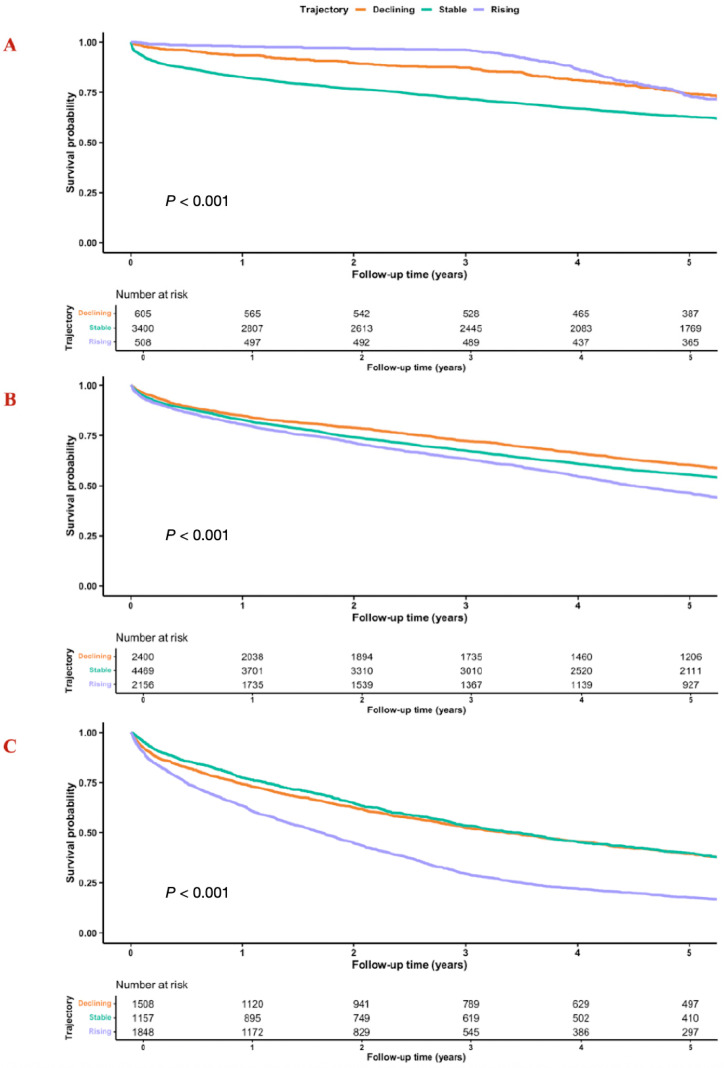 Figure 4
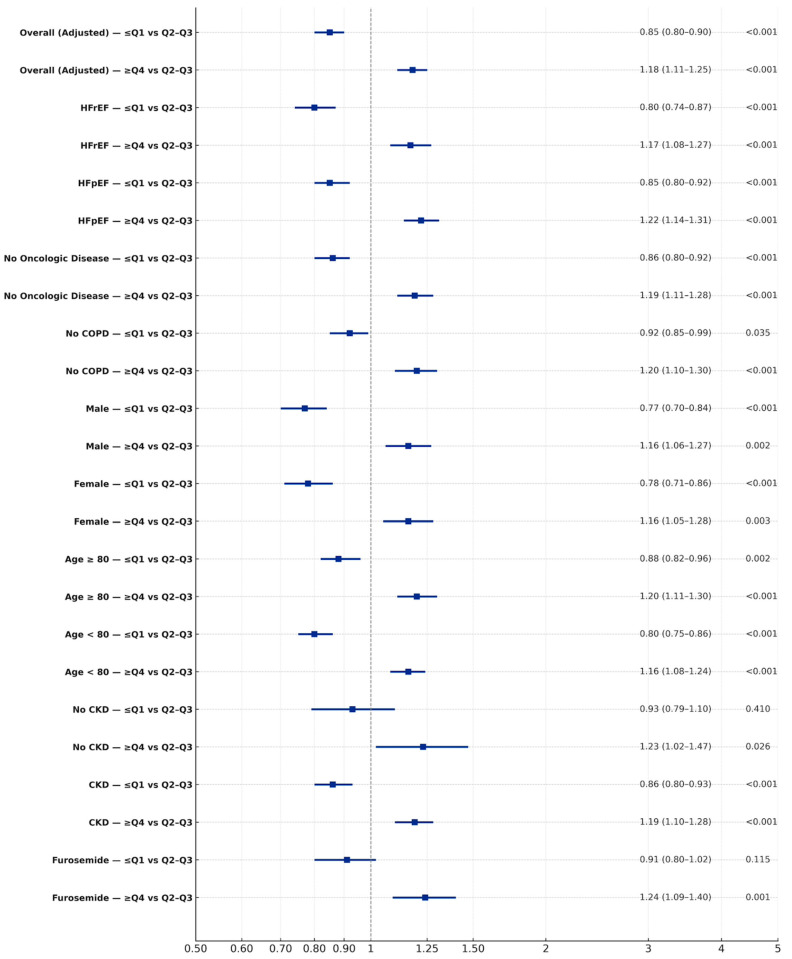 Figure 5
Peer Reviews
No public reviews on file for this paper yet. If you reviewed it on a platform where reviews are public (OpenReview, ICLR, NeurIPS, ICML), you can paste yours below so the community can read it here.
Videos
No videos yet. Explain this paper in a talk, walkthrough, or lecture? Add one.
Taxonomy
TopicsGout, Hyperuricemia, Uric Acid · Sodium Intake and Health · Heart rate and cardiovascular health
1. Introduction
Heart failure (HF) is a leading cause of morbidity and mortality worldwide, with outcomes shaped not only by established risk factors but also by metabolic and inflammatory pathways [1]. Among these, uric acid (UA) has emerged as a potential biomarker of cardiovascular risk [2,3]. Elevated serum UA levels are common in HF, driven by impaired renal clearance, tissue hypoxia, and xanthine oxidase activation, and are consistently associated with adverse prognosis, including increased mortality and re-hospitalization. Uric acid contributes to cardiovascular injury through oxidative stress, endothelial dysfunction, and inflammation, central mechanisms in HF, and higher levels are consistently linked to adverse cardiovascular outcomes.
This concept is supported by evidence linking uric acid to cardiovascular risk in hypertension and related phenotypes [4,5,6,7]. In recent years, the variability in biomarkers over time, which reflects within-patient biomarker fluctuations, has emerged as an important prognostic feature, complementing static baseline measurements. Greater intra-individual fluctuations in biomarkers such as blood pressure, cholesterol, and glucose have been shown to reflect systemic instability and to predict adverse cardiovascular outcomes independently of average levels [8,9,10,11,12,13]. In the context of HF, where disease trajectory is characterized by recurrent decompensations, hemodynamic shifts, and metabolic stress, UA variability may similarly provide insight into pathophysiologic instability beyond absolute concentrations [14,15,16].
Despite these considerations, the prognostic relevance of UA variability in HF remains poorly defined. Cardiovascular risk may depend not only on absolute uric acid levels but also on within-patient variability, reflecting fluctuations in congestion, renal function, neurohormonal activation, and treatment intensity.
Most studies have focused on single time-point measurements or the presence of hyperuricemia, without accounting for longitudinal changes [17]. Whether intra-individual fluctuations in UA amplify risk independent of mean levels, and whether such variability differs in impact across HF subtypes, is unknown. Accordingly, we sought to investigate the association between UA variability and all-cause mortality and rate of HF hospitalizations in a large, contemporary cohort of patients with HF.
2. Methods
2.1. Study Population
The study included all patients aged 18 years or older with a validated diagnosis of HF and at least three serum uric acid measurements obtained during a three-year follow-up period. Patients were excluded if they were younger than 18 years, lacked validation of the HF diagnosis, had fewer than three uric acid measurements, or had missing data in the population registry. The retrospective cohort included 18,115 consecutive adult patients with HF evaluated at Sheba Medical Center between January 2009 and February 2025. The analysis was conducted using the SHEBAHEART big data registry [18]. The study was approved by the Institutional Review Board, which granted a waiver of informed consent due to the retrospective nature of the analysis and the strict use of anonymized data. The primary outcome was all-cause mortality, retrieved from the Israeli Ministry of Interior through to February 2025. The secondary outcome was HF hospitalizations through to February 2025.
2.2. HF Definition
Diagnoses were established in accordance with the European Society of Cardiology (ESC) HF guidelines. Within the SHEBAHEART registry, HF diagnosis was established through a validated clinical process that included board-certified cardiologist assessment, review of hospitalization and outpatient records, and echocardiographic evaluation, with ICD-9 codes used only as supportive administrative identifiers [18]. International Classification of Diseases, Ninth Revision (ICD-9) codes 404.X and 428.X were used as supportive administrative identifiers.
2.3. HF Hospitalizations
HF hospitalization was defined using an integrated algorithm incorporating diagnostic, therapeutic, laboratory, and imaging criteria. Eligible events required a documented hospital admission and discharge with evidence of HF decompensation, including a discharge diagnosis of HF, cardiogenic shock, or pulmonary edema. Supportive criteria included intensification of diuretic therapy (initiation of intravenous furosemide or escalation in dose, timing, or route compared with baseline), initiation or escalation of vasoactive or vasodilator therapy, and laboratory worsening indicated by elevated inpatient BNP relative to baseline. Echocardiographic deterioration, defined as reduced left ventricular ejection fraction or increased inferior vena cava diameter, further supported HF hospitalization. Non-HF hospitalizations were excluded [19,20,21].
2.4. Study Variables and Outcomes
Baseline variables included age, sex, comorbidities, drug treatment, and laboratory and imaging parameters. HTN, DM, and other comorbidities were defined using ICD codes, laboratory thresholds, and chronic medication use recorded in the electronic medical record. Advanced chronic kidney disease (ACKD) was defined as a estimated glomerular filtration rate (eGFR) of ≤30 mL/min/1.73 m^2^ using CKD-EPI. Patients were further classified based on age groups, with patients ≥ 80 being classified as octogenarians or older and <80 as non-octogenarians. Anemia was defined as hemoglobin < 13 g/dL in men and <12 g/dL in women. History of use of urate-lowering therapy was captured and evaluated in subgroup analyses. Right ventricular function was assessed using tricuspid annular plane systolic excursion (TAPSE).
2.5. Definition and Calculation of UA Variability
Serum UA (mg/dL) measurements obtained during routine inpatient and outpatient care within three years of HF diagnosis were used to characterize absolute levels and intra-individual variability. To minimize reverse causality, follow-up was anchored at the first UA measurement after HF diagnosis. Same-day duplicate measurements were collapsed to one value per patient to limit surveillance bias. Variability was quantified as the mean deviation (MD), calculated as the average absolute difference between each UA measurement and the patient-specific mean UA value. The MD was calculated as the Σ of all absolute differences divided by the number of measurements (MD = (1/n) × Σ |UA_i − UA_mean|). This calculation captured the magnitude of fluctuations independent of direction. Quartiles of MD were used to allow non-linear risk assessment and to harmonize with prior variability studies, with the middle quartiles (Q2–Q3) being combined as a clinically interpretable ‘intermediate stability’ reference. Patients were stratified into quartiles of variability based on MD: Q1 (low variability, ≤−0.69 mg/dL), Q2–Q3 (mid-range, >−0.69 and <1.53 mg/dL; reference group), and Q4 (high variability, ≥1.53 mg/dL), allowing evaluation of risks associated with both low and high variability relative to a stable mid-range. Middle quartiles were combined to serve as a stable reference group, consistent with prior biomarker variability studies and to improve interpretability. Median UA variability delta ( ) (mg/dL) was defined as the median within-patient change in UA variability relative to the overall cohort median UA variability across the 3-year observation period. To capture directional changes, UA trajectory was separately analyzed and categorized as increasing, stable, or declining based on the slope of serial measurements from linear regression.
2.6. Statistical Analysis
Follow-up time was calculated from the date of the first UA measurement after HF diagnosis to ensure temporal alignment between exposure assessment and outcome risk. We employed Cox proportional hazards models with follow-up time in years as the time scale. Categorical variables were compared across the three groups using chi-square tests or Fisher’s exact test, and continuous variables were analyzed using one-way ANOVA or the Kruskal−Wallis test. Based on the observed event rate and sample size (n = 18,115), the study demonstrated > 90% statistical power to detect the observed hazard ratios for the primary outcome at a two-sided alpha level of 0.05. Proportional hazards assumptions were evaluated graphically and using Schoenfeld residuals. Unadjusted and multivariable Cox models were constructed using covariates selected based on clinical relevance, literature, and statical significance (p < 0.05). Multivariate analysis consisted of both continuous covariates and binary variables including age, LVEF ≤ 40%, SPAP ≥ 40 mmHg, eGFR ≤ 30 mL/min/1.73 m^2^, BMI ≥ 30 kg/m^2^, baseline UA levels, and GDMT. Variables with more than 40% missing data were not included in the analysis to minimize bias. For variables with less missing data, complete-case analysis was performed, given the large sample size and to preserve interpretability.
Sensitivity analyses assessed robustness across HF subtype, age, sex, diuretic use that may influence uric acid levels including allopurinol or febuxostat, and major comorbidities that may affect mortality, and were repeated in both unmatched Cox models and propensity score-matched (PSM) cohorts. PSM was used as a sensitivity analysis to reduce residual confounding, using 1:2:1 nearest-neighbor matching without replacement (caliper 0.2 SD) for pairwise contrasts (Q1 vs. Q2–Q3 and Q4 vs. Q2–Q3). All results are presented as hazard ratios with 95% confidence intervals using R (version 4.5.0, R Foundation for Statistical Computing). The data that support the findings of this study are derived from the SHEBAHEART registry and are not publicly available due to privacy and institutional governance restrictions. De-identified data may be made available upon reasonable request and subject to institutional approvals and a data-sharing agreement [18]. During the preparation of this manuscript, generative artificial intelligence tools (ChatGPT, OpenAI, and Grok) were used for language refinement and editorial assistance.
3. Results
3.1. Baseline Characteristics
The cohort included 18,115 patients stratified by UA variability: UA variability was categorized into low (≤−0.69 mg/dL; n = 4529), mid-range (>−0.69 and <1.53 mg/dL; n = 9057), and high (≥1.53 mg/dL; n = 4529) based on distance cutoff values. Median age was slightly higher in the high-variability group compared with low- and mid-variability groups (Table 1). Patients with high variability had more advanced renal dysfunction (median eGFR 54 vs. 71 mL/min/1.73 m^2^, p < 0.001) and higher SPAP (44 vs. 39 mmHg, p < 0.001) compared with the low-variability group (Table 1).
After PSM (n = 8384), UA variability was categorized into low (n = 2096), mid-range (n = 4192), and high (n = 2096). Baseline distributions of sex and comorbidities including CVA did not differ between the groups (p = 0.824 and p = 0.180, respectively). Renal dysfunction, SPAP, and anemia prevalence were more pronounced in the high-variability group (Table 2). Furthermore, HFpEF was more prevalent in the high-variability group (Table 2).
3.2. Mortality and HF Hospitalization
During a median follow-up of 4.3 years (IQR 1.6–7.7), 11,872 of 18,115 patients (65.5%) died and 6535 (36%) were hospitalized for HF. Mortality increased stepwise across variability quartiles: 52.5% (2381) in Q1, 64% (5775) in Q2–Q3, and 82% (3716) in Q4. One-year mortality was 14% (649) in Q1, 17% (1557) in Q2–Q3, and 29% (1333) in Q4. HF hospitalization followed a similar gradient: 24.0% (1084) in Q1, 38% (3434) in Q2–Q3, and 44.5% (2017) in Q4 (Supplementary Figure S1). The one-year HF hospitalization rate was 15% overall (2690), ranging from 8% (349) in Q1 to 19% (879) in Q4.
Low variability was associated with reduced mortality (HR 0.79, 95% CI; 0.75–0.83, p < 0.001), while high variability was associated with increased mortality (HR 1.59, 95% CI; 1.52–1.66, p < 0.001) (Table 3, Figure 1, Supplementary Tables S1 and S2). Findings persisted post PSM (Supplementary Tables S3–S5). For HF hospitalizations, low variability was related to reduced risk (HR 0.85, 95% CI; 0.80–0.90, p < 0.001), whereas high variability increased it (HR 1.18, 95% CI; 1.11–1.25, p < 0.001) (Table 4, Figure 2, Supplementary Tables S6 and S7). Findings persisted post PSM (Supplementary Tables S8 and S9).
3.3. Mortality—Subgroup Analysis
Subgroup analyses confirmed the robustness of the findings. Low UA variability was associated with lower mortality in both HFpEF and HFrEF, whereas high variability was consistently linked to higher risk (Figure 3, Supplementary Figure S2). High variability patterns persisted post PSM. Comparable patterns were seen across sex and age groups (Figure 3). Similar results were observed after excluding patients with comorbidities that may affect survival such as oncologic disease, COPD, or end-stage renal disease (Figure 3). Furthermore, this trend persisted once adjusted for TAPSE. Among patients receiving furosemide that may affect uric acid levels [N = 11,957 (67%)], low variability was associated with reduced mortality and high variability with increased mortality (Figure 3, Supplementary Figure S3). In patients not receiving furosemide, high variability was further significantly associated with increased mortality (Figure 3). Among patients treated with uric-acid-lowering agents [N = 1315 (7.5%)], high variability was associated with significantly higher mortality (HR 1.49, 95% CI 1.03–2.14; p = 0.029). Finally, analyses of UA trajectories showed that stable or declining trajectories were consistently associated with favorable outcomes, whereas rising or unstable trajectories conferred greater risk, with the highest mortality rate observed among patients with both high variability and rising UA (HR 1.71, 95% CI; 1.57–1.86; p < 0.001) (Figure 4). These patterns were replicated in PSM analysis and persisted post matching (Supplementary Tables S10–S40).
3.4. Hospitalization—Subgroup Analysis
Subgroup analyses confirmed the robustness of the findings. Low UA variability was consistently associated with fewer HF hospitalizations, whereas high variability was associated with higher risk across both HFpEF and HFrEF. High variability patterns persisted post PSM. Similar patterns were observed independent of age group and sex (Figure 5). Among patients receiving furosemide, low variability was associated with reduced hospitalizations and high variability with increased hospitalizations (Figure 5). In the absence of furosemide, high variability was further significantly associated with increased hospitalizations (Figure 5). Among patients treated with uric-acid-lowering agents, UA variability was not associated with HF hospitalization. These findings persisted post PSM. A similar trend was noted once adjusted for TAPSE. Finally, analyses of UA trajectories demonstrated that descending or stable trajectories were associated with lower rates of HF-related hospitalizations, particularly in patients with low or moderate variability, whereas rising UA trajectories were linked to higher risk. The greatest risk was observed in those with both high variability and rising UA levels (HR 1.15, 95% CI 1.02–1.31; p = 0.022) (Supplementary Tables S41–S71).
4. Discussion
In this large, contemporary cohort of HF patients, UA variability was a strong and independent predictor of mortality. Whereas prior work has largely focused on absolute UA concentrations, our findings highlight that the stability of UA values over time carries prognostic weight [22]. Patients with consistently low variability had better outcomes, while those with unstable patterns experienced substantially higher mortality, regardless of mean UA levels. Importantly, these associations extended beyond mortality to include HF hospitalizations, which followed a nearly identical graded relationship with UA variability.
Several mechanisms may underlie this association. UA, the end product of purine metabolism, is closely linked to xanthine oxidase activity, oxidative stress, endothelial dysfunction, and inflammation, key drivers of HF progression. Fluctuations in UA may reflect oscillatory oxidative stress, intermittent renal dysfunction, recurrent congestion–decongestion cycles, or variability in diuretic exposure, thereby signaling hemodynamic and metabolic instability. Unlike chronically elevated UA, which may indicate sustained risk, increased variability may capture episodes of acute decompensation and unstable renal handling of urates. The persistence of these associations in metabolic subgroups such as obese and diabetic patients further suggests that UA variability integrates shared metabolic, inflammatory, and renal stress pathways contributing to adverse cardiovascular outcomes [2,22,23,24,25].
The consistent associations across subgroups strengthen the generalizability of our findings. Both HFpEF and HFrEF patients demonstrated the same pattern, suggesting that UA variability reflects a pathway that cuts across ejection fraction phenotypes. This is particularly relevant in HFpEF, where traditional biomarkers and therapies have limited discriminatory value [3,26,27,28]. Importantly, this association persisted in patients not treated with furosemide, a drug known to increase UA levels [29,30]. This suggests that variability is not simply a pharmacologic artifact of loop diuretic use, but rather a more fundamental reflection of patient-level instability.
Trajectory analyses further extend this concept. Not only did the magnitude of variability matter, but the trajectory itself was informative. Patients with stable or slightly declining UA had substantially better outcomes, while those with highly unstable or rising trajectories carried the highest risk [2,22]. This suggests that serial monitoring of biomarker trajectory, not just point estimates, may be central to understanding risk in chronic HF [22].
UA variability was strongly associated with HF hospitalizations. Low variability was consistently linked to lower hospitalization risk, whereas high variability conferred increased risk, independent of HF subtype and major clinical factors. These findings indicate that UA instability predicts not only mortality but also recurrent decompensation events that drive morbidity and healthcare utilization [8,9,10,11,12]. The effect appeared more pronounced for mortality in older adults, while in younger patients both mortality and hospitalization were significantly impacted. Importantly, these associations persisted after adjustment for baseline UA levels, underscoring the incremental prognostic value of variability beyond static measurements [2,22].
Clinically, UA variability may enhance risk stratification and it supports the value of serial monitoring rather than single measurements [2,21]. Whether UA variability is a causal mediator or simply a marker of metabolic and hemodynamic instability remains uncertain. If causal, stabilizing UA levels could improve outcomes; if not, variability may serve primarily as a prognostic indicator rather than a therapeutic target. Prior UA-lowering trials in HF have focused on absolute reduction rather than stabilization, highlighting the need for future studies to clarify this distinction [22].
Finally, our results contribute to the broader understanding of biomarker variability as a clinical entity. Whereas prior studies have focused predominantly on single baseline uric acid levels, intra-individual longitudinal variability has not been rigorously examined as an independent prognostic marker after adjustment and propensity matching [3,31,32,33,34]. Similar to variability in glucose, blood pressure, and cholesterol, each of which has emerged as an independent predictor of outcomes in HF patients, UA variability appears to carry unique prognostic information [8,9,10,11,12,22]. If validated prospectively, UA variability could serve as a readily available, low-cost biomarker for refining management strategies in HF, where prognostic tools remain limited.
5. Strengths and Limitations
As a single-center study from a tertiary care facility, our findings may have limited generalizability to diverse populations with different dietary or healthcare access profiles. Nonetheless, it is important to note that the Israeli population is very diverse and shares a common genetic ancestry with many other populations, thus aiding generalizability [35]. Nonetheless, single-center registry studies may limit generalizability and introduce referral bias [36]. Because UA testing frequency was determined by clinical care, residual surveillance bias cannot be fully excluded, although consistent results across multiple sensitivity analyses mitigate this concern. Unmeasured confounders, such as a purine-rich diet, xanthine oxidase activity, or socioeconomic factors, could influence UA variability and outcomes. New York Heart Association class is inconsistently documented in structured fields and therefore could not be incorporated as a primary covariate without introducing differential missingness. Analytical variation in UA assays, due to laboratory techniques or timing of blood draws, may contribute to observed variability, though standardized protocols at our institution minimized this risk. Future studies should validate findings using uniform measurement schedules. However_,_ this study has key strengths, including its large, contemporary cohort with long follow-up, use of serial UA measurements to assess variability and trajectory, and consistent associations across mortality and HF hospitalizations independent of mean levels. Robust methodology with multivariable models, PSM, and subgroup and sensitivity analyses, further support the findings, while the use of national mortality data and routine laboratory tests enhances reliability and clinical relevance.
6. Conclusions
Patients with stable UA levels had substantially lower risk, while those with unstable or rising trajectories experienced markedly higher mortality and HF hospitalizations. Hospitalization analyses confirmed that UA variability captures not only long-term prognosis but also short-term vulnerability to acute decompensation. Taken together, these findings challenge reliance on single-point UA measurements and underscore the clinical importance of longitudinal biomarker monitoring. UA variability may integrate hemodynamic burden, renal function, and metabolic resilience into a single measurable parameter. Its low cost and widespread availability make it attractive for routine clinical use. Future prospective and interventional studies should determine whether therapeutic stabilization of UA fluctuations can mitigate risk and improve both survival and hospitalization outcomes in HF.
The reference list from the paper itself. Each links out to its DOI / PubMed record.
- 1Savarese G. Lund L.H. Global Public Health Burden of Heart Failure Card. Fail. Rev.2017371110.15420/cfr.2016:25:228785469 PMC 5494150 · doi ↗ · pubmed ↗
- 2Grossman C. Grossman E. Goldbourt U. Uric acid variability at midlife as an independent predictor of coronary heart disease and all-cause mortality P Lo S ONE 201914 e 022053210.1371/journal.pone.022053231381584 PMC 6681967 · doi ↗ · pubmed ↗
- 3Tian X. Chen S. Zhang Y. Zhang X. Xu Q. Wang P. Wu S. Luo Y. Wang A. Serum uric acid variation and the risk of cardiovascular disease: A prospective cohort study Eur. J. Intern. Med.2023112374410.1016/j.ejim.2023.02.00136764904 · doi ↗ · pubmed ↗
- 4Gibbs J. Gaskin E. Ji C. Miller M.A. Cappuccio F.P. The effect of plant-based dietary patterns on blood pressure: A systematic review and meta-analysis of controlled intervention trials J. Hypertens.202139233710.1097/HJH.000000000000260433275398 · doi ↗ · pubmed ↗
- 5Rahimi-Sakak F. Maroofi M. Rahmani J. Bellissimo N. Hekmatdoost A. Serum uric acid and risk of cardiovascular mortality: A systematic review and dose-response meta-analysis of cohort studies of over a million participants BMC Cardiovasc. Disord.20191921810.1186/s 12872-019-1215-z 31615412 PMC 6792332 · doi ↗ · pubmed ↗
- 6Miao L. Guo M. Pan D. Chen P. Chen Z. Gao J. Yu Y. Shi D. Du J. Serum Uric Acid and Risk of Chronic Heart Failure: A Systematic Review and Meta-Analysis Front. Med.2021878532710.3389/fmed.2021.78532734977088 PMC 8715937 · doi ↗ · pubmed ↗
- 7Selvaraj S. Claggett B.L. Pfeffer M.A. Desai A.S. Mc Causland F.R. Mc Grath M.M. Anand I.S. van Veldhuisen D.J. Kober L. Janssens S. Serum uric acid, influence of sacubitril–valsartan, and cardiovascular outcomes in heart failure with preserved ejection fraction: PARAGON-HF Eur. J. Heart Fail.2020222093210110.1002/ejhf.198432840930 · doi ↗ · pubmed ↗
- 8Stevens S.L. Wood S. Koshiaris C. Law K. Glasziou P. Stevens R.J. Mc Manus R.J. Blood pressure variability and cardiovascular disease: Systematic review and meta-analysis BMJ 2016354 i 409810.1136/bmj.i 409827511067 PMC 4979357 · doi ↗ · pubmed ↗