Quantitative Analysis of Sex-Specific Feminizer (fem) Transcripts During Honey Bee (Apis mellifera) Development
Joanna Niedbalska-Tarnowska, Agnieszka Łaszkiewicz, Ajda Moškrič, Janez Prešern, Kinga Adamczyk-Węglarzy, Natalia Romek, Malgorzata Cebrat

TL;DR
This study quantifies sex-specific fem transcripts in honey bees across developmental stages, revealing differences in expression between males and females.
Contribution
The study introduces optimized Real-Time PCR methods to accurately quantify femF and femM transcripts in honey bees.
Findings
femF is 100-fold more expressed in females than in males.
femM shows only 10-fold higher expression in males compared to females.
femM transcripts in males are stable and not degraded despite a premature stop codon.
Abstract
Sex determination in honey bees (Apis mellifera) is controlled by the complementary sex determiner (csd) gene, which directs female- or male-specific splicing of the downstream feminizer (fem) transcript. Previous studies have reported contradictory data on the expression of fem transcripts in both sexes, but no rigorous quantitative analysis across developmental stages had been performed. Here, we optimized Real-Time PCR conditions to reliably detect and quantify both female-specific (femF) and male-specific (femM) transcripts, addressing challenges posed by AT-rich sequences, repeated regions, and cDNA instability. Using these methods, we analyzed transcript levels in eggs, larvae, and pupae of both sexes. Our results show that femF is highly specific for females, with approximately 100-fold higher expression in females than in males, whereas femM is less sex-specific, with only…
Genes, proteins, chemicals, diseases, species, mutations and cell lines named across the full text — each resolved to its canonical identifier and authoritative record.
Click any figure to enlarge with its caption.
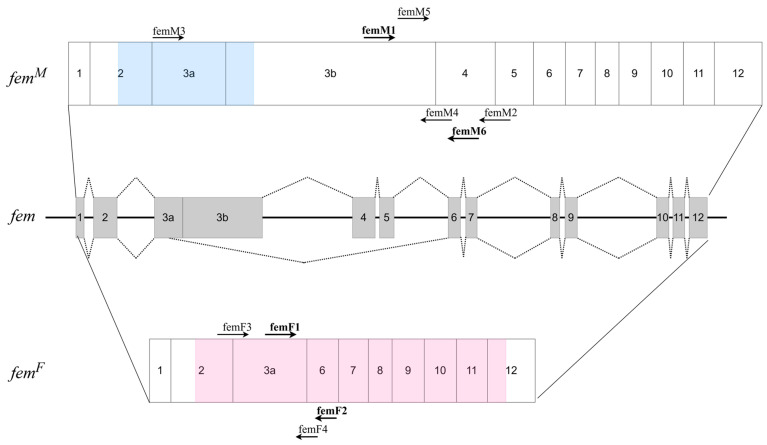 Figure 1
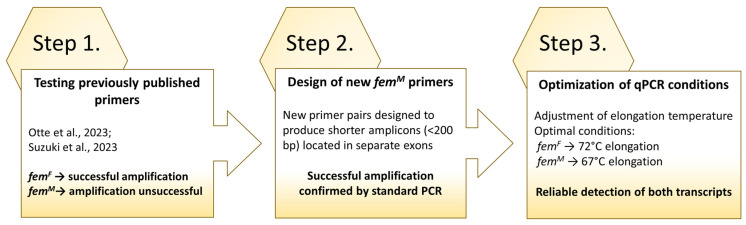 Figure 2
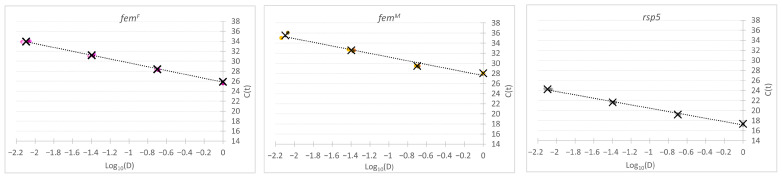 Figure 3
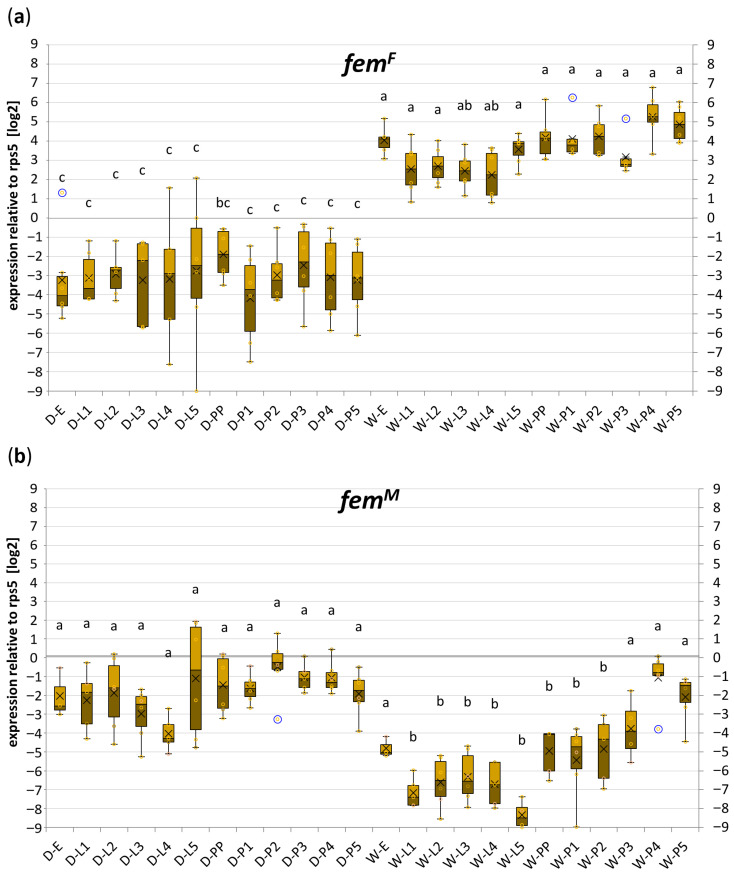 Figure 4
- —Slovenian Research and Innovation Agency (ARIS) Research Programs P4-0133 Sustainable Agriculture
- —P4-0431 Next Generation Agriculture
- —WEAVE-UNISONO Research Project GenoDrone
- —ARIS, Slovenia
- —National Science Centre, Poland
Peer Reviews
No public reviews on file for this paper yet. If you reviewed it on a platform where reviews are public (OpenReview, ICLR, NeurIPS, ICML), you can paste yours below so the community can read it here.
Videos
No videos yet. Explain this paper in a talk, walkthrough, or lecture? Add one.
Taxonomy
TopicsInsect and Arachnid Ecology and Behavior · Genetic and Clinical Aspects of Sex Determination and Chromosomal Abnormalities · Neurobiology and Insect Physiology Research
1. Introduction
Sex in honey bees is determined by the allelic composition of a single locus called the complementary sex determiner (csd). Individuals that are heterozygous at the csd develop into females (either a queen or a worker), while haploids develop into males (they are hemizygous for csd) [1,2]. Individuals which are homozygous for csd can eventually develop into diploid males that form male reproductive organs but are sterile due to producing diploid sperm, and they are usually killed at the early stage of their development by nurse bees [3]. The zero fitness of the individuals carrying a homozygous csd genotype results in high mutational pressure, leading to the diversification of the csd gene; csd is highly polymorphic in honey bee species Apis mellifera, A. cerana, and A. dorsata [4,5,6,7,8,9,10,11,12]. The csd gene originated from a gene duplication event of the fem/tra progenitor gene. Comparative sequence analyses and phylogenetic studies have demonstrated [13,14] that csd and fem genes share extensive sequence homology, particularly within the SR-type protein domain, indicating a common ancestral origin. Following duplication, csd acquired novel allelic diversity localized in the newly established hypervariable region and evolved a sex-determining function, acting as the primary signal in the complementary sex determination system. Meanwhile, fem retained its role as the downstream effector.
The prevailing set of evidence regarding the role of CSD protein in the sex-determination pathway shows that the presence of two different csd alleles in the embryo leads to female-specific splicing of the fem transcript consisting of exons 1/2/3a/6–12 (Figure 1). This results in the presence of a functional FEM protein, which, in turn, leads to female-specific splicing of the doublesex (dsx) transcript encoding a version of the protein truncated at the C-terminus. This initiates a cascade of female development. On the contrary, the lack of different csd alleles or a complete absence of csd gene products results in male-specific fem splicing (exons 1/2/3a/3b/4–12), encoding a non-functional protein due to the presence of a premature stop codon in exon 3b (Figure 1). The absence of the FEM protein leads to the appearance of a variant of the dsx transcript and protein that determines male development [1,2,15,16]. It has recently been shown that CSD proteins form trimers. The presence of the heterozygous csd genotype enables the formation of heterotrimers, in which CSD proteins interact with each other through their coiled-coil (CC) domains located immediately upstream of the RS-domain of the CSD. This type of CSD complex is thought to activate female-specific splicing of the fem transcript. The homozygous csd genotype manifests itself in the formation of CSD homotrimers, where CSD proteins interact through their identical (or nearly identical) C-terminal domains. These kinds of complexes are thought to be inactive in activating female-specific splicing of fem and lead to default male-specific splicing [16].
Interestingly, the scenario described above does not match the results obtained by another research group, which has shown that the female fem transcript is present in cells regardless of their csd status—i.e., whether they are heterozygous or homozygous for csd—while the male fem transcript is sex-specific and is present only in males [17]. This study suggests that the male FEM protein either directly promotes male development or acts as the dominant-negative regulator of the female FEM isoform. The experiment was performed in vitro using ectopic expression of csd genes and the fem minigene in a heterologous cell line (Bombyx mori BmN line); thus, direct comparison of these results and the findings of a study by Otte et al. [16], as well as the interpretation thereof, should be taken with some caution. However, their findings are supported by an earlier publication that also shows the expression of the female fem transcript in male embryos [18]. These earlier findings were not discussed in subsequent studies.
No rigorous quantitative analysis of the level of expression of sex-specific fem transcripts in distinct stages of bee development had been performed so far. The published results were obtained either at a single yet unknown time point under non-saturating PCR conditions [16] or after 35 cycles of PCR (presumably saturating conditions) [17]. Examination of the available literature also shows that amplification of sex-specific fem transcripts, in particular fem^M^, may have posed technical difficulties: in one of the studies the authors admitted that they excluded fem^M^ from the analysis because it was infrequently and weakly detected in males [16], while another study inferred the presence of fem^M^ from the presence of total fem transcript and absence of fem^F^ [19].
In this study, we addressed the question of whether sex-specific fem transcripts are strictly restricted to a single sex or whether their relative abundance changes during honey bee development. We hypothesized that fem transcripts may not be completely sex-specific and that their quantitative ratios vary across developmental stages. Reliable testing of this hypothesis requires accurate and quantitative detection of both splice variants. Therefore, we first established experimental conditions allowing for robust qPCR amplification of both the female-specific (fem^F^) and male-specific (fem^M^) transcripts. After validating these conditions, we performed a systematic analysis of fem transcript expression across developmental stages and sexes to determine the relative abundance and developmental dynamics of fem^F^ and fem^M^ in Apis mellifera. By providing a quantitative framework for assessing the ratios of sex-specific fem transcripts, our study contributes to resolving discrepancies in the literature and to a more comprehensive understanding of the molecular mechanisms underlying sex determination in honey bees.
Our study provides (i) the first quantitative developmental profile of both transcripts from egg to pupal stages, (ii) efficiency-corrected qPCR quantification enabling comparison between transcript variants, and (iii) a quantitative evaluation of the relative abundance of fem^F^ and fem^M^ during development.
2. Results
2.1. Establishing a Method for Quantitation of Sex-Specific Feminizer Transcripts
To establish the conditions for Real-Time PCR quantification of sex-specific fem transcripts, we first focused on identifying suitable primer sets. Admittedly, this task is not trivial for the fem locus, as it contains repeated regions both within the fem gene itself and in the csd gene, which originated from a duplication event of fem. Moreover, the fem transcript sequence includes AT-rich, low-complexity regions, further complicating both primer design and optimization of reaction conditions. Additional criteria for primer selection were that the fem^M^ and fem^F^ amplicons should be of similar length (and not exceeding 200 bp) and located in separate exons to prevent genomic DNA amplification during the assay. To begin, we analyzed the primer sets used in previous studies: Otte et al. [16], Suzuki et al. [17], and Wang et al. [19]. The locations of these primers are shown in Figure 1. The primers used by Wang et al. [19] were excluded from our study because they were located within a single exon (specific for the male transcript). Primers specific for fem^F^ used by Otte et al. [16] and Suzuki et al. [17] fulfilled our criteria, but primers for fem^M^ produced excessively long amplicons (912 bp for femM3–femM4 primers and 458 bp for femM1–femM2 primers). We therefore designed new primers specific for the fem^M^ transcript (femM5 and femM6; see Tables in Section 4.3 and Table S1) to be used with existing primers but yielding shorter products.
The combinations of primers, reagents, and amplification conditions tested in this work are presented in Figure 2. Initially, we used commercial qPCR mastermixes, which unfortunately did not work with any of the primer sets. Consequently, we developed a custom master mix for Real-Time PCR to allow testing of different polymerases. The range of polymerases tested was limited due to our decision to include uracil-N-glycosylase and dUTP, aimed at eliminating carry-over contamination during the assays. The final composition of the reaction is provided in the Section 4. Using this mix, we successfully amplified the fem^F^ transcript only with the femF1 ↔ femF2 primer set. Unfortunately, the initially tested primer combinations (femM3 ↔ femM4 and femM1 ↔ femM2) did not amplify the fem^M^ transcript. We therefore extended the range of tested primer combinations and polymerases in standard PCR reactions. Eventually, we identified a working primer pair (femM1 and femM6; Tables in Section 4.3; Figure 2) in standard PCR; however, amplification failed when switching to Real-Time PCR. The key to solving this problem was the PCR conditions described in the study by Mukai et al. [20] recommending lowering the elongation temperature for amplification of AT-rich regions [20]. We found the 67 °C elongation temperature to be suitable for the amplification of fem^M^ transcript. Finally, we verified the specificity of reactions by means of the cloning and sequencing of the amplification products.
In summary, we found that: (a) our custom Real-Time PCR mix worked for both fem^F^ and fem^M^ transcripts, (b) the optimal elongation temperatures were 72 °C for fem^F^ and 67 °C for fem^M^, and (c) the primer pairs were of femF1 ↔ femF2 for fem^F^ and femM1 and femM6 for fem^M^. Another important observation was that, in contrast to the housekeeping gene rps5, both fem^F^ and fem^M^ cDNA are highly unstable during freezing and thawing cycles, as indicated by constantly and significantly increasing C(t) values. Therefore, we strongly recommend using the cDNA template for fem^F^ and fem^M^ amplification immediately after synthesis.
To evaluate the performance of the primer sets selected for quantitative analyses, standard curves were generated for fem^F^, fem^M^, and the reference gene rps5 using serial fivefold dilutions of cDNA (1/1, 1/5, 1/25, and 1/125). Each dilution point was analyzed in at least three technical replicates. Mean C(t) values and standard deviations were calculated for each point and used to construct linear regression curves (Figure 3, Table 1).
In accordance with the MIQE guidelines [21], assay performance was evaluated by determining amplification efficiency, linear dynamic range, and coefficient of determination (R^2^) for each primer set. All assays fulfilled MIQE criteria for quantitative Real-Time PCR, displaying linear amplification across the tested dilution range and efficiencies suitable for efficiency-corrected quantification. For all three assays (fem^F^, fem^M^, and rps5), amplification remained linear and precise across the tested dilution range. The lowest tested dilution (1/125) met the criteria for quantitative interpretation and was therefore considered the lower limit of quantification (LLOQ) of the assays. The efficiencies of all reactions were within the MIQE-recommended range, allowing for the use of three technical replicates in the assay (>80%). However, because amplification efficiencies differed among targets and were lower for the fem transcripts than for rps5, we decided not to use the simplified 2^−ΔΔC(t)^ method for relative expression analysis in subsequent experiments. Instead, each analysis included standard curves for every primer set.
To verify the suitability of rps5 as a reference gene, its C(t) values were examined across all developmental stages and both sexes. The mean C(t) values showed limited variation (CV mostly below 4%), indicating stable expression of rps5 and supporting its use for normalization (Table S2).
2.2. Expression Profile of Sex-Specific Fem Transcripts During Development
After establishing the working conditions for fem transcript amplification, we conducted a quantitative analysis of the expression levels of sex-specific fem transcripts during female and male development. To achieve this, RNA was isolated from single specimens representing eggs (E), larval stages 1–5 (L 1–5), and pupal stages 1–5 (P 1–5). Following reverse transcription, the resulting cDNA was amplified under the optimized conditions described above. The expression levels of fem transcripts were normalized to the expression of the house-keeping gene rps5. The results of this analysis are presented in Figure 4a,b, while the list of mean C(t) values obtained for each transcript is presented in Appendix A, Table A1.
The obtained data showed a clear difference in the expression of fem^F^ between females and males, regardless of the developmental stage (Figure 4a). The level of fem^F^ expression remained constant throughout development within each sex, with a slight but statistically insignificant increase observed in the later stages of female development. The difference in fem^F^ expression was approximately 100-fold higher in females than in males. In contrast, the difference in the expression level of the fem^M^ transcript between sexes was less pronounced (Figure 4b), averaging around 10-fold higher expression in males. Moreover, fem^M^ expression in females increased significantly across developmental stages, reaching in stages P3–P5 levels that were indistinguishable from those observed in males.
Employing qPCR analysis with quantification based on standard curves generated individually for each transcript and precisely quantifying the reaction efficiencies allowed us to determine not only the relative differences in the expression of each transcript between the sampled individuals, but also the differences in expression levels between the transcripts themselves. We have found that the expression of fem^M^ in males did not significantly differ from the expression of fem^F^ in females (approximately 2-fold less in males).
3. Discussion
While the general model that fem^F^ is female-biased and fem^M^ is male-biased has been established previously, the quantitative developmental dynamics of these transcripts have not been systematically analyzed.
Here, we provided results on quantitative expression values for fem^F^ and fem^M^ from different stages of honey bee development for drones and workers for the first time. The previously reported difficulties in amplifying and quantifying the fem transcript—specifically the fem^M^ variant [16]—may have been attributed to its overall low expression level, even in males. This could result from the presence of a premature stop codon in exon 3b, which may trigger the nonsense-mediated decay (NMD) pathway. NMD is a widely conserved surveillance mechanism in eukaryotes whose primary function is to reduce the abundance of erroneous mRNAs containing premature termination codons. However, our results are consistent with the possibility that the fem^M^ transcript is not efficiently degraded by the NMD pathway, since its expression level in males is not significantly lower than that of fem^F^ (the form lacking a premature stop codon) in females. Direct experimental verification of this possibility would require targeted inhibition of the NMD pathway, for example by combining transcript analysis with NMD inhibitors such as cycloheximide or by applying complementary approaches such as Northern blotting. Our experience gained during the optimization of fem transcript amplification points instead to technical rather than biological causes for the previously reported issues. The fem transcripts are AT-rich, with AT content exceeding 70% in the amplified regions and peaking at up to 90% within 40-nucleotide windows. AT-rich sequences are known to form secondary structures that can impede polymerase progression [22] and are more prone to strand breakage [23]. We assume that issues related to cDNA stability and polymerase processivity become even more pronounced when amplifying relatively long amplicons, as reported previously [16]. Furthermore, when comparing the expression levels of two transcripts using qPCR, it is advantageous to use amplicons of similar length to avoid artefacts arising from differences in RNA or cDNA stability. The primer set for fem^M^ that ultimately proved successful in our hands produced a 168 bp amplicon, closely matching the length of the fem^F^ amplicon (177 bp), though with a higher AT content (78% vs. 71%). This difference in AT content may explain why fem^M^ amplification was only possible at a lower extension temperature.
Our data on the expression profile of sex-specific fem transcripts generally corroborate the prevailing view that the fem^F^ transcript is female-specific, as we observed its expression to be approximately 100-fold higher in females than in males. However, we consistently detected fem^F^ transcripts in males, raising questions about the mechanism underlying fem^F^ splicing in the absence of a heterozygous csd genotype. As shown in Appendix A, Table A1, the C(t) values for fem^F^ transcripts in males averaged around 33 cycles, which may explain the detection of fem^F^ transcripts in males (or cells homozygous for csd) reported by Suzuki [17], who used 35 amplification cycles, thereby exceeding this detection threshold. It is also possible that the level of fem expression from the transgenes used in that study was much higher than under natural conditions, rendering the 35-cycle point unsuitable for quantitative comparison. Our observations regarding the expression profile of fem^M^ contradict those reported by Suzuki et al. [17], as we did not observe the lack of fem^M^ in females. Moreover, the difference in fem^M^ expression between females and males was considerably smaller (~10-fold) than that observed for fem^F^.
It is particularly interesting that the findings of Suzuki et al. [17] indicate that, in the absence of csd, the fem transcript is not processed into either the male- or female-specific form. According to their results, the presence of a single csd allele was sufficient to produce processed fem transcripts, suggesting that CSD homotrimers are functional and required for the formation of the male-specific fem transcript. This interpretation stands in contrast to the results of Gempe et al. [15], who reported that the absence of csd leads directly to male-specific fem splicing. However, those experiments relied on RNAi-mediated knockdown in female embryos, a method that may leave residual csd expression. If low levels of CSD protein were still present, homotrimers—assumed to form more readily than heterotrimers—could have assembled and, assuming such homotrimers are indeed functional, driven male-specific fem splicing. The possibility that CSD homotrimers actively generate male-specific fem transcripts may also help explain the relatively high expression of fem^M^ we observed in females, as the heterozygous (female) csd genotype does not preclude the formation of CSD homotrimers in embryonic cells. Furthermore, the gradual decrease in csd expression during development could allow homotrimers to predominate at later stages [1], which is consistent with the increased fem^M^ expression in female pupae observed in our study. It is possible that the presence of the male splice variant in females represents background splicing noise occurring when regulatory control becomes less stringent at later developmental stages, or that it reflects an as yet unidentified regulatory function of the male transcript. However, we believe that the interpretation of fem transcript expression should not be considered independently of CSD activity. The formation of different CSD trimer configurations provides a plausible mechanistic framework linking the observed expression patterns with the molecular regulation of sex-specific splicing. Admittedly, these conclusions remain highly speculative and require validation through rigorous double-allele csd knockout experiments, which would definitively clarify whether CSD homotrimers are capable of driving male-specific fem splicing in vivo.
Although the analyzed individuals were collected from several honey bee colonies and randomly selected for the experiments, the samples originated from a single regional population. Therefore, the observed expression patterns should be confirmed in future studies using honey bee populations from other geographic regions. Such comparative analyses could help determine whether the developmental dynamics of fem transcripts observed here represent a general feature of Apis mellifera biology.
In summary, our data demonstrate that sex-specific fem transcripts are not strictly limited to a given sex in honey bees. While fem^F^ is highly specific for females, showing approximately 100-fold higher expression in females than in males, fem^M^ is less sex-specific, with only about 10-fold higher expression in males than in females even at early developmental stages. These findings have important implications for interpreting experiments on sex-determination pathways and transgenic studies, emphasizing that accurate sex assignment based on fem expression should rely on quantitative methods, and that the utility of assessing fem^M^ expression may be reduced in the later stages of development.
4. Materials and Methods
4.1. Sample Collection
Biological material was obtained from several honey bee colonies headed by naturally inseminated 1-year-old queens. Individuals at different developmental stages were identified based on morphological characteristics, sampled and placed in separate tubes, immediately immersed in TRIzol reagent, and stored at −80 °C. Samples were collected for eggs (E), larvae stages 1 to 5 (L 1–5), prepupae (PP), and pupae stages 1 to 5 (P 1–5).
4.2. RNA Isolation
Total RNA was isolated using the standard TRIzol method [24], applying reagent volume according to the sample type (E—250 µL, L1–L3—500 µL, L4–L5—1000 µL of TRIzol reagent) and scaling the volume of other reagents accordingly. For larval stages L4 and L5, half of the larval body was used for RNA extraction, while for pupae RNA was isolated separately from the thorax and the abdomen. RNA concentration and purity were measured using a NanoDrop One spectrophotometer (Thermo Fisher Scientific, Madison, WI, USA), and RNA integrity was verified by agarose gel electrophoresis. Up to 2 µg of RNA was used to synthesize cDNA using MultiScribe™ Reverse Transcriptase (Thermo Fisher Scientific Baltics UAB, Vilnius, Lithuania) according to the manufacturer’s instructions. The resulting cDNA was diluted twofold with ultrapure water and stored at −80 °C. Each developmental stage was represented by three independent biological samples. Individuals were randomly selected from a larger pool of samples originating from several honey bee colonies.
4.3. Real-Time RT-PCR
Table 2 lists all the oligonucleotide primers tested in this study. The primer pairs ultimately used for quantitative analysis are shown in bold. Throughout this study, numerous amplification conditions were tested, and the rationale for establishing the final workflow is presented in the Section 2. To maintain clarity, this section only describes the conditions that were found to be effective and used in the final analyses.
The following reagents were used to create a custom mix for Real-Time RT-PCR amplification: Taq polymerase buffer (1× concentration, Dream Taq buffer Thermo Fisher Scientific Baltics UAB, Vilnius, Lithuania), 0.5 µM of each primer, 0.2 mM dCTP, dGTP, dATP, 0.4 mM dUTP (Jena Bioscience GmbH, Jena, Germany), 0.004 U/µL uracil-N-glycosylase (Jena Bioscience GmbH, Jena, Germany), 0.5 µM EvaGreen (Jena Bioscience GmbH, Jena, Germany), 0.05 µM ROX (Jena Bioscience GmbH, Jena, Germany), 0.05 U/µL Taq polymerase (EURx Ltd. Gdańsk, Poland), and 1 µL of cDNA. The reaction was performed in a total volume of 10 µL.
Amplification was performed using QuantStudio 3 Real-Time PCR System (Thermo Fisher Scientific, Singapore) under the following cycling conditions (Table 3):
C(t) values were determined after establishing a constant threshold level for all genes and all replicates. For each biological sample included in the analysis, a corresponding no-reverse transcription control (RT−) was prepared and processed in parallel with the cDNA samples. RT− controls were subjected to Real-Time PCR alongside their matched cDNA counterparts using identical reaction conditions and primer sets. Data were analyzed using standard curves generated from single-template reactions and normalized to the reference gene rps5. Statistical analysis was performed using the non-parametric Kruskal–Wallis test followed by pairwise Mann–Whitney post hoc tests. For better visualization of group differences, data were log_2_-transformed prior to plotting.
4.4. Cloning and Sequencing of the Amplification Products
The amplification products were cloned into pJET 1.2 vector contained in the CloneJET PCR Cloning Kit (Thermo Fisher Scientific Baltics UAB, Vilnius, Lithuania) according to the manufacturer’s recommendations and having performed blunting of the amplicons prior to ligation. The ligation products were transformed into a chemicompetent bacterial strain of E. coli. Single colonies were picked and used directly in a PCR reaction (30 cycles, 52 °C annealing) using pJET1.2F and pJET1.2R primers. The amplification product was digested with alkaline phosphatase (0.25 U, Thermo Fisher Scientific Baltics UAB, Vilnius, Lithuania) and exonuclease I (0.5 U, Thermo Fisher Scientific Baltics UAB, Vilnius, Lithuania) for 30 min at 37 °C. The enzymes were inactivated by denaturation (5 min, 95 °C). One of the DNA was used in cycle sequencing reaction (10 µL) containing 1.9 µL 5× sequencing buffer, 0.5 µL BigDye Terminator Cycle Sequencing mix (Thermo Fisher Scientific Baltics UAB, Vilnius, Lithuania) and 0.65 µL 5 µM of either pJET1.2F or pJET1.2R primer. The sequencing products were purified using Sephadex G-50 columns, denatured and subjected to capillary electrophoresis (ABI Prism 310, PE Applied Biosystems, Foster City, CA, USA). Data were analyzed using ABI Sequence Analysis software (v3.3).
The reference list from the paper itself. Each links out to its DOI / PubMed record.
- 1Beye M. Hasselmann M. Fondrk M.K. Page R.E. Omholt S.W. The Gene csd Is the Primary Signal for Sexual Development in the Honeybee and Encodes an SR-Type Protein Cell 200311441942910.1016/S 0092-8674(03)00606-812941271 · doi ↗ · pubmed ↗
- 2Beye M. The Dice of Fate: The csd Gene and How Its Allelic Composition Regulates Sexual Development in the Honey Bee, Apis mellifera Bio Essays 2004261131113910.1002/bies.2009815382141 · doi ↗ · pubmed ↗
- 3Woyke J. What Happens to Diploid Drone Larvae in a Honeybee Colony J. Apic. Res.19632737510.1080/00218839.1963.11100063 · doi ↗
- 4Beye M. Seelmann C. Gempe T. Hasselmann M. Vekemans X. Fondrk M.K. Page R.E. Gradual Molecular Evolution of a Sex Determination Switch through Incomplete Penetrance of Femaleness Curr. Biol.2013232559256410.1016/j.cub.2013.10.07024316208 · doi ↗ · pubmed ↗
- 5Beye M. Gattermeier I. Hasselmann M. Gempe T. Schioett M. Baines J.F. Schlipalius D. Mougel F. Emore C. Rueppell O. Exceptionally High Levels of Recombination across the Honey Bee Genome Genome Res.2006161339134410.1101/gr.568040617065604 PMC 1626635 · doi ↗ · pubmed ↗
- 6Cho S. Huang Z.Y. Green D.R. Smith D.R. Zhang J. Evolution of the Complementary Sex-Determination Gene of Honey Bees: Balancing Selection and Trans-Species Polymorphisms Genome Res.2006161366137510.1101/gr.469530617065615 PMC 1626638 · doi ↗ · pubmed ↗
- 7Hasselmann M. Beye M. Signatures of Selection among Sex-Determining Alleles of the Honey Bee Proc. Natl. Acad. Sci. USA 20041014888489310.1073/pnas.030714710115051879 PMC 387344 · doi ↗ · pubmed ↗
- 8Lechner S. Ferretti L. Schöning C. Kinuthia W. Willemsen D. Hasselmann M. Nucleotide Variability at Its Limit? Insights into the Number and Evolutionary Dynamics of the Sex-Determining Specificities of the Honey Bee Apis mellifera Mol. Biol. Evol.20143127228710.1093/molbev/mst 20724170493 PMC 3907057 · doi ↗ · pubmed ↗