MyD88 Inhibition Ameliorates Diabetes-Induced Hepatic Inflammation and Gluconeogenesis Through Adipose IL-10 Induction
Yi-Cheng Li, Hsiao-Chi Lai, Pei-Hsuan Chen, Chia-Hua Tang, Lee-Wei Chen

TL;DR
Blocking MyD88 reduces liver inflammation and glucose production in diabetes by boosting IL-10 in fat tissue.
Contribution
MyD88 inhibition or adipose IL-10 elevation is proposed as a novel strategy for metabolic syndrome.
Findings
MyD88 deletion in diabetic mice increased IL-10 and reduced liver inflammation and gluconeogenesis.
Adipose IL-10 injection improved glucose tolerance and suppressed inflammatory signaling in the liver.
MyD88 signaling reduces IL-10 and Foxp3 in adipose tissue, worsening diabetes-related metabolic issues.
Abstract
Myeloid differentiation factor 88 (MyD88) signaling plays a central role in inflammatory pathway activation. Adipose-derived interleukin-10 (IL-10), which is induced by insulin and lipopolysaccharides, suppresses hepatic glucose production. This study investigated the role of MyD88/IL-10 signaling in diabetes-induced systemic inflammation and hepatic gluconeogenesis. Stromal vascular fractions (SVFs) were isolated from the adipose tissue of Leprdb/db and Leprdb/dbMyD88−/− mice and treated with IL-10 followed by analysis of inflammatory cytokine expression. IL-10 (10 or 50 ng) was injected into adipose tissue of type 2 DM (T2DM) (Leprdb/db) mice to investigate its effect on blood dipeptidyl peptidase-4 (DPP4) activity, insulin resistance, and hepatic gluconeogenic signaling. Hepatic inflammatory markers, gluconeogenic gene expression, and metabolic parameters were assessed. Compared with…
Genes, proteins, chemicals, diseases, species, mutations and cell lines named across the full text — each resolved to its canonical identifier and authoritative record.
Click any figure to enlarge with its caption.
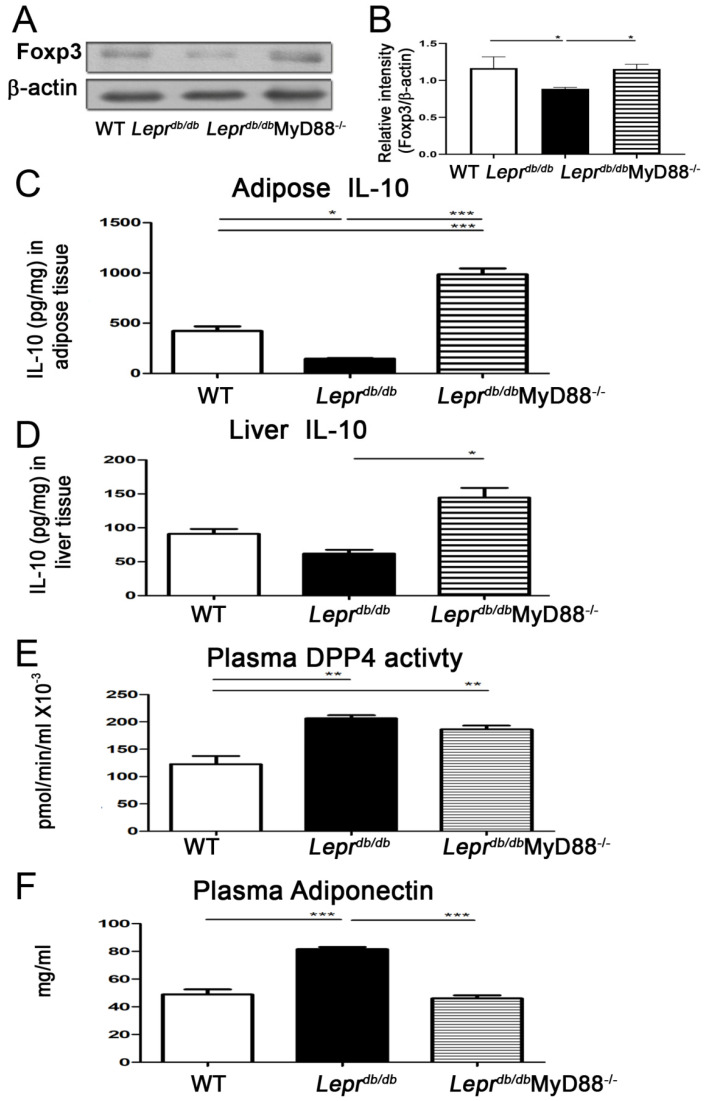 Figure 1
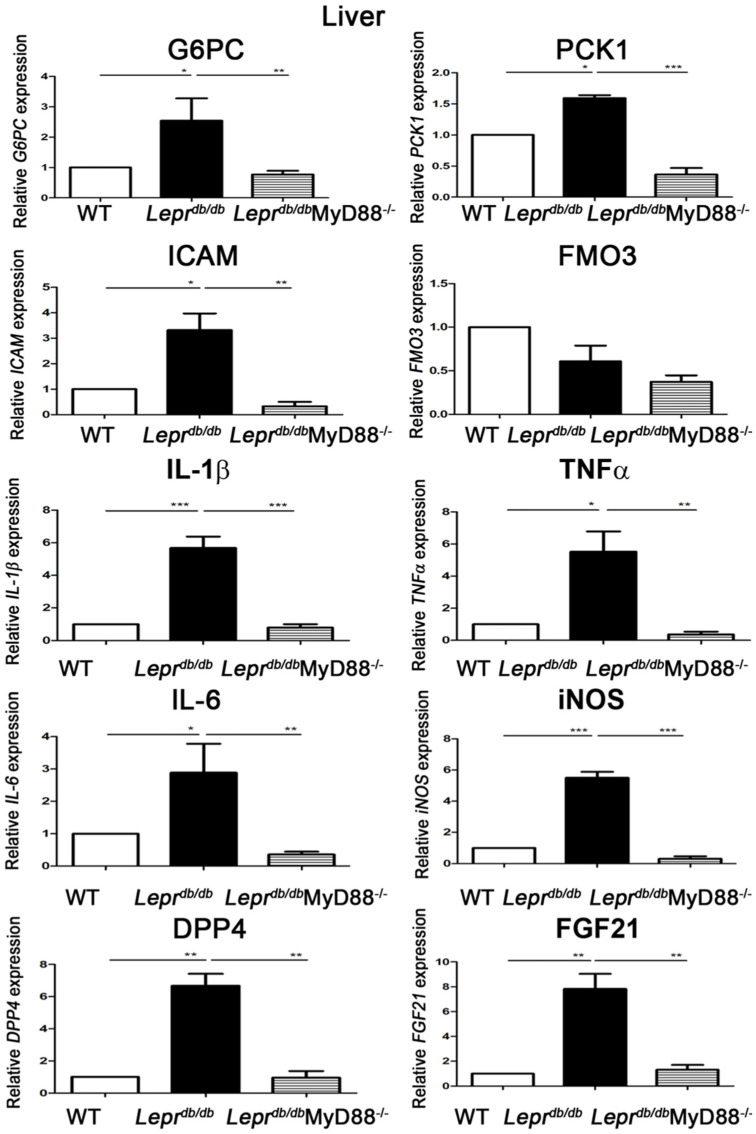 Figure 2
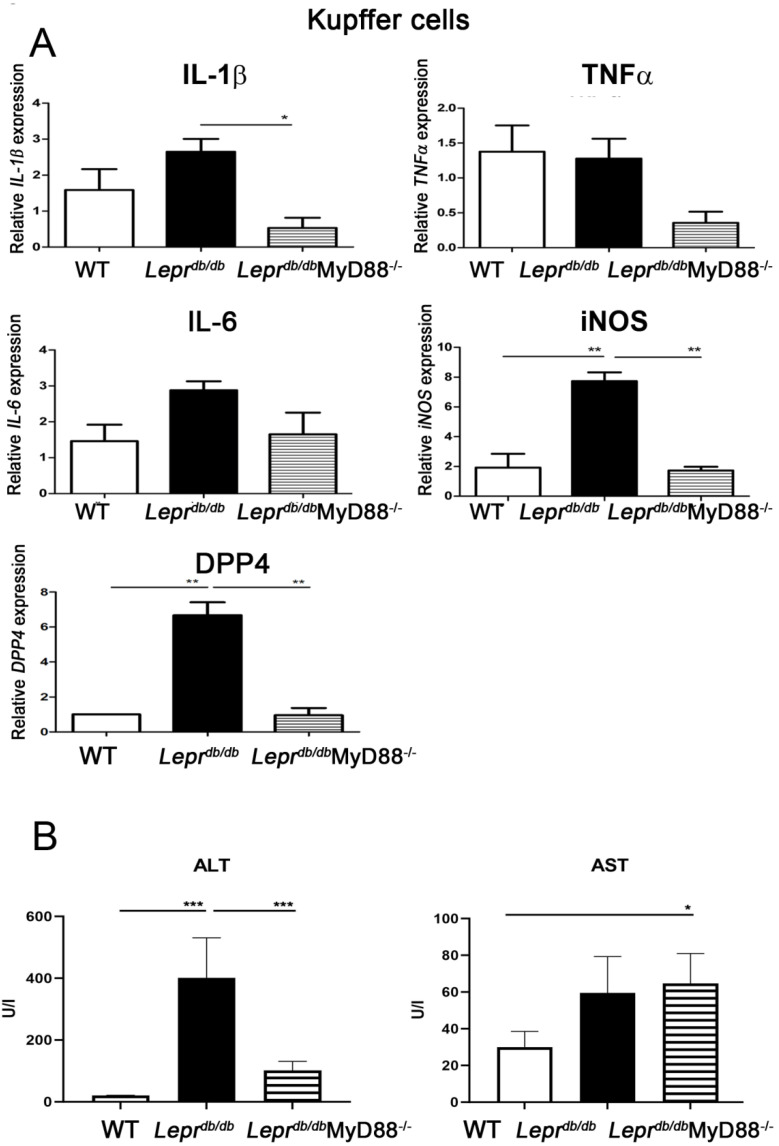 Figure 3
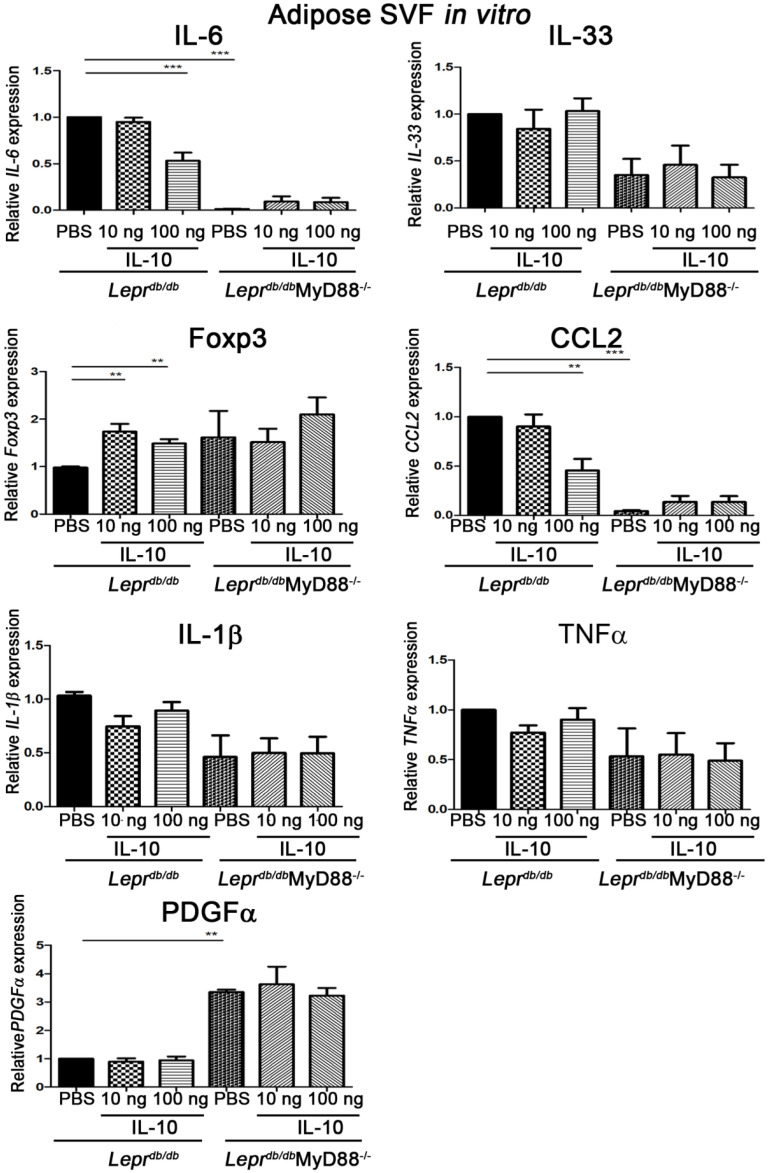 Figure 4
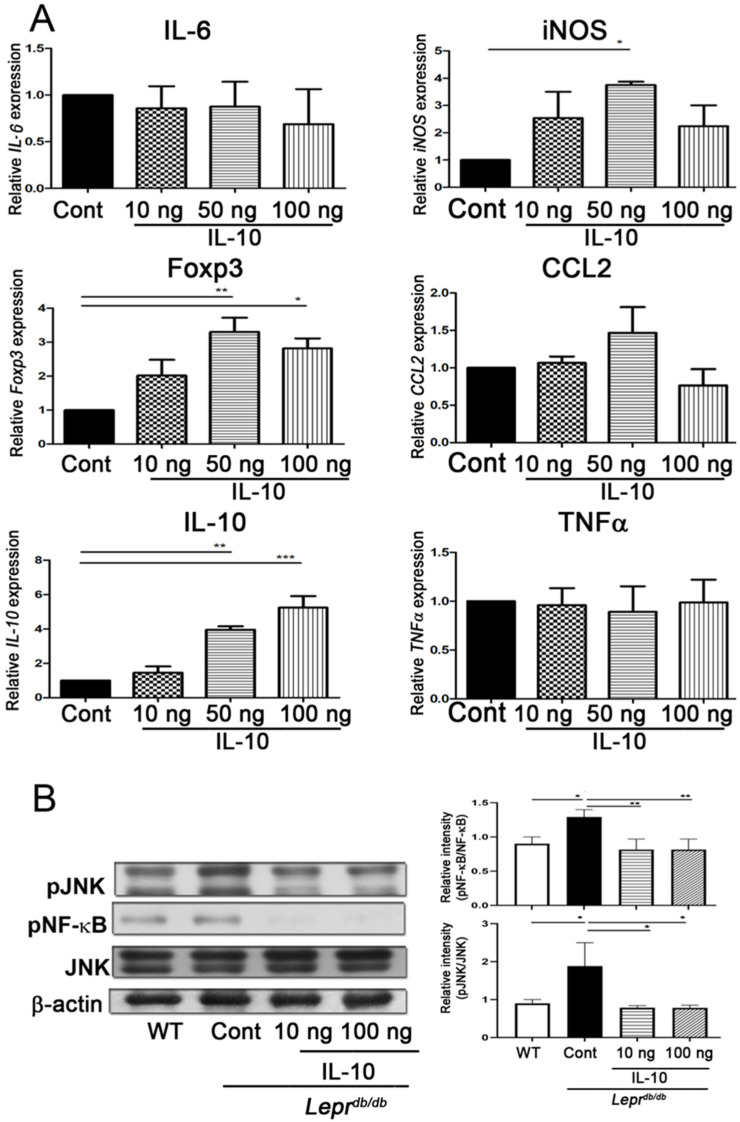 Figure 5
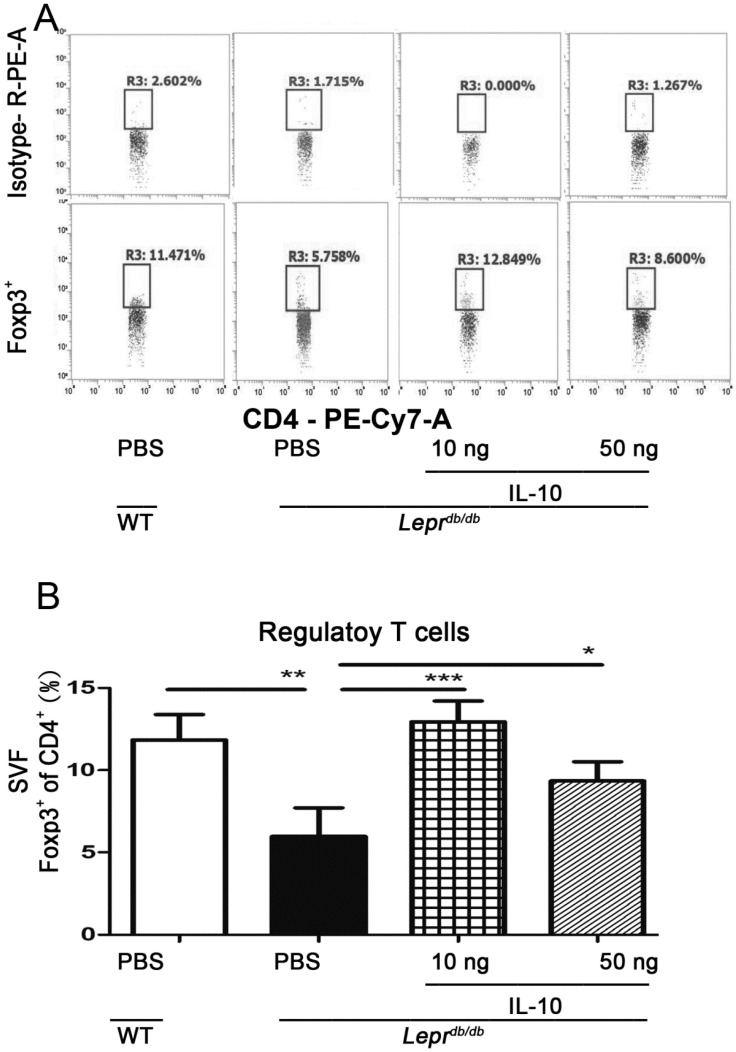 Figure 6
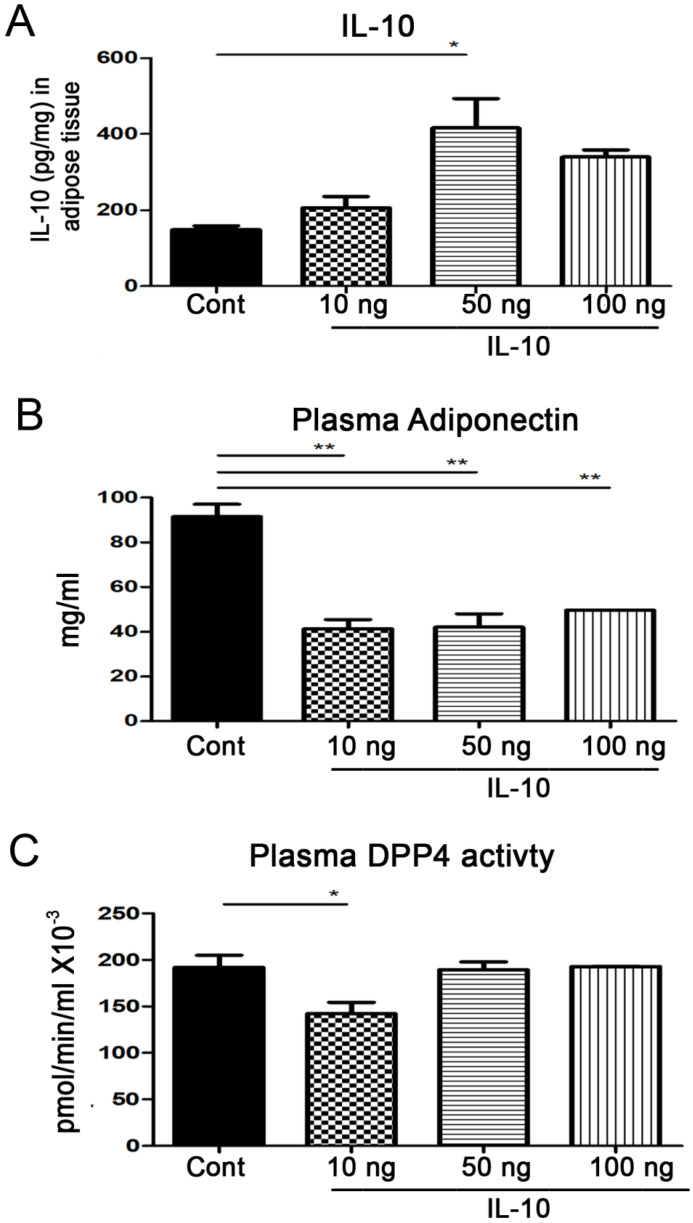 Figure 7
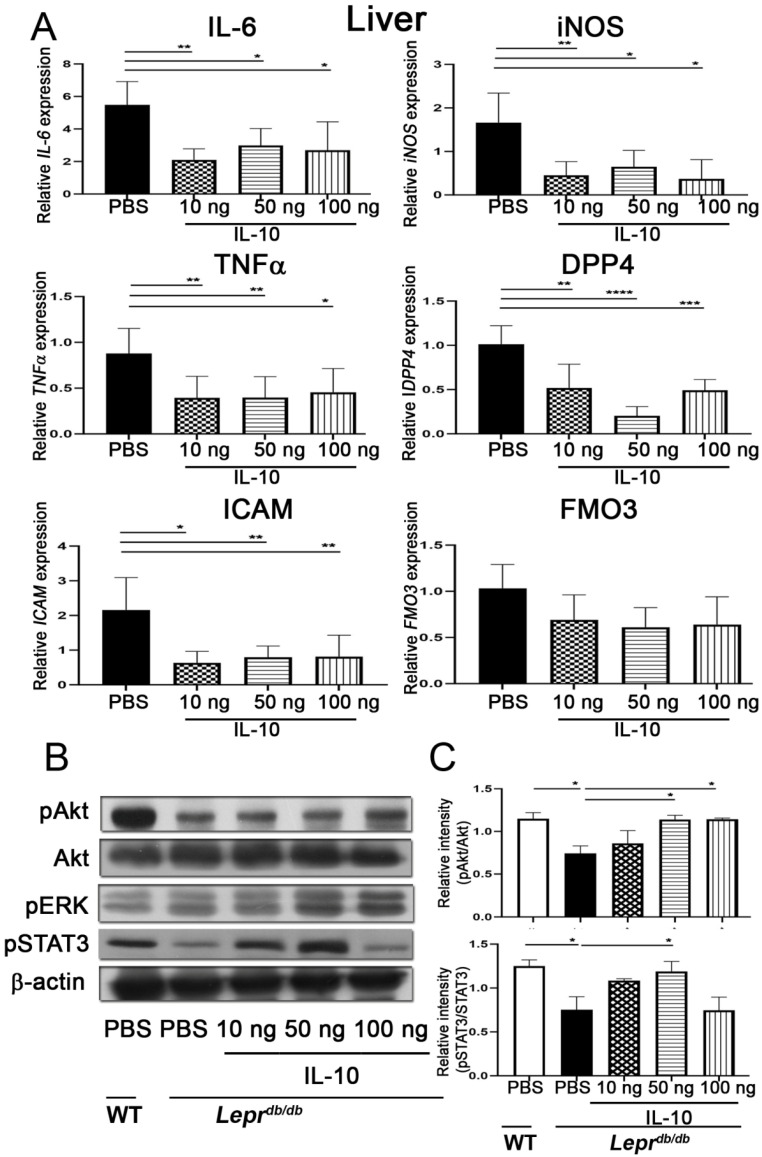 Figure 8
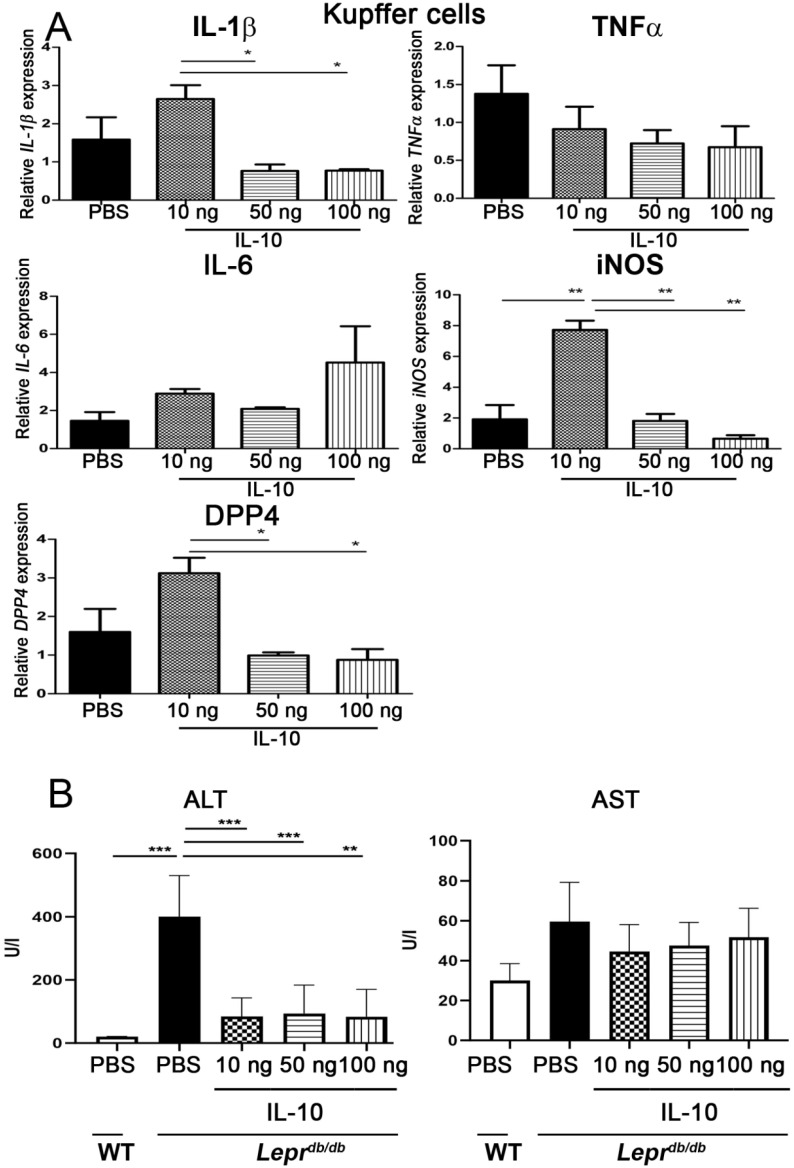 Figure 9
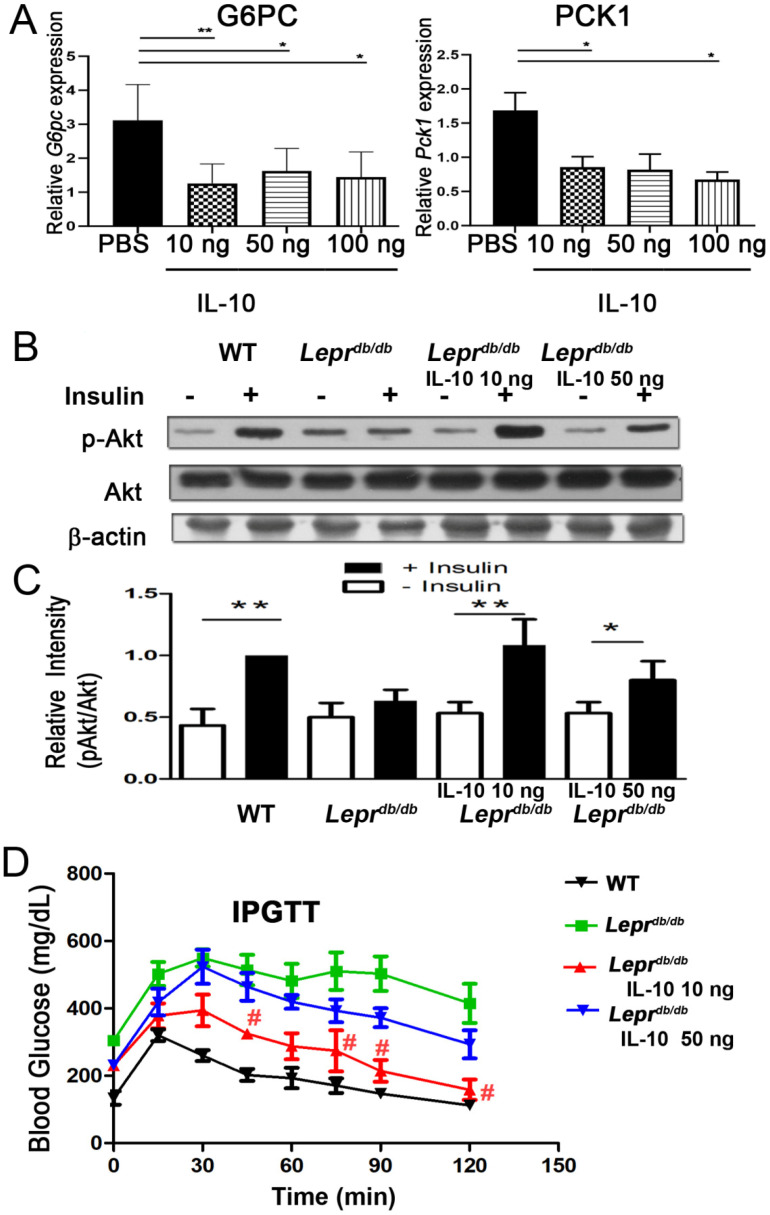 Figure 10
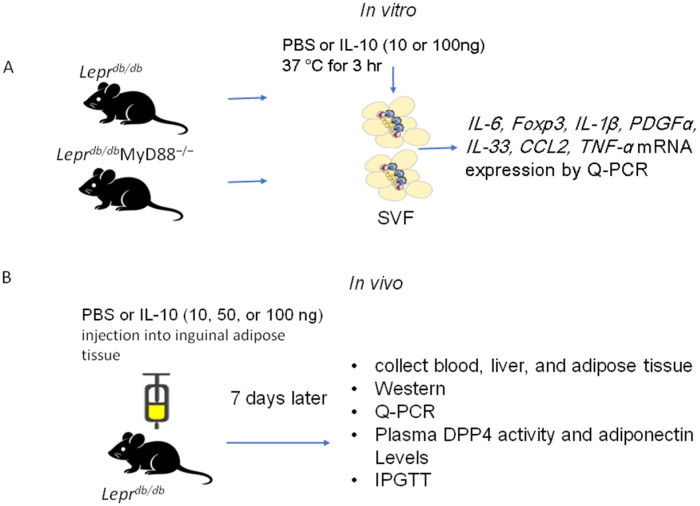 Figure 11
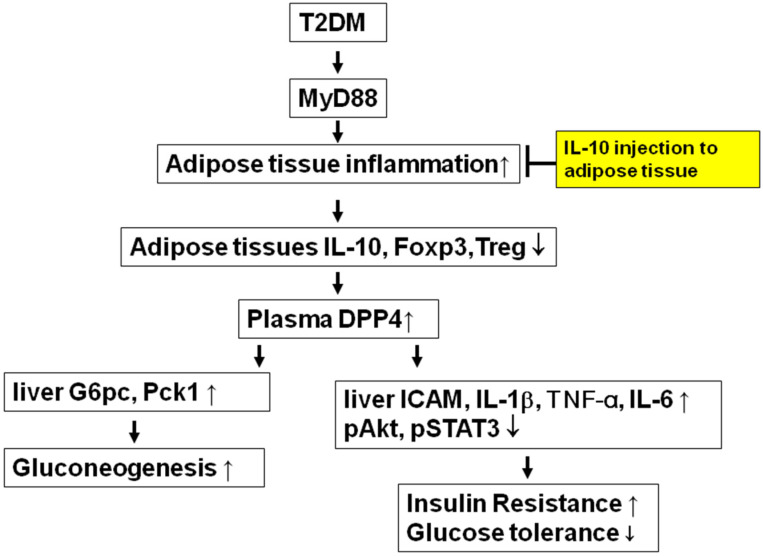 Figure 12
- —National Science Council MOST
- —Kaohsiung Veterans General Hospital
- —Zuoying Armed Forces General Hospital
Peer Reviews
No public reviews on file for this paper yet. If you reviewed it on a platform where reviews are public (OpenReview, ICLR, NeurIPS, ICML), you can paste yours below so the community can read it here.
Videos
No videos yet. Explain this paper in a talk, walkthrough, or lecture? Add one.
Taxonomy
TopicsAdipokines, Inflammation, and Metabolic Diseases · Diabetes and associated disorders · Advanced Glycation End Products research
1. Introduction
Obesity and its associated insulin resistance represent major global health challenges and are key contributors to chronic diseases such as cardiovascular disorders and type 2 diabetes mellitus (T2DM). Impaired tissue responsiveness to insulin in obesity has been closely linked to defective insulin signaling driven by systemic low-grade inflammation [1]. Accumulating evidence demonstrates that inflammatory pathways play a critical role in the pathogenesis of obesity-related metabolic disorders. In particular, white adipose tissue (WAT) from individuals with obesity exhibits a pronounced inflammatory phenotype, characterized by extensive infiltration of immune cells, including macrophages, lymphocytes, and dendritic cells [2,3]. This chronic inflammatory microenvironment within WAT contributes to metabolic dysregulation and the development of insulin resistance. Myeloid differentiation factor 88 (MyD88) is a central adaptor protein for Toll-like receptor (TLR) and interleukin-1 receptor (IL-1R) signaling and is a key mediator of inflammatory pathway activation. Activation of the TLR4/MyD88/NF-κB axis stimulates the production of proinflammatory cytokines such as tumor necrosis factor-α (TNF-α), interleukin-6 (IL-6), and monocyte chemoattractant protein-1 (MCP-1), thereby promoting metabolic inflammation and T2DM-related complications [4]. In patients with T2DM, elevated expression of phosphorylated IL-1R-associated kinase 1, TLR4, MyD88, and downstream inflammatory mediators has been detected in circulating monocytes, further supporting the involvement of MyD88-dependent inflammatory signaling in diabetes pathogenesis [5]. However, studies in high-fat-diet-fed MyD88-deficient mice have reported paradoxical metabolic disturbances, including hyperinsulinemia, dyslipidemia, hyperleptinemia, and liver dysfunction, suggesting a complex and context-dependent role of MyD88 in metabolic regulation [6]. Thus, the precise functions of MyD88 signaling in adipose tissue inflammation and diabetes-associated metabolic complications remain incompletely understood.
Interleukin-10 (IL-10) is a pleiotropic anti-inflammatory cytokine produced by multiple immune cell types. Myeloid dendritic cells and macrophages express IL-10 upon activation of MyD88- and TRIF-dependent TLR pathways, including TLR3 and TLR4, in response to double-stranded RNA and lipopolysaccharide (LPS), respectively [7]. Endogenous IL-10 has been shown to exert protective effects against diet-induced hepatic insulin resistance [8]. Conversely, suppression of IL-10 enhances proinflammatory cytokine expression, exacerbates insulin signaling defects, and activates gluconeogenic and lipogenic pathways [8]. Notably, adipose tissue macrophage-derived IL-10, induced by insulin and LPS, suppresses hepatic glucose production in coordination with insulin signaling [9]. These findings suggest that dysregulation of IL-10 production in adipose tissue may represent a critical mechanistic link between inflammation and hepatic gluconeogenesis in T2DM.
Regulatory T cells (Tregs), defined by the expression of the transcription factor forkhead box P3 (Foxp3), play a pivotal role in maintaining immune homeostasis and preventing excessive inflammatory responses [10]. A substantial population of Tregs resides within adipose tissue, where they contribute to the suppression of local inflammation and preservation of metabolic homeostasis [10]. However, whether MyD88-dependent inflammatory signaling modulates adipose Treg homeostasis and IL-10 production to regulate hepatic inflammation and gluconeogenesis in diabetes remains unclear. In this study, we investigate the role of MyD88 signaling in regulating adipose IL-10 production, Treg homeostasis, hepatic inflammation, and gluconeogenesis in diabetes mellitus. We hypothesized that MyD88 activation promotes hepatic inflammation and gluconeogenesis by suppressing adipose-derived IL-10 and Foxp3-expressing Tregs in T2DM. To test this hypothesis, we used MyD88 deficiency in a leptin receptor gene mutation mouse model and examined adipose immune responses, hepatic inflammatory signaling, insulin resistance, and gluconeogenic gene expression in a diabetic context. In addition, we administered IL-10 directly into adipose tissue and evaluated its effects on inflammatory gene expression, Treg abundance, circulating dipeptidyl peptidase-4 activity, adiponectin levels, hepatic Akt activation, gluconeogenic gene expression, and glucose tolerance in a T2DM mouse model. Our findings provide mechanistic insight into the MyD88/IL-10 axis in adipose–liver crosstalk and suggest that targeting this pathway may represent a novel therapeutic strategy for metabolic syndrome.
2. Results
2.1. Leprdb/dbMyD88−/− Mice Exhibited Increased IL-10 Levels and Foxp3 Expression in Adipose Tissue SVFs and Reduced Circulating Adiponectin and DPP4 Activity
Adipose tissue, liver, and blood were collected from Lepr^+/+^, Lepr^db^^/db^, and Lepr^db^^/db^MyD88^−/−^ mice to examine the effects of MyD88 deficiency on FOXp3 expression in stromal vascular fractions (SVFs), IL-10 levels in adipose tissue and liver, and circulating adiponectin levels and DPP4 activity. SVFs from Lepr^db^^/db^ mice showed significantly reduced Foxp3 protein expression compared with Lepr^+/+^ mice (Figure 1A,B and Figure S1). In addition, Lepr^db^^/db^ mice exhibited decreased IL-10 levels in adipose tissue and increased plasma DPP4 activity and adiponectin levels (Figure 1C–F). In contrast, Lepr^db^^/db^MyD88^−/−^ mice demonstrated significantly increased Foxp3 expression in SVFs and elevated IL-10 levels in both adipose tissue and liver compared with Lepr^db^^/db^ mice (Figure 1A–D). Moreover, MyD88 deficiency significantly reduced circulating adiponectin levels in diabetic mice (Figure 1F). These results indicate that T2DM suppresses adipose Foxp3 and IL-10 expression while increasing plasma DPP4 activity and adiponectin levels, and that MyD88 deletion reverses these alterations.
2.2. Leprdb/dbMyD88−/− Mice Displayed Reduced Hepatic Inflammatory and Gluconeogenic Gene Expression
To evaluate hepatic inflammatory and metabolic gene regulation, liver tissues were analyzed by Q-PCR. Lepr^db^^/db^ mice exhibited significantly elevated mRNA expression of ICAM, IL-1β, TNF-α, IL-6, iNOS, DPP4, FGF21, G6pc, and Pck1 compared with Lepr^+/+^ mice (Figure 2). In contrast, Lepr^db^^/db^MyD88^−/−^ mice showed marked reductions in all of these transcripts relative to Lepr^db^^/db^ mice (Figure 2). These findings indicate that MyD88 signaling is a critical contributor to hepatic inflammation and gluconeogenesis in T2DM.
2.3. MyD88 Deficiency Reduced Inflammatory Gene Expression in Kupffer Cells and Improved Liver Function
Kupffer cells isolated from Lepr^db^^/db^ mice demonstrated significantly increased iNOS and DPP4 mRNA expression compared with Lepr^+/+^ mice (Figure 3A). MyD88 deletion significantly reduced IL-1β, iNOS, and DPP4 expression in Kupffer cells relative to Lepr^db^^/db^ mice. Consistently, serum ALT levels were elevated in Lepr^db^^/db^ mice and significantly reduced in Lepr^db^^/db^MyD88^−/−^ mice (Figure 3B), indicating improved liver function.
2.4. SVFs from Leprdb/dbMyD88−/− Mice Exhibited Reduced Inflammatory Cytokines and Increased PDGFα Expression and IL-10 Treatment Recapitulated These Effects
SVFs from Lepr^db^^/db^MyD88^−/−^ mice displayed significantly reduced IL-6 and CCL2 expression and increased PDGFα mRNA levels compared with Lepr^db^^/db^ mice (Figure 4). In vitro IL-10 treatment of SVFs from Lepr^db^^/db^ mice significantly increased Foxp3 expression at 10 ng and reduced IL-6 and CCL2 while augmenting Foxp3 at 100 ng (Figure 4). In contrast, IL-10 treatment did not further alter cytokine expression in SVFs from Lepr^db^^/db^MyD88^−/−^ mice. These findings indicate that MyD88 signaling mediates proinflammatory cytokine expression in adipose SVFs and that IL-10 suppresses inflammation and promotes Foxp3 expression via a MyD88-dependent mechanism.
2.5. IL-10 Injection Enhanced Foxp3 and IL-10 Expression and Suppressed JNK and NF-κB Signaling in Adipose SVFs
In vivo injection of IL-10 into adipose tissue of Lepr^db/db^ mice significantly increased Foxp3 and IL-10 mRNA expression at doses of 50 and 100 ng (Figure 5A). Moreover, 10 ng IL-10 significantly reduced pJNK and pNF-κB protein levels in SVFs (Figure 5B and Figure S2). These results demonstrate that IL-10 suppresses inflammatory signaling pathways in diabetic adipose tissue.
2.6. IL-10 Promoted CD4+ Regulatory T-Cell Accumulation in Adipose Tissue
IL-10 induction promotes Treg differentiation [11]. Flow cytometry analysis revealed a significant increase in CD4^+^ Foxp3^+^ Tregs in adipose tissue of Lepr^db/db^ mice receiving IL-10 (10 or 50 ng) compared with PBS-treated controls (Figure 6A,B). This effect indicates that IL-10 administration increases CD4^+^ Tregs in SVFs from the adipose tissue of T2DM.
2.7. IL-10 Injection Reduced Circulating Adiponectin and DPP4 Activity
Injection of 50 ng IL-10 significantly increased adipose IL-10 levels (Figure 7A). IL-10 administration at 10, 50, and 100 ng significantly reduced circulating adiponectin levels compared with PBS controls (41.34 ± 4.22, 42.12 ± 5.99, or 49.72 ± 6.12 vs. 91.47 ± 5.56 pg/mL) (Figure 7B). In addition, 10 ng IL-10 significantly lowered plasma DPP4 activity (148.3 ± 10.59 vs. 193.1 ± 9.11 pmol/min/mL × 10^−3^) (Figure 7C), indicating systemic metabolic improvement.
2.8. IL-10 Reduced ICAM, TNF-α, IL-6, DPP4, and iNOS mRNA Expression and Increased pAkt and pERK Levels in the Liver
PBS or 10, 50, and 100 ng of IL-10 were injected into adipose tissue of T2DM (Lepr^db/db^) mice, and the liver was harvested 7 days after injection to further examine whether IL-10 injection decreased inflammatory cytokines mRNA expression of the liver. IL-10 injection at 10, 50, or 100 ng significantly decreased ICAM, TNF-α, IL-6, DPP4, and iNOS mRNA expression of the liver in Lepr^db/db^ mice compared with PBS injection (Figure 8A). T2DM (Lepr^db/db^) mice demonstrated a significant decrease in pAkt protein and pSTAT3 protein expression in the liver compared with Lepr^+/+^ mice. IL-10 injection at 100 ng into adipose tissue of T2DM (Lepr^db/db^) mice significantly increased pAkt and pERK protein expression in the liver compared with PBS injection group (Figure 8B,C and Figure S3). Collectively, our results reveal that IL-10 injection into adipose tissue reduces inflammatory cytokines mRNA expression and increases pAkt and pERK levels in the liver of a T2DM mouse model.
2.9. IL-10 Reduced Inflammatory Gene Expression in Kupffer Cells and Improved Liver Function
IL-10 administration significantly reduced IL-1β, iNOS, and DPP4 mRNA expression in Kupffer cells at 10 and 50 ng compared with PBS (Figure 9A). Serum ALT levels were significantly reduced at all IL-10 doses (Figure 9B), demonstrating improved hepatic function.
2.10. IL-10 Reduced Hepatic Gluconeogenic Gene Expression
PBS or 10, 50, and 100 ng of IL-10 were injected into adipose tissue of T2DM (Lepr^db/db^) mice, and the liver was harvested 7 days after injection to further examine whether IL-10 injection decreased gluconeogenesis-related gene mRNA expression of the liver. IL-10 injection at 50 ng significantly reduced hepatic G6pc and Pck1 mRNA expression (Figure 10A). Collectively, our results reveal that IL-10 injection into adipose tissue reduces hepatic G6pc and Pck1 mRNA expression.
2.11. IL-10 Enhanced Insulin Sensitivity and Improved Glucose Tolerance in Diabetic Mice
Lepr^db/db^ mice showed impaired hepatic Akt phosphorylation after insulin stimulation compared with Lepr^+/+^ mice (Figure 10B,C and Figure S4). IL-10 treatment at 10 ng restored insulin-induced Akt activation. During glucose tolerance testing, Lepr^db/db^ mice displayed sustained hyperglycemia, whereas 10 ng IL-10 significantly improved glucose clearance. The 50 ng dose produced only modest improvement (Figure 10D). These findings indicate that adipose IL-10 enhances systemic insulin sensitivity and glucose tolerance in T2DM.
3. Discussion
Previous studies have demonstrated that activation of the TLR4/MyD88/NF-κB signaling pathway induces the production of proinflammatory cytokines, including TNF-α, IL-6, IL-8, and MCP-1, thereby contributing to cardiovascular and hepatic complications in T2DM models [4]. However, paradoxically, MyD88-deficient mice subjected to a high-fat diet have also been reported to develop hyperinsulinemia, hyperleptinemia, hypercholesterolemia, and liver dysfunction, suggesting a context-dependent role of MyD88 in metabolic regulation [6]. In the present study, we aimed to clarify the role of MyD88 signaling in diabetes-associated hepatic inflammation and gluconeogenesis using *Lepr^db/db^*MyD88^−/−^ mice. Our findings demonstrate that T2DM induces adipose and hepatic inflammation, elevates circulating ALT and DPP4 activity, and suppresses adipose Foxp3 expression and IL-10 production in a MyD88-dependent manner. Importantly, genetic deletion of MyD88 markedly reversed these pathological alterations, indicating that MyD88 signaling is a central regulator of metabolic inflammation in T2DM.
We first demonstrated that MyD88 signaling plays a critical role in mediating diabetes-induced adipose and hepatic inflammation. Lepr^db/db^ mice exhibited significantly reduced Foxp3 expression in SVFs and decreased IL-10 levels in adipose tissue, accompanied by elevations in circulating DPP4 activity and adiponectin levels. In contrast, *Lepr^db/db^*MyD88^−/−^ mice showed restoration of IL-10 expression in adipose tissue and liver and a reduction in circulating adiponectin levels. Furthermore, hepatic expression of inflammatory and metabolic genes, including ICAM, IL-1β, TNF-α, IL-6, iNOS, DPP4, FGF21, G6pc, and Pck1, as well as inflammatory markers in Kupffer cells, was markedly increased in Lepr^db/db^ mice and significantly attenuated by MyD88 deletion. These findings collectively indicate that MyD88 signaling is required for the development of adipose and hepatic inflammation, as well as liver dysfunction, in T2DM.
IL-10 is a key immunoregulatory cytokine that suppresses excessive inflammatory responses and promotes immune tolerance [12]. In the presence of TGF-β, IL-10 facilitates the expansion of Foxp3^+^ regulatory T cells with enhanced CTLA-4 (cytotoxic T-lymphocyte-associated protein 4) expression [11]. The mechanisms proposed for T1DM regulation by the involved IL-10 increase in Treg frequencies and Th2-type cytokine (IL-4 and IL-10) levels and IL-2 and IFN-c cytokine suppression [13]. Our data demonstrate that MyD88 deficiency significantly increased IL-10 production in adipose tissue and liver and concurrently reduced hepatic inflammation and gluconeogenic gene expression in T2DM. Moreover, MyD88 activation promoted adipose IL-6 and CCL2 expression, hepatic inflammation, gluconeogenesis, and circulating adiponectin levels by suppressing IL-10 and Foxp3 in adipose tissue. Consistent with this mechanism, SVFs from *Lepr^db/db^*MyD88^−/−^ mice displayed reduced expression of IL-6 and CCL2 and increased PDGFα expression. In vitro IL-10 treatment of SVFs from Lepr^db/db^ mice decreased IL-6 and CCL2 while increasing Foxp3 expression. In vivo administration of IL-10 further confirmed these observations by reducing pJNK and pNF-κB signaling and enhancing Foxp3 and IL-10 expression in adipose SVFs. These results indicate that IL-10 suppresses MyD88-driven inflammatory signaling and promotes Treg-associated immune regulation in adipose tissue under diabetic conditions.
Importantly, IL-10 administration also exerted profound metabolic benefits. IL-10 injection significantly reduced hepatic G6pc and Pck1 expression, decreased inflammatory gene expression in Kupffer cells, lowered serum ALT levels, and restored insulin-stimulated Akt activation in the liver. Furthermore, low-dose IL-10 (10 ng) significantly improved glucose tolerance and reduced circulating DPP4 activity. These findings indicate that adipose-derived IL-10 not only suppresses local inflammation but also improves systemic insulin sensitivity and hepatic glucose metabolism. The observation that low-dose IL-10 was more effective than higher doses in improving insulin sensitivity and glucose tolerance suggests a dose-dependent and tightly regulated role of IL-10 in metabolic control. A previous study showed that IL-10 treatment can upregulate phosphorylated Akt (pAkt) to mediate anti-apoptotic, pro-survival, and anti-inflammatory effects, particularly by activating the PI3K/Akt pathway alongside JAK1/STAT3 signaling [14]. DPP4, Tregs, and IL-10 are closely interconnected in the regulation of inflammation and immune tolerance. Previous studies have shown that DPP4 inhibition enhances Treg proliferation and IL-10 production, contributing to anti-inflammatory effects [15]. DPP4 inhibitors, widely used in the treatment of T2DM, have also been reported to exert immunomodulatory properties through IL-10 induction [16]. Recently, chimeric antigen receptor (CAR) cell therapy has been explored as a novel therapeutic approach in alleviating liver fibrosis and may become a future therapeutic strategy for hepatic metabolic syndrome [17]. Our previous work demonstrated that M1/M2 macrophage polarization in adipose tissue critically regulates diabetes-associated DPP4 activity, hepatic inflammation, and insulin resistance [18]. The present study extends these findings by identifying MyD88 as a key upstream regulator of the adipose IL-10–Treg–DPP4 axis in T2DM.
PDGF acts as pro-inflammatory mediators, contributing to remodeling, pain, and fibrosis in conditions such as arthritis, asthma, and fibrotic diseases. However, PDGF can induce tolerogenic effects, such as inducing IL-10 in dendritic cells and decreasing TNF-α, suggesting a complex and dual role [19]. Adiponectin is an adipokine with well-established protective roles in metabolic homeostasis [20], inflammation, and atherosclerosis [21,22]. Unlike leptin, adiponectin levels are typically reduced in obesity and insulin resistance [3]. Therefore, we examined plasma adiponectin levels in our model. Interestingly, our data revealed significantly decreased adiponectin levels and increased PDGFα expression in adipose SVFs of *Lepr^db/db^*MyD88^−/−^ mice compared with Lepr^db/db^ mice. Moreover, IL-10 injection significantly reduced circulating adiponectin levels in diabetic mice. These findings suggest that MyD88 signaling suppresses IL-10 and PDGFα expression while promoting adiponectin production in T2DM. Although this result appears paradoxical given the traditionally protective role of adiponectin, it highlights the complex and context-dependent regulation of adipokines under chronic inflammatory conditions.
Our study has several limitations. We did not directly compare the effects of IL-10 administration in IL-10 receptor-deficient mice or perform adoptive transfer of IL-10^+^Foxp3^+^ Tregs to definitively establish causality between IL-10, Treg expansion, and hepatic STAT3 signaling. Future studies using IL-10 receptor knockout models and Treg adoptive transfer approaches will be required to further delineate the precise cellular and molecular mechanisms involved.
4. Materials and Methods
4.1. Animals
Lepr^db/+^ mice were obtained from The Jackson Laboratory (Bar Harbor, ME, USA) and bred to generate diabetic Lepr^db/db^ and non-diabetic Lepr^+/+^ mice littermates. Lepr^db/db^ mice carry a mutation in the leptin receptor gene and develop obesity at 3 to 4 weeks of age, with hyperinsulinemia and hyperglycemia evident between 4 and 8 weeks. We generated *Lepr^db/db^*MyD88^−/−^ mice were generated by crossbreeding Lepr^db/db^ mice with MyD88^−/−^ mice.
All mice (Lepr^+/+^, Lepr^db/db^, *Lepr^db/db^*MyD88^−/−^) were maintained on a standard laboratory diet (1324 TPF; Atromin; Lage, Germany; 11.9 kJ/g, 19% crude protein, 4% crude fat, 6% crude fiber) with ad libitum access to food and water. All animal procedures were reviewed and approved by the Institutional Animal Care and Use Committee (IACUC) of Kaohsiung Veterans General Hospital and were conducted in accordance with institutional guidelines.
4.2. Preparation of Stromal Vascular Fractions (SVFs)
Vascular adipose tissue was isolated from bilateral inguinal fat pads of Lepr^+/+^, Lepr^db/db^, and Lepr^db/db^ MyD88^−/−^ mice (aged 10–12 weeks). Tissues were minced and digested with collagenase type VIII (Sigma-Aldrich, St. Louis, MO, USA, Cat# C2139) in ice-cold Hank’s Balanced Salt Solution HBSS (2 mg/mL) for 15 min at 37 °C. The digested suspensions were passed through 100 μm cell strainers and centrifuged at 1200 rpm for 10 min. The resulting cell pellets were collected as SVFs. Cell numbers were quantified using a Cellometer (Nexcelom Bioscience, Lawrence, MA, USA). Approximately 2.1 to 2.6 g of adipose tissue was harvested from per Lepr^db/db^ mouse (average body weight around 42 g).
4.3. In Vitro IL-10 Treatment of SVFs
For in vitro treatment, SVFs (2 × 10^7^ cells) were suspended in 1 mL PBS and treated with recombinant mouse IL-10 (10, 50, or 100 ng) at 37 °C for 3 h. Cells were then centrifuged at 1700 rpm for 10 min, washed with PBS, and the pellets were collected for subsequent analysis (Figure 11A).
4.4. In Vivo IL-10 Injection into Adipose Tissue
Lepr^+/+^ mice received PBS injections into bilateral inguinal adipose tissue. Lepr^db/db^ mice (aged 10–12 weeks) were randomly divided into four groups: (I) PBS control; (II) 10 ng IL-10; (III) 50 ng IL-10; and (IV) 100 ng IL-10. IL-10 or PBS was injected directly into inguinal adipose tissue. After 7 days, mice were sacrificed, and liver, adipose tissue, and blood samples were collected for further analysis (Figure 11B).
4.5. RNA Isolation and Quantitative Real-Time Polymerase Chain Reaction (Q-PCR)
Total RNA was extracted using Total RNA Miniprep Purification Kits (GeneMark, Atlanta, GA, USA) and reverse-transcribed into cDNA using RT kits (Invitrogen, Carlsbad, CA, USA). For Q-PCR, 2 μL of cDNA (200 ng) was mixed with 12.5 μL of 2× Fast SYBR Green Master Mix (Applied Biosystems, Foster City, CA, USA, Cat# 4385612), 2.5 μL of primers (25 μM each), and 8 μL of sterile water. Amplification was performed using a StepOnePlus™ Real-Time PCR System (Applied Biosystems, Foster City, CA, USA).
4.6. Western Immunoblot Analysis
Protein expression of phosphorylated Akt (pAkt; Cell Signaling, #4060), Akt (#4691), JNK (#9252), pJNK (#9251), ERK (#4695), and pERK (#9101) was determined by Western blotting. Tissue samples were homogenized in protein extraction buffer (Sigma-Aldrich, St. Louis, MO, USA) supplemented with a protease inhibitor cocktail (Roche, Basel, Switzerland). Proteins were separated by SDS–PAGE and transferred to nitrocellulose membranes. Membranes were blocked with 5% nonfat milk in TBST buffer (10 mM Tris–HCl, pH 7.5, 150 mM NaCl, 0.1% Tween-20) for 1 h, incubated with primary antibodies for 1 h at room temperature, followed by incubation with secondary antibodies. Protein bands were visualized using enhanced chemiluminescence (ECL; Millipore, Burlington, MA, USA).
4.7. Kupffer Cell Purification
Livers were perfused in situ via the portal vein with Ca^2+^- and Mg^2+^-free PBS containing 10 mM EDTA at 37 °C for 5 min, followed by perfusion with HBSS containing 0.1% collagenase IV (Sigma-Aldrich, St. Louis, MO, USA) for 5 min. The liver was excised, dispersed, filtered, and centrifuged at 50× g for 1 min at 4 °C. The supernatant was further centrifuged at 300× g for 5 min. The resulting cell pellet was layered over a 30/60% Percoll gradient (Pharmacia, Paris, France) and centrifuged at 900× g for 15 min to isolate Kupffer cells [23].
4.8. Flow Cytometry Analysis
SVFs were suspended in staining buffer (PBS with 0.5% BSA and 2 mM EDTA), incubated with 7-amino-actinomycin D (7-AAD; BioLegend, San Diego, CA, USA), and analyzed using an Attune NxT flow cytometer (ThermoFisher Scientific, Waltham, MA, USA). For intracellular Foxp3 staining, cells were first stained with anti-mouse CD4 (BioLegend, San Diego, CA, USA, #100528), fixed with True-Nuclear™ Fix Buffer for 1 h, and incubated with PE-conjugated anti-mouse Foxp3 antibody (BioLegend, San Diego, CA, USA, #126404) for 1 h in the dark. Data were analyzed using FlowJo v10 software (Tree Star, Ashland, OR, USA).
4.9. Insulin Treatment
Mice were injected with either PBS or insulin (1.25 mU/g body weight) and sacrificed 20 min later for liver collection.
4.10. Plasma DPP4 Activity
Cardiac blood was collected, and plasma was stored at −20 °C until assayed. Plasma DPP4 activity was measured using a DPP4 Activity Assay Kit (BioVision, Milpitas, CA, USA, # K779-100). Fluorescence of released AMC (7-Amino-4-Methyl Coumarin) was detected at Ex/Em = 360/460 nm.
4.11. Serum Alanine Aminotransferase (ALT) and Aspartate Transaminase (AST) Assay
Blood samples were collected from the portal vein, and serum ALT and AST levels were determined using a commercial kit (Transaminase CII-test; Wako Pure Chemical Industries, Osaka, Japan).
4.12. Enzyme-Linked Immunosorbent Assay (ELISA)
IL-10 and adiponectin concentrations were determined using mouse ELISA kits (R&D Systems, Minneapolis, MN, USA, #431414; Invitrogen, Carlsbad, CA, USA, #KMP0041). Tissues were homogenized in lysis buffer, and serum samples were obtained by centrifugation. Samples and standards were incubated on antibody-coated plates at 4 °C overnight and detected using HRP-conjugated avidin. IL-10 levels in liver and adipose tissue were normalized to the total protein content.
4.13. Intraperitoneal Glucose Tolerance Test (IPGTT)
Following a 15 h fast, mice received intraperitoneal glucose (1 g/kg body weight). Blood glucose levels were measured at 0, 15, 30, 45, 60, 75, 90, and 120 min post-injection using a glucose meter (Accu-Chek Performa; Roche, Basel, Switzerland).
4.14. Statistical Analysis
Data are presented as mean ± standard error of the mean (SEM). Statistical analyses were conducted with GraphPad Prism 10.0 software. Statistical significance was determined using unpaired Student’s t-tests for two-group comparisons or one-way analysis of variance (ANOVA) with Tukey’s post hoc test for multiple comparisons. A p value < 0.05 was considered statistically significant.
5. Conclusions
In conclusion, our study demonstrates that MyD88 signaling plays a pivotal role in promoting adipose inflammation, hepatic inflammation, and gluconeogenesis in T2DM by suppressing adipose-derived IL-10 and Foxp3^+^ regulatory T cells. Genetic deletion of MyD88 or pharmacological elevation of IL-10 in adipose tissue significantly reduced adipose IL-6 and CCL2 expression, attenuated hepatic inflammation and gluconeogenesis, improved insulin signaling, and alleviated glucose intolerance in diabetic mice (Figure 12). These findings identify the adipose MyD88/IL-10/Treg axis as a critical mediator of adipose–liver crosstalk in metabolic disease and suggest that targeting this pathway may represent a novel therapeutic strategy for the treatment of metabolic syndrome and T2DM.
The reference list from the paper itself. Each links out to its DOI / PubMed record.
- 1Sulen A. Aouadi M. Fed Macrophages Hit the Liver’s Sweet Spot with IL-10Mol. Cell 2020791310.1016/j.molcel.2020.06.01632619466 · doi ↗ · pubmed ↗
- 2Huh J.Y. Park Y.J. Ham M. Kim J.B. Crosstalk between adipocytes and immune cells in adipose tissue inflammation and metabolic dysregulation in obesity Mol. Cells 20143736537110.14348/molcells.2014.007424781408 PMC 4044307 · doi ↗ · pubmed ↗
- 3Dollet L. Lundell L.S. Chibalin A.V. Pendergrast L.A. Pillon N.J. Lansbury E.L. Elmastas M. Frendo-Cumbo S. Jalkanen J. de Castro Barbosa T. Exercise-induced crosstalk between immune cells and adipocytes in humans: Role of oncostatin-M Cell Rep. Med.2024510134810.1016/j.xcrm.2023.10134838151020 PMC 10829726 · doi ↗ · pubmed ↗
- 4Tian J. Zhao Y. Wang L. Li L. Role of TLR 4/My D 88/NF-kappa B signaling in heart and liver-related complications in a rat model of type 2 diabetes mellitus J. Int. Med. Res.20214911210.1177/0300060521997590 PMC 802009833787393 · doi ↗ · pubmed ↗
- 5Degirmenci I. Ozbayer C. Kebapci M.N. Kurt H. Colak E. Gunes H.V. Common variants of genes encoding TLR 4 and TLR 4 pathway members TIRAP and IRAK 1 are effective on MCP 1, IL 6, IL 1beta, and TN Falpha levels in type 2 diabetes and insulin resistance Inflamm. Res.20196880181410.1007/s 00011-019-01263-731222667 · doi ↗ · pubmed ↗
- 6Hosoi T. Yokoyama S. Matsuo S. Akira S. Ozawa K. Myeloid differentiation factor 88 (My D 88)-deficiency increases risk of diabetes in mice P Lo S ONE 20105 e 1253710.1371/journal.pone.001253720824098 PMC 2932727 · doi ↗ · pubmed ↗
- 7Boonstra A. Rajsbaum R. Holman M. Marques R. Asselin-Paturel C. Pereira J.P. Bates E.E. Akira S. Vieira P. Liu Y.J. Macrophages and myeloid dendritic cells, but not plasmacytoid dendritic cells, produce IL-10 in response to My D 88- and TRIF-dependent TLR signals, and TLR-independent signals J. Immunol.20061777551755810.4049/jimmunol.177.11.755117114424 · doi ↗ · pubmed ↗
- 8Cintra D.E. Pauli J.R. Araujo E.P. Moraes J.C. de Souza C.T. Milanski M. Morari J. Gambero A. Saad M.J. Velloso L.A. Interleukin-10 is a protective factor against diet-induced insulin resistance in liver J. Hepatol.20084862863710.1016/j.jhep.2007.12.01718267346 · doi ↗ · pubmed ↗