Deciphering Genetic Architecture of Feed Conversion Ratio and Growth Traits in Yorkshire Pig
Changguang Lin, Qiuyong Chen, Yaxuan Liu, Wei Cai, Tao Huang, Yi Zhou, Jinyu Lin, Lunjiang Zhou, Xinzhu Chen

TL;DR
This study identifies genetic factors influencing feed efficiency and growth traits in Yorkshire pigs, offering insights for improving pork production.
Contribution
The study discovers 16 quantitative trait loci and candidate genes linked to feed efficiency traits in pigs.
Findings
Heritability estimates for DAYS_100, BFT_100, and FCR_30_100 were 0.25, 0.40, and 0.23 respectively.
Genetic correlations showed FCR_30_100 positively correlates with DAYS_100 and BFT_100.
Candidate genes ETV4 and ENSSSCG00000045751 were significantly associated with DAYS_100 and FCR_30_100.
Abstract
Background: Pigs are one of the most important livestock species for providing meat products in the world. Deciphering the genetic architecture of feed efficiency-related traits is beneficial to improve the genetic progress of these traits and save the total cost of pork production. However, the genetic architecture of feed efficiency-related traits remains unclear. Methods: To address this problem, we collected 1301 genotyped Yorkshire pigs with three feed efficiency-related traits, including days at 100 kg (DAYS_100), backfat thickness at 100 kg (BFT_100), and feed conversion ratio from 30 to 100 kg (FCR_30_100), to explore the genetic parameters and genetic basis of these traits. Results: The heritability of DAYS_100, BFT_100, and FCR_30_100 was 0.25 ± 0.04, 0.40 ± 0.05, and 0.23 ± 0.04, respectively. Additionally, BFT_100 and DAYS_100 had a weak negative genetic correlation (−0.01 ±…
Genes, proteins, chemicals, diseases, species, mutations and cell lines named across the full text — each resolved to its canonical identifier and authoritative record.
Click any figure to enlarge with its caption.
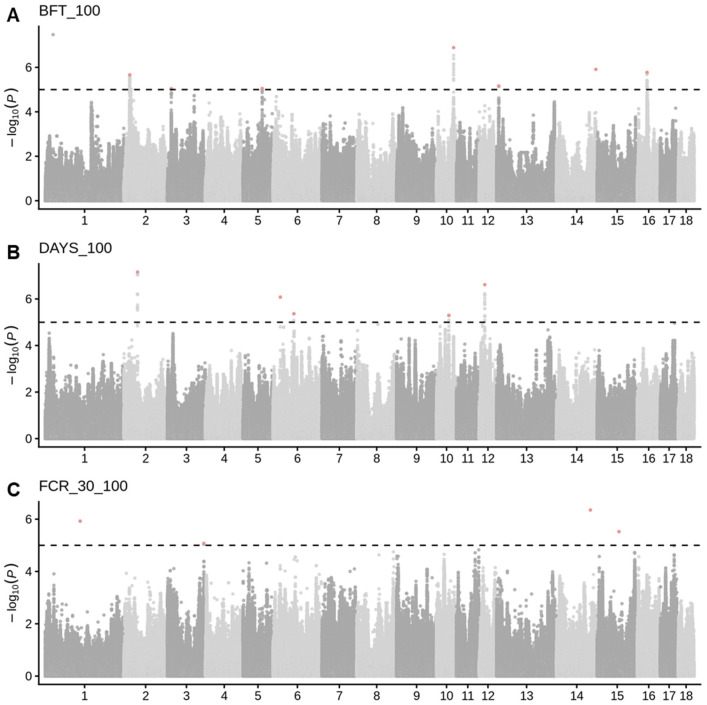 Figure 1
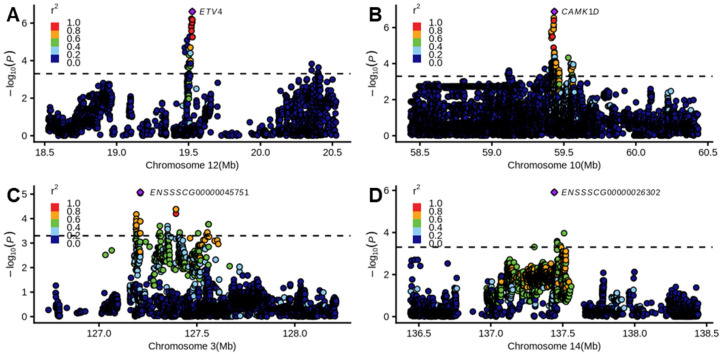 Figure 2
- —Basic Scientific Research Projects of Provincial Public Welfare Scientific Research Institutions
- —China Agriculture Research System
Peer Reviews
No public reviews on file for this paper yet. If you reviewed it on a platform where reviews are public (OpenReview, ICLR, NeurIPS, ICML), you can paste yours below so the community can read it here.
Videos
No videos yet. Explain this paper in a talk, walkthrough, or lecture? Add one.
Taxonomy
TopicsGenetic and phenotypic traits in livestock · Genetic Mapping and Diversity in Plants and Animals · Animal Nutrition and Physiology
1. Introduction
Pigs are one of the most important livestock species for providing meat products in the world. In the process of pig production, feed occupies about 65% of the total cost of pork production [1]. Consequently, improving feed efficiency is a primary objective in swine breeding programs. Key growth traits, such as days at targeted body weight (DAYS) and backfat thickness (BFT), are routinely used to evaluate production performance in pigs because these traits are easy to measure [2]. Additionally, the feed conversion ratio (FCR), defined as the amount of feed consumed per unit of body weight gain, serves as a critical indicator of feed efficiency. A lower FCR not only reduces production costs but also decreases nitrogen and phosphorus excretion, thereby contributing to environmental sustainability [3]. However, large-scale phenotypic recording of individual feed intake has been challenging, limiting genetic evaluation of FCR. Recent advances in automated feeding systems now enable precise, high-throughput measurement of individual feed consumption (e.g., Osborne Feed Intake Recording Equipment system and Nedap Velos system), offering opportunities to dissect the genetic architecture underlying feed efficiency in pigs.
Genetic parameters of complex traits are fundamental to understanding the genetic nature of complex traits. Previous studies have shown that feed efficiency traits are genetically correlated with growth traits [4], conformation traits [5], reproduction traits [6], and others [7,8,9], indicating the genetic links between FCR and other complex traits. A genome-wide association study (GWAS) provides chances to reveal the genetic architecture of complex traits and diseases in humans and farm animals [10,11]. For example, previous studies found that several genomic regions were associated with feed efficiency traits in pigs [4,12,13]. However, these studies only used the low-coverage data to explore the genetic basis of feed efficiency traits in pigs. The strategy of genotype imputation provided chances to improve the genome coverage of genotype data and identify putative causal variants associated with complex traits [14,15]. For example, the SWine IMputation haplotype reference panel improved the genotype resolution for genetic mapping in pigs [16]. These studies provided a comprehensive view on exploring the genetic architecture of feed efficiency-related traits in pigs.
Therefore, to elucidate the genetic basis of feed efficiency-related traits in pigs, we collected 1301 genotyped Yorkshire pigs with three feed efficiency-related traits, including days at 100 kg (DAYS_100), backfat thickness at 100 kg (BFT_100), and feed conversion ratio from 30 to 100 kg (FCR_30_100). First, we estimated the genetic parameters of these feed efficiency-related traits, including heritability and genetic correlation. Subsequently, we performed GWAS to investigate the genetic basis of feed efficiency-related traits. Finally, to investigate the potential function of candidate genes for feed efficiency-related traits, we annotated the candidate genes of GWAS signals and performed functional annotation for the candidate genes.
2. Materials and Methods
2.1. Population and Data
We collected a Yorkshire breeding population, including 1301 sows derived from Fujian Guanghua Best Limited Company. All sows were manipulated under uniform nutritional and management conditions. All sows were fed until a weight of around 100 kg for each pig. All sows were housed in groups equipped with an automated performance testing system, Osborne Feed Intake Recording Equipment system (Version 2.2.1.7 for Windows; Osborne Industries Inc., Osborne, KS, USA). The system utilized radio-frequency identification (RFID) via electronic ear tags for individual recognition and precisely recorded individual feed intake throughout the trial period. The feeding data were automatically collected by the system and used for the subsequent calculation of the feed conversion ratio (FCR). The basal diet, primarily composed of corn and soybean meal, was formulated to meet the nutrient requirements recommended by the NRC (2012) [17]. All pigs were fed the same diet during the experimental period.
Samples were collected from the ear tissue of each experimental pig. After collection, samples were placed in centrifuge tubes containing 70% ethanol for storage. For genotype data, a total of 1301 pigs were genotyped using Zhongxin No.1 50K SNP Chip and obtained 45,073 single-nucleotide polymorphisms (SNPs). To ensure the genotype quality, we performed the quality control using plink v1.90 [18]. After quality control, the genotypes were imputed from 50 K to whole-genome sequence (WGS) resolution based on the Pig Genomics Reference Panel using Beagle v5.1 [19] with parameters: ne = 1000. After that, we filtered out the low-quality SNPs with multiple allelic SNPs, dosage R-square < 0.8, or minor allele frequency <0.01. Finally, 10,401,626 SNPs were kept for downstream analysis.
For phenotype data, we collected three phenotypes, including days at 100 kg (DAYS_100), backfat thickness at 100 kg (BFT_100), and feed conversion ratio from 30 to 100 kg (FCR_30_100). DAYS_100 was defined as the number of days from birth until the body weight reached 100 kg. BFT_100 was measured via ultrasound at the location between the third and fourth last ribs when the body weight reached 100 kg. FCR_30_100 was evaluated from 30 kg to 100 kg. The physiologically implausible records for each trait were excluded, representing the records exceeding 3 standard deviations.
2.2. Estimation of Genetic Parameters
To investigate the genetic parameters of these growth traits, we estimated narrow-sense heritability ( ) using GCTA v1.94.1 [20]. Additionally, we utilized a bivariate linear mixed model to calculate the genetic correlation between these growth traits. The linear mixed model was as follows:
where is a vector of phenotypic records. b is the fixed effect, including year and season. ~N(0, G ) is the additive genetic effect. G is the genomic relationship matrix and is the additive genetic variance. ~N(0, I ) is the residual effect. I is the identity matrix and is the residual variance. and are the design matrices for the fixed effect and genetic additive effect .
2.3. Genome-Wide Association Studies (GWAS)
We performed genome-wide association studies for each growth trait using GCTA v1.94.1 [20]. The linear mixed model was as follows:
where is a vector of phenotypic records. is a vector of mean-centered genotypes of the SNP coding as 0, 1, and 2. is the effect size of SNP . is the fixed effect, including year and season. ~N(0, G ) is the additive genetic effect. is the genomic relationship matrix and is the additive genetic variance. ~N(0, I ) is the residual effect. is the identity matrix and is the residual variance. and are the design matrices for the fixed effect and genetic additive effect . We considered p < 5 × 10^−4^ as the significant threshold to obtain significant SNPs.
2.4. Conditional Analysis
To obtain the independent SNPs for these growth traits, we conducted conditional analysis based on the GWAS summary statistics for each growth trait using GCTA v1.94.1 COJO module [21]. We utilized the genotype data as the LD reference panel. For the independent variants, we performed a variant effect predictor to predict the variant functional location searching by the interface in Ensembl (URL: https://asia.ensembl.org/index.html, Sus scrofa 11.1, version 114).
2.5. Candidate Genes and Functional Annotation
We defined the quantitative trait loci (QTL) based on the independent SNPs. We defined 1 Mb up- and downstream around the independent SNPs as the QTL. The candidate genes located in the QTL region were annotated based on the pig genome annotation (Sus scrofa 11.1) using BEDtools v2.31.1 [22]. Gene Ontology (GO) enrichment analysis and Kyoto Encyclopedia of Genes and Genomes (KEGG) pathway analysis of candidate genes were conducted using DAVID (URL: https://davidbioinformatics.nih.gov/) [23,24].
3. Results
3.1. Phenotypic Summary and Genetic Parameters of Three Traits
The summary statistics of phenotype records are shown in Table S1. The distribution of phenotypic data essentially conforms to a normal distribution (Figure S1). In addition, we found that the average of FCR_30_100 was 2.29 ± 0.23, indicating the relatively moderate efficiency in this population. To investigate the genetic parameters of these growth traits, we estimated the narrow-sense heritability for these growth traits (Table 1). The heritability of DAYS_100, BFT_100, and FCR_30_100 was 0.25 ± 0.04, 0.40 ± 0.05, and 0.23 ± 0.04, respectively, indicating moderate-to-high heritability across these growth traits. To further exploit the genetic relationship between these traits, we estimated the genetic and phenotypic correlation across these traits. We found that the genetic correlation of these traits was positive (Table 2). Meanwhile, BFT_100 and DAYS_100 had a weakly negative genetic correlation (−0.01 ± 0.12). Additionally, we found that trait FCR_30_100 showed a positive genetic correlation with DAYS_100 (0.51 ± 0.11) and BFT_100 (0.28 ± 0.12), indicating moderate-to-strong correlation between these traits.
3.2. Genome-Wide Association Study (GWAS) for Three Growth Traits
To identify SNPs associated with three growth traits, we perform GWAS for each trait. In total, we identified that 114, 90, and 5 were significantly associated with BFT_100 (Figure 1A), DAYS_100 (Figure 1B), and FCR_30_100 (Figure 1C), respectively. After conditional analysis, 7, 5, and 4 SNPs were independently associated with BFT_100, DAYS_100, and FCR_30_100, respectively.
Furthermore, to identify the candidate genes of independent SNPs, we annotated the nearest genes for each QTL, and several candidate genes were found that are associated with growth traits (Table 3). For example, the nearest gene ETV4 was significantly associated with DAYS_100 on chromosome 12 (Figure 2A). The nearest gene CAMK1D was significantly associated with BFT_100 on chromosome 10 (Figure 2B). Moreover, we discovered several new genes associated with three growth traits. For example, the unannotated candidate gene ENSSSCG00000045751 was associated with FCR_30_100 on chromosome 3 (Figure 2C). The unannotated candidate gene ENSSSCG00000026302 was associated with BFT_100 (Figure 2D). In summary, the genome-wide association studies discovered several candidate genes associated with the feed conversion ratio and growth traits.
3.3. Functional Annotation Enrichment of Candidate Genes
To identify the candidate genes of three growth traits, we defined quantitative trait loci (QTL) for each independent SNP and annotated the list of candidate genes (Table 3). After that, we performed functional annotation of candidate genes for each trait. We found that the candidate genes of BFT_100 were enriched in biological processes and immunological pathways, such as protein maturation, negative regulation of oxidoreductase activity, and cytotoxic T cell pyroptotic cell death (Table 4), indicating the potential links between immunological processes and the formation of backfat. In addition, the candidate genes of DAYS_100 were enriched in translation and microvillus membrane terms (Table 4), representing the importance of basic biological processes in growth. Notably, we found that the candidate genes of FCR_30_100 were enriched in bile acid metabolic processes and protein ubiquitination terms, indicating the importance of energy metabolism in the process of feed conversion in pigs (Table 4). In summary, the candidate genes associated with feed efficiency-related traits played a vital role in the important biological processes.
4. Discussion
In this study, we systematically exploited the genetic parameters of feed efficiency-related traits. The results show that these feed efficiency-related traits had moderate-to high-heritability. D. N. Do et al. [25] found that the heritability of RIF in Yorkshire pigs was 0.39, and there was a high genetic correlation with FCR (from 0.76 to 0.99), indicating the high genetic links between RFI and FCR. A recent study found that the heritability of feed efficiency-related traits ranged from 0.13 to 0.36 [4]. In addition, we investigated the genetic correlation between FCR_30_100, DAYS_100, and BFT_100. Among these, DAYS_100 and BFT_100 showed a low genetic correlation. In this study, we found that FCR was moderately correlated with DAYS_100 (0.51 ± 0.11) and BFT_100 (0.28 ± 0.12). Tusingwiire et al. [26] displayed a low-to-moderate genetic correlation between daily feed intake and economically important traits (ranging from 0.04 to 0.29). Coyne et al. [27] also found that body weight was positively correlated with feed efficiency in pigs. These results indicated the moderate-to-high links between FCR and key growth traits.
We further explored the genetic architecture of feed efficiency-related traits using GWAS. In this study, we discovered a series of candidate genes associated with feed efficiency-related traits. For example, candidate gene ETV4 was significantly associated with DAYS_100 on chromosome 12, which was associated with adipose deposition [28], supporting the links between this gene and DAYS_100. Additionally, candidate gene CAMK1D was significantly associated with BFT_100. Precious studies also found that CAMK1D, a genetic hotspot in type 2 diabetes, might be linked to the activation of food intake and metabolic regulation [29,30]. Moreover, GWAS of FCR discovered that the novel candidate gene ENSSSCG00000045751 was associated with FCR_30_100, which indicated the potential regulation of feed efficiency. A meta-analysis systematically identified the candidate genes associated with feed efficiency traits, highlighting that the genes MED18, PHACTR4, and ABCC2 are strong candidates for FCR [31]. In addition, the functional enrichment analysis showed that the candidate genes associated with feed efficiency and feed efficiency-related traits were highly enriched in the biosynthesis, digestion, and metabolism of biomolecules [4]. In this study, the candidate genes of FCR_30_100 were also associated with the bile acid metabolic process and protein ubiquitination terms, indicating the potential function of these candidate genes.
In this study, we investigated the genetic parameters and genetic basis of feed efficiency-related traits, including FCR_30_100, DAYS_100, and BFT_100. Firstly, we investigated the genetic parameters of feed efficiency-related traits, which provide comprehensive insights into the genetic characteristics of these traits. Additionally, compared with previous studies, this study utilized the imputed genotype data to perform GWAS, which partially improved the discovery rate of SNPs associated with feed efficiency-related traits. Furthermore, this study investigated the potential biological function of candidate genes for each trait and found that the candidate genes played a vital role in the energy metabolic processes. These results contributed to our understanding of the genetic basis of feed efficiency-related traits. In fact, except for the genetic impact, the environmental factors also influenced the feed efficiency-related traits. For example, the composition of the gut microbiome was correlated with the feed efficiency, which indicates the contribution of the microbial community for shaping host productive parameters [12,32]. In addition, this study lacks experimental validation of the candidate genes. Additionally, multi-omics data provided comprehensive insights into understanding the potential genetic regulation underlying complex traits [33]. Therefore, future studies might be necessary to consider the impact of the environment, integrate the multi-omics data, and perform the experimental validation of the candidate genes.
5. Conclusions
This study revealed the genetic basis of feed efficiency-related traits. The candidate genes, such as the ETV4 gene in DAYS_100, the CAMK1D gene for BFT_100, and the ENSSSCG00000045751 gene for FCR_30_100, could be used for further investigation.
The reference list from the paper itself. Each links out to its DOI / PubMed record.
- 1Morel P.C.H. Sirisatien D. Wood G.R. Effect of Pig Type, Costs and Prices, and Dietary Restraints on Dietary Nutrient Specification for Maximum Profitability in Grower-Finisher Pig Herds: A Theoretical Approach Livest. Sci.201214825526710.1016/j.livsci.2012.06.015 · doi ↗
- 2Sharif-Islam M. van der Werf J.H.J. Wood B.J. Hermesch S. The Predicted Benefits of Genomic Selection on Pig Breeding Objectives J. Anim. Breed. Genet.202414168570110.1111/jbg.1287338779724 · doi ↗ · pubmed ↗
- 3Patience J.F. Rossoni-Serão M.C. Gutiérrez N.A. A Review of Feed Efficiency in Swine: Biology and Application J. Anim. Sci. Biotechnol.201563310.1186/s 40104-015-0031-226251721 PMC 4527244 · doi ↗ · pubmed ↗
- 4Li W. Wang Z. Luo S. Wu J. Zhou L. Liu J. Genome-Wide Association Analysis and Genetic Parameters for Feed Efficiency and Related Traits in Yorkshire and Duroc Pigs Animals 202212190210.3390/ani 1215190235892552 PMC 9329986 · doi ↗ · pubmed ↗
- 5Peppmeier Z.C. Huang Y. Bartholomew J.-M.B. Jiang J. Knauer M.T. Leonard S.M. Genetic Parameters for Image-Based Estimations of Swine Feet and Leg Conformation Traits J. Anim. Sci.2025103 skaf 10310.1093/jas/skaf 10340168080 PMC 12010699 · doi ↗ · pubmed ↗
- 6Bouquet A. Déru V. Blanchet B. Ganier P. Flatrès-Grall L. Ligonesche B. Carillier-Jacquin C. Labussière E. Gilbert H. Digestive Efficiency Traits in Growing Pigs Are Genetically Correlated with Sow Litter Traits in the Large White Breed Animal 20221610044710.1016/j.animal.2021.10044735074648 · doi ↗ · pubmed ↗
- 7Homma C. Hirose K. Ito T. Kamikawa M. Toma S. Nikaido S. Satoh M. Uemoto Y. Estimation of Genetic Parameter for Feed Efficiency and Resilience Traits in Three Pig Breeds Animal 20211510038410.1016/j.animal.2021.10038434757251 · doi ↗ · pubmed ↗
- 8Casto-Rebollo C. Nuñez P. Gol S. Reixach J. Ibáñez-Escriche N. Variability of Daily Feed Intake as an Indicator of Resilience in Pietrain Pigs Animal 20251910141510.1016/j.animal.2024.10141539891997 · doi ↗ · pubmed ↗