Frailty and Socioeconomic Development in the European Region—Associations with Mortality in Middle-Aged and Older Adults
Rónán O’Caoimh, Aoife Wall, Mark R. O’Donovan

TL;DR
This study finds that lower socioeconomic development in European countries is linked to higher frailty rates in older adults, which may explain health inequalities.
Contribution
The study links country-level socioeconomic development to frailty prevalence and shows how frailty mediates mortality differences.
Findings
Frailty prevalence is strongly correlated with national socioeconomic development scores.
Adjusting for frailty reduces the mortality gap between countries with different socioeconomic development levels.
Frailty rates vary widely across European countries, with the lowest in Switzerland and highest in Poland.
Abstract
Public health relevance—How does this work relate to a public health issue? Population ageing in Europe is accompanied by cross-national differences in frailty prevalence, reflecting broader social and demographic inequalities.This study examines how country-level sociodemographic development (Sociodemographic Index) relates to frailty and mortality in adults aged 50+ across multiple European countries. Population ageing in Europe is accompanied by cross-national differences in frailty prevalence, reflecting broader social and demographic inequalities. This study examines how country-level sociodemographic development (Sociodemographic Index) relates to frailty and mortality in adults aged 50+ across multiple European countries. Public health significance—Why is this work of significance to public health? Lower sociodemographic development is associated with substantially higher…
Genes, proteins, chemicals, diseases, species, mutations and cell lines named across the full text — each resolved to its canonical identifier and authoritative record.
Click any figure to enlarge with its caption.
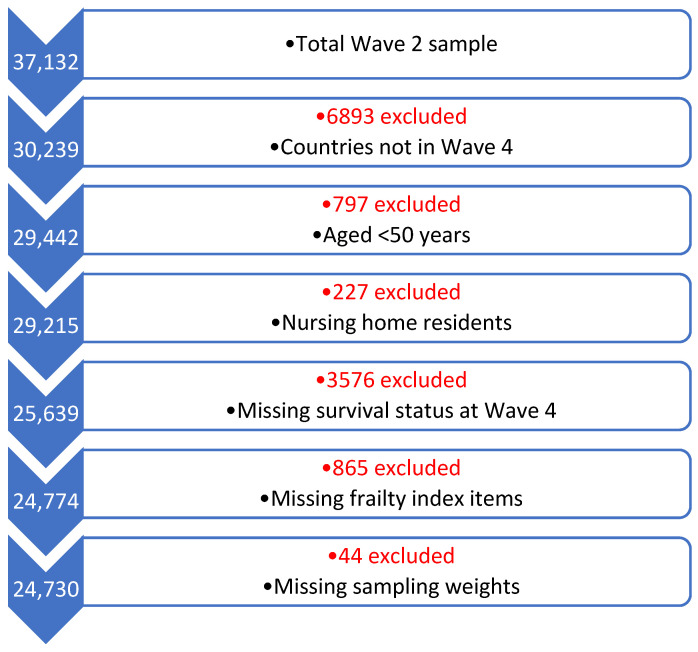 Figure 1
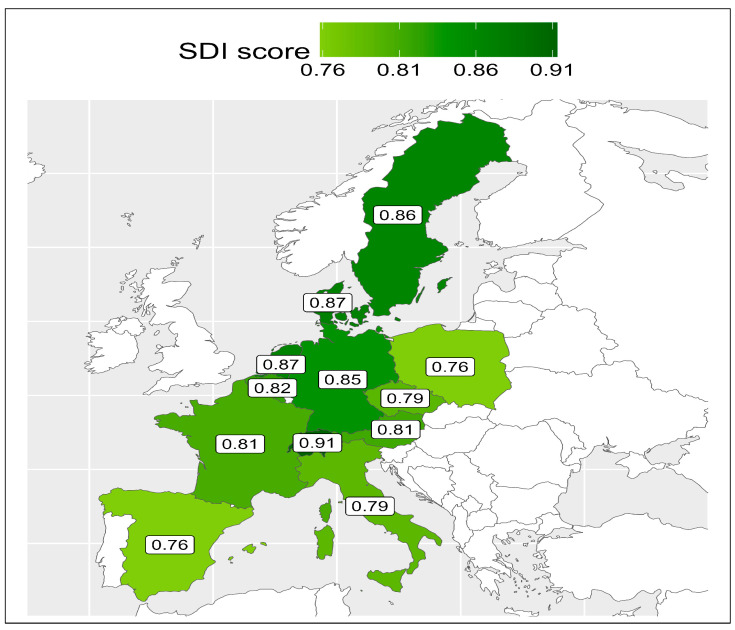 Figure 2
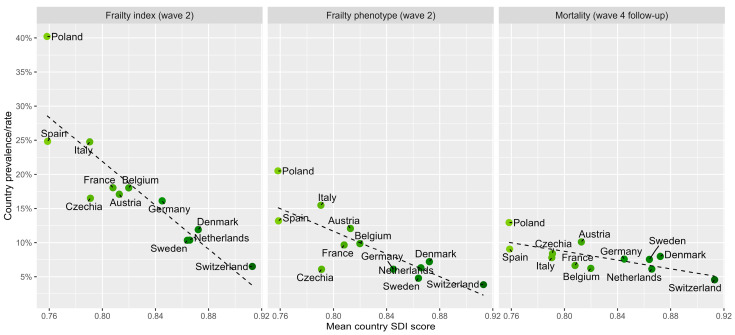 Figure 3
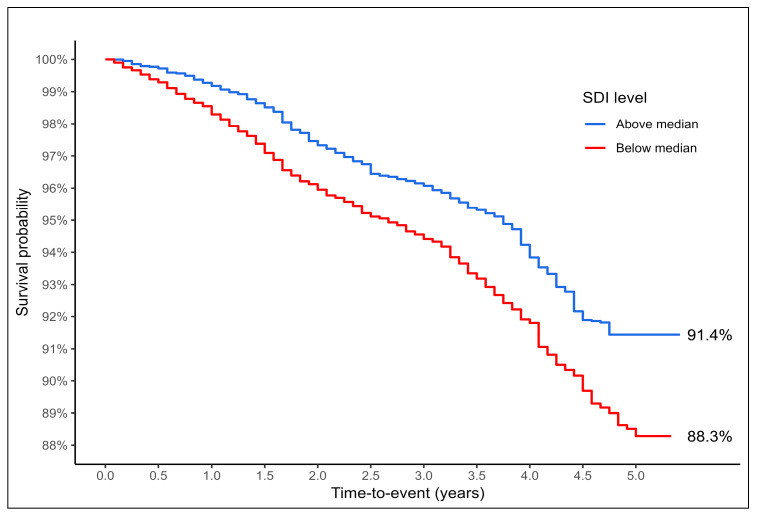 Figure 4
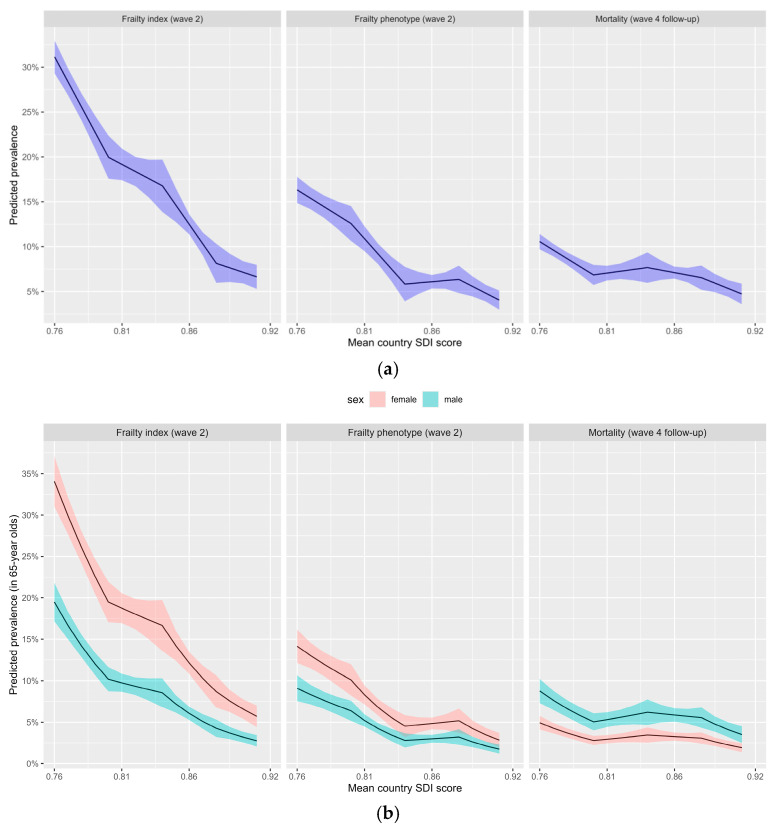 Figure 5
- —European Commission
- —Horizon 2020
- —DG Employment, Social Affairs & Inclusion
- —German Ministry of Education and Research
- —Max Planck Society for the Advancement of Science
- —U.S. National Institute on Aging
Peer Reviews
No public reviews on file for this paper yet. If you reviewed it on a platform where reviews are public (OpenReview, ICLR, NeurIPS, ICML), you can paste yours below so the community can read it here.
Videos
No videos yet. Explain this paper in a talk, walkthrough, or lecture? Add one.
Taxonomy
TopicsFrailty in Older Adults · Chronic Disease Management Strategies · Geriatric Care and Nursing Homes
1. Introduction
Population ageing is accelerating across Europe and around the world, with substantial heterogeneity in health outcomes between countries [1]. Differences in social and economic development are increasingly recognised as key determinants of population health, influencing life expectancy, disability, and the burden of age-related disease. The Sociodemographic Index (SDI), a composite measure of relative socioeconomic development at the country or regional level incorporating income per capita, educational attainment, and fertility rates, has been widely used to capture relative levels of social development and to contextualise global and regional health disparities. Scored from 0 (lowest) to 1 (highest), it is measured as a composite average of income per capita, mean education in those aged <25 years and total fertility rated in women aged <25 years in a country [2]. Lower SDI scores have been associated with increased mortality, higher disability-adjusted life years, and a greater burden of non-communicable diseases, especially amongst older adults [3]. Comparing the highest to lowest SDI quintile age-related burden of disease was 93% higher (137.8 disability-adjusted life years [DALYs] to 265.9 DALYs) and non-age-related burden of disease was 78% higher (149.3 to 265.9 DALYs) globally [4]. Data from the Global Burden of Diseases (GBD) study has shown that low-SDI countries and territories have greater life disparity and more healthy life disparity, which are important summary measures of overall population health reflecting length and quality of life respectively [5].
The relationship between frailty and socioeconomic status is recognised at the individual level with several studies showing that older adults with frailty have a lower socioeconomic position in society [6,7]. However, less is known about how SDI relates specifically to frailty, a multidimensional age-associated syndrome characterised by increased vulnerability to stressors and a heightened risk of adverse outcomes [8], including hospitalisation, institutionalisation, disability, and death [9]. Frailty represents a critical intermediary between social conditions and late-life health outcomes and may help explain cross-national differences in ageing trajectories [10]. It has a high prevalence in Europe [11] and globally [12], which varies by definition [12]. In Europe, the Survey on Health, Ageing and Retirement in Europe (SHARE), a longitudinal cohort study of those aged ≥50 years including >150,000 participants over nine different waves and across 28 countries, includes data on frailty, which varies from as low as 7% in Switzerland to as high as 41% in Poland using different definitions [13]. An analysis of 15 countries included in the first wave of the SHARE found that a mean frailty index score was negatively correlated with both gross domestic product (r = −0.79; p < 0.01) and health expenditure (r = −0.63; p < 0.05) in countries [14]. Frailty is also moderately associated with social vulnerability [15].
Frailty can be operationalized using different conceptual models. This analysis will focus on the two most widely available models of frailty, the frailty phenotype (FP) and the deficit accumulation frailty index (FI) [16]. The FP measures frailty as a collection of signs and symptoms usually including at least three of the following: unintentional weight loss, self-reported exhaustion, weakness (grip strength), slow walking speed, and low physical activity [17]. The FI considers frailty as a risk state defined by an accumulation of a large number of non-specific health deficits (such as signs, symptoms, diseases, mental and cognitive issues) [18], and is usually scored as the proportion of deficits out of a list of at least 30 items, with scores ≥ 0.25 indicating frailty [19]. Both approaches are clinically distinct yet complementary definitions of frailty [20]; they often yield different prevalence estimates [12] and may vary in their sensitivity to social and contextual factors [20].
Although previous European studies have demonstrated substantial between-country variation in frailty prevalence [13], few have explicitly examined whether these differences align with country-level SDI scores. Furthermore, it remains unclear whether SDI independently predicts mortality once individual frailty status is taken into account. Understanding these relationships is important for informing public health strategies aimed at reducing health inequalities in ageing populations. Hence, the aim of this study was to examine the association between country-level SDI, frailty prevalence, and mortality in a large, harmonized European cohort, the SHARE. Specifically, we assessed whether SDI was associated with frailty prevalence using two established frailty measures and whether SDI independently predicted mortality after accounting for age, sex, and frailty in the SHARE.
2. Materials and Methods
2.1. Design
This is a secondary analysis of adults aged ≥50 years from 12 countries in the SHARE [21]. The SHARE includes data from comprehensive questionnaires detailing health, social care, finances, education, and early life. Frailty status and baseline covariates were assessed at SHARE Wave 2 (2007) and survival follow-up (mortality data) at Wave 4 (2011). Mortality in SHARE was ascertained through follow-up contact with consenting relatives, friends, or neighbours, as linkage to census or registry data was unavailable.
2.2. Sample and Data Collection
Twelve countries were included from SHARE Wave 2 in 2007 (Austria, Belgium, Czech Republic, Denmark, France, Germany, Italy, Netherlands, Poland, Spain, Sweden and Switzerland). Cross-sectional sampling weights were applied. SDI scores were added for 2006 and 2007 from the GBD 2023. SDI quintiles were provided and all countries were in the “High SDI” group. SHARE participants were included if their country was included in both Waves 2 and 4 of the SHARE, if they were aged ≥50 years and were community-dwelling. They were excluded if they were resident in a nursing home or had missing data (relating to the FI, mortality, or sampling weights). SHARE data were collected using computer-assisted interviews administered by trained staff, with proxy respondents such as relatives, friends, or neighbours included when required [21].
2.3. Variables
The SDI is a composite, country-level indicator combining income per capita, educational attainment, and fertility rates among younger women. The SDI provides a relative measure of a country’s position along the social and demographic development spectrum, allowing meaningful cross-national comparisons. Specifically, it is a composite average of income per capita, mean education in those aged <25 years and total fertility rated in women aged <25 years [2]. SDI scores were dichotomized into lower and higher using the median scores as cut-offs. Frailty was measured using a 70-item FI (score ≥ 0.25) and a modified Fried FP (≥3/5 positive criteria). The 70-item FI has been previously described for SHARE Waves 1 and 2 [22]. The FI comprised biological deficits (n = 29, 41% of items), including 16 comorbidities and 13 signs or symptoms; cognitive deficits (n = 4, 6%); mental wellbeing deficits (n = 11, 14%); functional deficits in activities of daily living (n = 25, 36%); and two additional items capturing self-rated health and hospitalisation in the previous year (3%). Consistent with established FI methodology [19], low physical activity, reflecting its role as a health-related deficit contributing to physiological vulnerability, was included. Employing both measures allows assessment of whether observed associations with SDI are consistent across differing conceptualisations of frailty.
Additional variables collected included educational level (based on the International Standard Classification of Education Scale, ranging from 0, low, to 6, high), employment status, body mass index (BMI) based on self-reported height and weight, financial insecurity, and self-rated health (SRH), a common measure of health recoded from a five-category scale into a binary variable, with good or very good health coded as 0 and poorer health as 1 [23]. Further variables included the number of hospitalisations in a year, the presence or absence of a cognitive deficit, a long-term health problem, any disability in activities of daily living (ADL) and whether daily activities were limited by health (assessed using the Global Activity Limitation Indicator or GALI, which asks whether respondents have been limited by health problems in usual activities for at least six months [24]), all recorded as binary responses to the questionnaire. Finally, quality of life (QoL) was based on the Control, Autonomy, Self-realization, and Pleasure (CASP) CASP-12 score, a 12-item questionnaire scored from 12 to 48, where higher scores indicate better QoL, reflecting a person’s sense of wellbeing across these four key domains [25]. It is a shorter, modified version of the original 19-item CASP scale.
2.4. Statistical Analysis
All analyses were conducted using R version 4.4.2. and the “survey” package was used to apply calibrated cross-sectional survey weights (provided by SHARE) and sampling design adjustments to improve population representativeness. Country-level correlations between SDI scores, frailty prevalence, and mortality rates were examined using Pearson’s correlation coefficients and visualized graphically. QoL, measured using the CASP-12 scale, was analysed descriptively and compared across SDI categories using weighted means and appropriate inferential statistics. CASP-12 was not included as an outcome in regression models but was used to contextualise differences in wellbeing across social development strata.
Descriptive comparisons were performed across SDI categories, with univariate differences assessed using complex-sample General Linear Models for continuous variables and complex-sample Pearson’s chi-square tests for categorical variables. Holm-adjusted p-values were applied to account for multiple comparisons. Associations between SDI and mortality were examined using complex-sample logistic regression, estimating odds ratios (ORs) and 95% confidence intervals (CIs). Models were adjusted for age and biological sex, and additional models accounted for frailty status. Predicted probabilities were derived from the models including B-Splines to allow non-linear associations with SDI score. Survival analysis was performed using Kaplan–Meier curves for visualisation and Cox proportional hazards modelling to examine the adjusted Hazard Ratio (HR). Statistical significance was set at p < 0.05.
3. Results
At SHARE Wave 2, 37,132 participants were initially available. After applying inclusion and exclusion criteria, 24,730 people from 12 countries were available and included in this analysis. The selection process including rationale for exclusion is presented in a flow diagram in Figure 1. SDI scores varied by SHARE country ranging from as low as 0.75 to as high as 0.91, which are all in the “High SDI” global quintile. The SDI values were dichotomised into scores below the medium value (<0.8204) and scores over the median (>0.8204) to facilitate analysis. SDI scores are presented graphically by country in Figure 2. In all, 16,657 participants from eight countries scored above the median (Austria, Belgium, Denmark, France, Germany, Netherlands, Sweden, and Switzerland) and 8073 scored below the median (Czechia, Italy, Poland, and Spain). The characteristics of the sample overall and compared by country SDI value are presented in Table 1. The mean age of the total sample included was 65.65 years (standard deviation = 10.27), and most (54%) were female and had received post-primary school education (68%). There were statistically significantly lower levels of education in those participants living in countries with high–middle SDI versus high SDI scores, with just 48% attaining post-primary level versus 82% (p < 0.001). Mean CASP-12 scores were 36.52, reflecting generally high QoL, albeit this was lower in those participants resident in countries with high–middle SDI scores versus high values (mean 34.32 versus 38.17, respectively; p < 0.001). Reflecting this, those in the high–middle countries were statistically significantly more likely to report lower SRH (49% versus 35%, respectively; p < 0.001).
3.1. Association Between SDI and Frailty
Frailty prevalence varied by definition and by country. In all, 21% were frail using the FI-70 while only 11% were frail based on the FP. Frailty prevalence across countries ranged from 7% to 40% using the FI-70 and from 4% to 21% using the FP. Prevalence was lowest in Switzerland and highest in Poland and showed a strong negative correlation with national SDI scores for the FI (r = −0.86) and FP (r = −0.80). There was a generally linear correlation between SDI values and frailty prevalence for countries for both the FP and FI models of frailty; see Figure 3. Those living in countries with higher SDI values (above the median value of 0.82) had statistically significantly lower frailty levels according to both measures: 16% versus 28% for those in countries with an SDI below the median (p < 0.001) on the FI-70, and 8% compared to 15%, respectively (p < 0.001), applying the FP. After adjustment for age and sex, higher SDI remained independently associated with lower odds of frailty using both the FI-70 (OR = 3.59; 95% CI: 2.96–4.34; p < 0.001) and the frailty phenotype (OR = 3.65; 95% CI: 2.84–4.69; p < 0.001). These ORs are presented in Table 2.
3.2. Association Between SDI and Mortality
The mortality rate varied by countries from as low as 5% in Switzerland to 13% in Poland. Mortality was lower in countries with an SDI below the median (7% vs. 9%), and a negative correlation was found between country-level SDI scores and mortality rate (Pearson’s correlation = −0.71). The OR for the association with mortality was statically significant, OR = 1.54 (1.30–1.84; p < 0.001), per 0.1 decrease in SDI scores. This remained statistically significant after adjustment for age and biological sex, OR = 1.55 (1.27–1.88; p < 0.001), but not by frailty status, based on the FI-70, OR = 1.11 (0.93–1.33; p = 0.257), or the FP, OR = 1.15 (0.96–1.38; p = 0.127). Examining survival, the unadjusted HR was 1.48 (1.24–1.76; p < 0.001) per 0.1 decrease in SDI values. The associated Kaplan–Meier curves are presented in Figure 4. This remained statistically significant when adjusted for age and sex, HR = 1.46 (1.23–1.74; p < 0.001), and by frailty model, providing a HR = 1.22 (1.02–1.45; p = 0.030), when adjusted for age, sex and by the FI-70, and a HR = 1.25 (1.05–1.49; p = 0.012), when adjusted for age, sex and by the FP. Predicted probabilities indicating the association between continuous SDI scores and adverse variables including mortality are presented in Appendix A, Figure A1.
4. Discussion
In this large, population-based study of older adults across 12 European countries, we examined the relationship between country-level SDI, frailty prevalence, and mortality. Building on prior evidence linking social development to age-related disease burden and life expectancy, our findings demonstrate a strong and consistent association between lower SDI scores and higher frailty prevalence. Importantly, this relationship was observed using two conceptually distinct frailty measures, suggesting that macro-level social conditions influence multiple domains of biological ageing and vulnerability.
4.1. Social Development and Frailty in Ageing Populations
The SDI captures key dimensions of social development including education, income, and fertility, which are known to shape health trajectories across the life course. Our findings extend this conceptual framework by showing that countries with lower SDI scores experience a substantially higher burden of frailty among adults aged 50 years and older. The strong country-level correlation between SDI and frailty prevalence (r ≥ 0.8) suggests that frailty may represent a population-level manifestation of cumulative social disadvantage. The observed gradient in frailty prevalence across SDI categories aligns with life-course models of ageing, in which early-life and mid-life exposures, such as educational opportunities, working conditions, income security, and access to healthcare, accumulate to influence physiological reserve in later life. Countries in Europe with relatively lower SDI values (high–middle) may therefore face a dual challenge of higher frailty prevalence and fewer resources to address the complex health and social care needs of older adults. From a public health perspective, this highlights frailty as a sensitive indicator of social inequality in ageing societies and the need to develop region-specific tailored intervention strategies [26]. A key strength of this study is the use of both an FI and the FP, which reflect different conceptualizations of frailty. Despite differences in prevalence estimates based on these frailty classifications, both measures demonstrated a consistent association with SDI. This suggests that social development influences not only physical frailty but also broader dimensions of health, including comorbidity burden, functional limitations, and psychosocial wellbeing [7]. The robustness of these findings across frailty models reinforces the validity of frailty as a meaningful outcome for cross-national comparisons and public health surveillance.
4.2. SDI, Frailty, and Mortality
In line with the existing literature, we observed higher mortality rates in countries with lower SDI scores. However, this association was substantially attenuated after adjustment for frailty, indicating that frailty largely mediates the relationship between social development and mortality. Frailty may plausibly represent a key pathway through which social development influences survival. Lower SDI contexts are associated with cumulative exposures across the life course, including poorer education, material deprivation, and reduced access to preventive and rehabilitative care. These exposures that result in social vulnerability may accelerate the accumulation of health deficits, reduce physiological reserve, and increase susceptibility to stressors, contributing to frailty [15]. Frailty, in turn, is strongly associated with mortality through mechanisms such as impaired homeostasis, inflammation, sarcopenia, and reduced resilience to acute illness [22]. This finding supports the hypothesis that frailty may act as a critical intermediary between social context and adverse health outcomes [10]. However, while our findings support frailty as an important explanatory factor, we acknowledge that formal mediation analyses were not conducted, and therefore we interpret frailty as a potential, rather than definitive, mediating pathway. Survival analyses further demonstrated that lower SDI was associated with poorer survival independent of age and sex, but that this effect diminished once frailty was taken into account. These results underscore the central role of frailty as a proximal determinant of mortality in later life and suggest that reducing frailty prevalence may offer a pathway to narrowing survival disparities between countries with differing levels of social development [27].
4.3. Public Health and Policy Implications
The findings of this study have important implications for public health policy in Europe. Specifically, they demonstrate a robust association between country-level social development and frailty prevalence in Europe, irrespective of the model of frailty. Building on this evidence, and informed by a wider body of international research, policies that prioritise early identification and prevention of frailty may help mitigate the downstream consequences of social disadvantage in ageing populations. This study also found that although many European countries rank highly on global measures of social development [28], substantial heterogeneity in frailty burden, even among relatively high-SDI settings, exists [13,29]. This supports the need for continued investment in social and health systems in Europe to support healthy ageing and to prevent the accumulation of frailty and disparities across the region. For example, health promotion activities, frailty prevention and management strategies, such as promoting physical activity, improving nutrition, reducing social isolation, and optimizing chronic disease management [30,31], should be considered integral components of public health approaches to ageing across the continent [9,32,33]. Our study also identified that while mortality rates were modestly lower in higher-SDI countries, this association was attenuated after adjustment for age, sex, and frailty status, indicating that frailty itself may account for a significant proportion of observed survival differences. Indeed, monitoring frailty prevalence alongside traditional indicators such as mortality and life expectancy may provide policymakers with a more nuanced understanding of population health and ageing-related inequalities [34].
At the healthcare system level, our findings by implication support the expansion of frailty screening and early intervention strategies within primary care and community settings [31,35]. European health systems with strong primary care infrastructures may be well positioned to implement routine frailty assessment and to deliver multidisciplinary interventions that address physical, psychological, and social dimensions of vulnerability. Such approaches align with the World Health Organization’s framework on Integrated Care for Older People (ICOPE) [36] and with European strategies promoting integrated, person-centred care. At a broader level, our findings reinforce the importance of addressing upstream social determinants of health across the life course. Policies aimed at improving educational attainment, economic security, and equitable access to healthcare may have long-term benefits in reducing frailty and its associated health and social care costs with a need for public health staff to address frailty from a societal perspective rather than just taking an individual-level clinical consideration of this complex condition [37]. Finally, the cross-national variation observed in this study underscores the value of comparative European research and policy learning. Countries with lower frailty prevalence at similar levels of SDI may offer transferable lessons in health system organisation, social protection, and preventive care. Strengthening collaboration and data harmonisation across European ageing studies, such as SHARE [38], and beyond to global studies will be essential for informing evidence-based policy and for tracking progress toward healthier and more equitable ageing across the continent and worldwide [39].
4.4. Strengths and Limitations
This study benefits from the use of a large, harmonised, multinational dataset with standardised data collection procedures, enhancing comparability across countries. The application of two validated frailty measures strengthens confidence in the robustness of the findings. Additionally, the use of survey weights improves the generalisability of results to national populations. Nevertheless, several limitations warrant consideration. First, SDI is an aggregate, country-level indicator and cannot capture within-country socioeconomic inequalities or regional variation. As such, the observed associations may underestimate the true impact of social disadvantage at the individual level. Accordingly, caution is required when interpreting findings, as ecological bias cannot be excluded. Second, mortality ascertainment relied on proxy reports rather than linkage to official registries, which may have led to misclassification. Third, frailty was measured at a single time point, limiting our ability to assess frailty progression or recovery. Fourth, residual confounding by unmeasured factors, such as healthcare system characteristics or cultural differences in health reporting, cannot be excluded. Fifth, only a limited number of countries were included, all relatively high-income, affluent European countries, most of which are in the top 50 by SDI score globally, including the highest ranked country at the time of data collection (Switzerland), limiting the generalisability of the findings. Future research is needed to assess this by comparing countries across the world, ideally using data such as that from the GBD study for which an FI called the GBD-FI was recently developed [13,29]. Similarly, these findings are limited to country-level associations, which do not represent causation, and the reasons for these associations are difficult to determine due to the large number of differences at the country level. Sixth, large longitudinal cohort studies such as SHARE are prone to reporting and other bias. Biases may be present in the prevalence of disease and disability items which are all self-reported, and some descriptive variables had disproportional levels of missing data (such as income security and QoL), which further restricted the sample. Seventh, the exclusion of institutionalised individuals may have resulted in conservative estimates of frailty prevalence and mortality. Eighth, this analysis did not include health system-level indicators such as healthcare expenditure, primary care accessibility, or long-term care infrastructure. Omission of these factors may introduce residual confounding, potentially attenuating or inflating observed associations between SDI and frailty. Additionally, while frailty is conceptually aligned as a pathway linking social development and mortality, formal mediation analyses were not undertaken; therefore, interpretations regarding mediation should be regarded as exploratory.
5. Conclusions
In conclusion, this study demonstrates that lower country-level SDI scores are strongly associated with higher frailty prevalence among older adults in Europe, regardless of the frailty measure used. Although mortality rates were higher in countries with lower SDI, this relationship was largely explained by differences in frailty, highlighting frailty as a key pathway linking social development to survival. These findings emphasize the importance of incorporating frailty into public health monitoring and support the need for policies that address social determinants of health across the life course to promote healthy ageing and reduce inequalities in later life.
The reference list from the paper itself. Each links out to its DOI / PubMed record.
- 1GBD 2019 Ageing Collaborators Global, regional, and national burden of diseases and injuries for adults 70 years and older: Systematic analysis for the Global Burden of Disease 2019 Study BMJ 2022376 e 06820810.1136/bmj-2021-06820835273014 PMC 9316948 · doi ↗ · pubmed ↗
- 2Haagsma J.A. James S.L. Castle C.D. Dingels Z.V. Fox J.T. Hamilton E.B. Liu Z. Lucchesi L.R. Roberts N.L.S. O Sylte D. Burden of injury along the development spectrum: Associations between the Sociodemographic Index and disability-adjusted life year estimates from the Global Burden of Disease Study 2017 Inj. Prev.202026 i 12i 2610.1136/injuryprev-2019-04329631915273 PMC 7571356 · doi ↗ · pubmed ↗
- 3Hu X. Yu S.J. Gao Y.C. Zhao Y. He Y.S. Liu Y.C. Pan H.F. Wang P. Health inequality in the disease burden of non-communicable diseases among the elderly from 1990 to 2021, and projections to 2050: A systematic analysis of the Global Burden of Disease Study BMC Geriatr.20252569310.1186/s 12877-025-06344-340993532 PMC 12462002 · doi ↗ · pubmed ↗
- 4Chang A.Y. Skirbekk V.F. Tyrovolas S. Kassebaum N.J. Dieleman J.L. Measuring population ageing: An analysis of the Global Burden of Disease Study 2017 Lancet Public Health 20194 e 159e 16710.1016/S 2468-2667(19)30019-230851869 PMC 6472541 · doi ↗ · pubmed ↗
- 5Zheng Y. Canudas-Romo V. Global health inequality: Analyses of life disparity and healthy life disparity Eur. J. Public Health 20243422522910.1093/eurpub/ckae 01038366168 PMC 10990531 · doi ↗ · pubmed ↗
- 6Wang J. Hulme C. Frailty and socioeconomic status: A systematic review J. Public Health Res.202110203610.4081/jphr.2021.203633942603 PMC 8477231 · doi ↗ · pubmed ↗
- 7Hanlon P. Politis M. Wightman H. Kirkpatrick S. Jones C. Khan M. Bezzina C. Mackinnon S. Rennison H. Wei L. Frailty and socioeconomic position: A systematic review of observational studies Ageing Res. Rev.202410010242010.1016/j.arr.2024.10242039025269 · doi ↗ · pubmed ↗
- 8Sezgin D. O’Donovan M. Cornally N. Liew A. O’Caoimh R. Defining frailty for healthcare practice and research: A qualitative systematic review with thematic analysis Int. J. Nurs. Stud.201992162610.1016/j.ijnurstu.2018.12.01430690163 · doi ↗ · pubmed ↗