Deciphering the Temporal Transcriptional Dynamics and Key Regulatory Networks of Pyrus betulifolia in Response to PEG-Induced Osmotic Stress
Ziyi Zhang, Ke Li, Wenxuan Chu, Yan Zeng, Yutong Zhu, Ruigang Wu, Qingjiang Wang

TL;DR
This study explores how Pyrus betulifolia responds to drought stress at the molecular level, identifying key genes and pathways involved in its drought tolerance.
Contribution
The study provides a detailed temporal analysis of gene expression and identifies novel regulatory genes in Pyrus betulifolia under drought stress.
Findings
Transcriptional changes peaked at 6 hours after PEG-induced stress, indicating a critical reprogramming phase.
Genes related to osmotic adjustment and oxidative stress were significantly upregulated between 6 and 12 hours.
WGCNA identified key regulatory genes like NF-Y, RVE1, and C2C2 zinc finger proteins as potential drought response regulators.
Abstract
Drought is a major environmental constraint limiting crop growth and fruit yield. Due to its high drought tolerance, Pyrus betulifolia is widely used as a rootstock for pear cultivation; however, its molecular response mechanisms and transcriptional regulatory features under drought stress remain insufficiently characterized. In this study, we systematically analyzed the temporal transcriptomic responses of pear leaves under PEG-induced osmotic stress conditions. The results revealed a rapid transcriptional reprogramming stage, with the most pronounced gene expression changes occurring at 6 h after stress treatment. During this stage, multiple biological pathways associated with osmotic adjustment, oxidative stress responses, and cellular protection were significantly enriched, suggesting their potential involvement in drought adaptation. Furthermore, co-expression network analysis…
Genes, proteins, chemicals, diseases, species, mutations and cell lines named across the full text — each resolved to its canonical identifier and authoritative record.
Click any figure to enlarge with its caption.
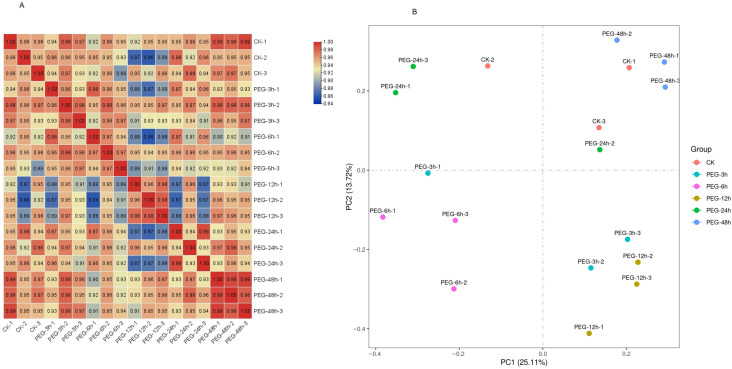 Figure 1
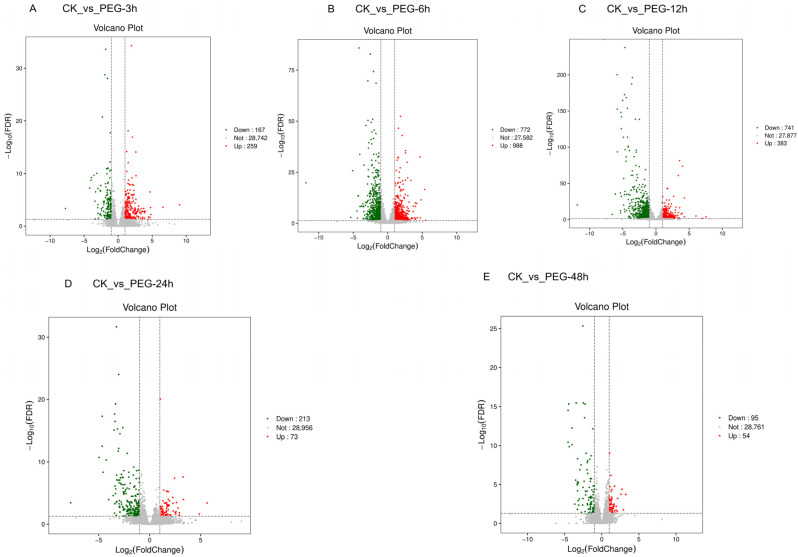 Figure 2
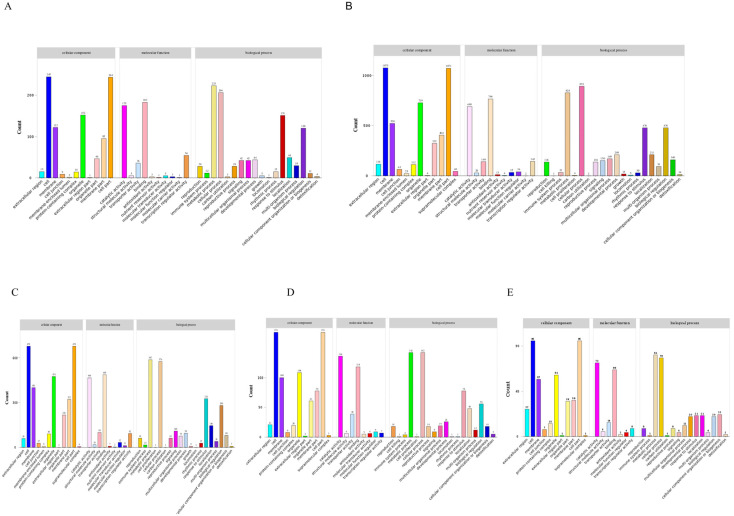 Figure 3
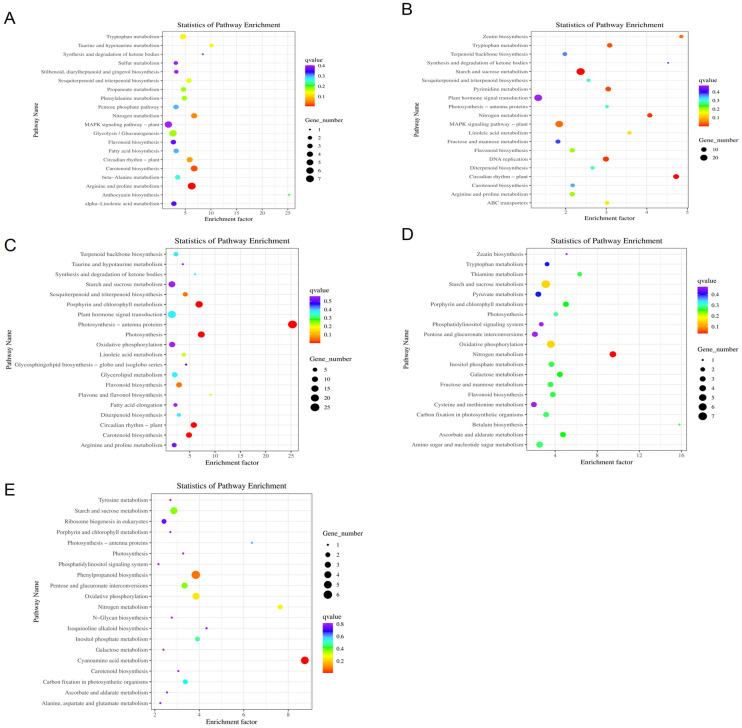 Figure 4
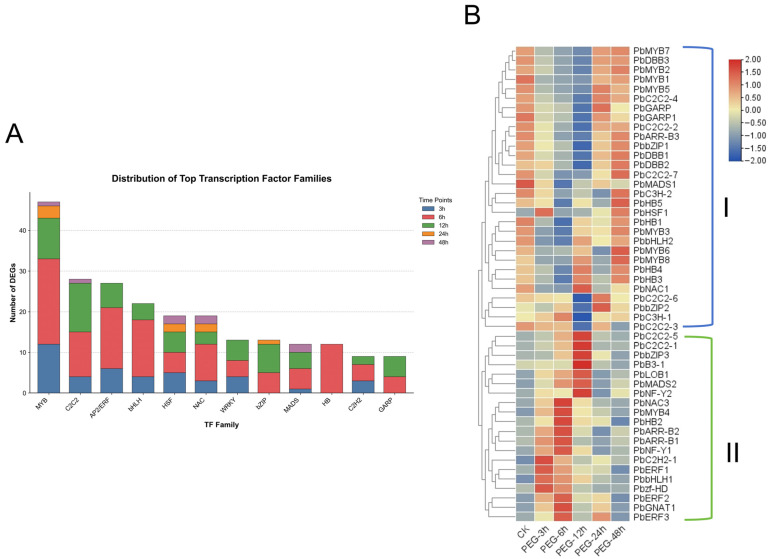 Figure 5
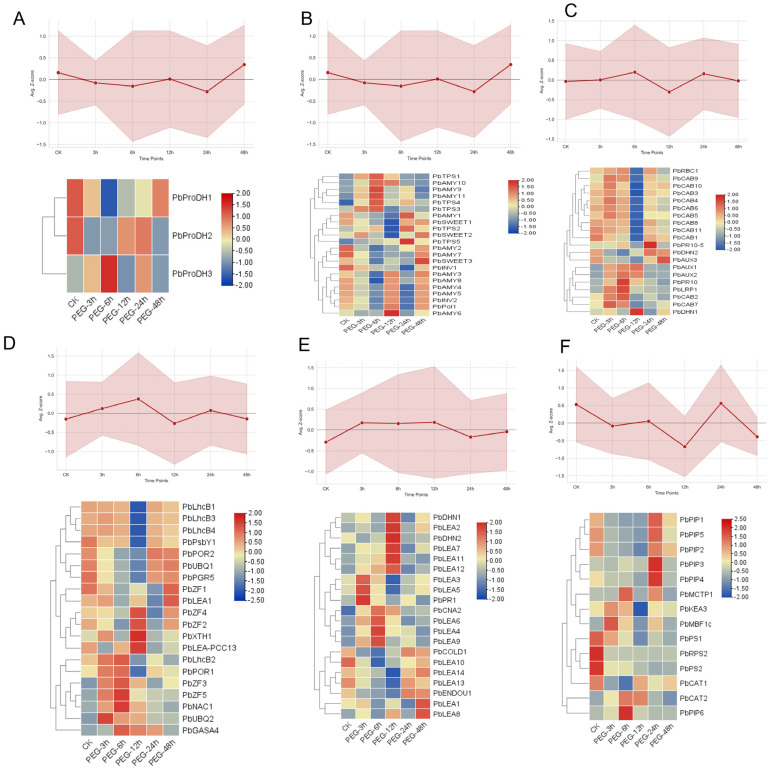 Figure 6
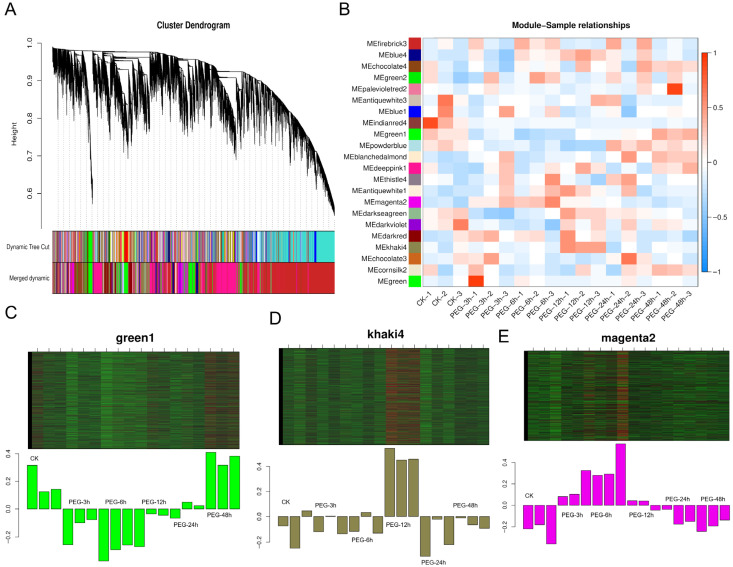 Figure 7
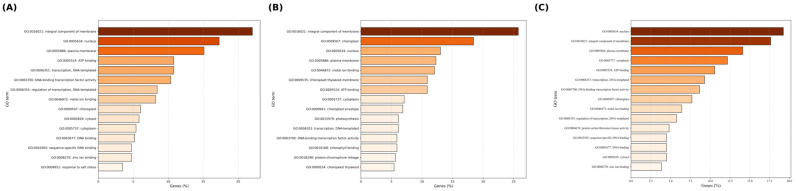 Figure 8
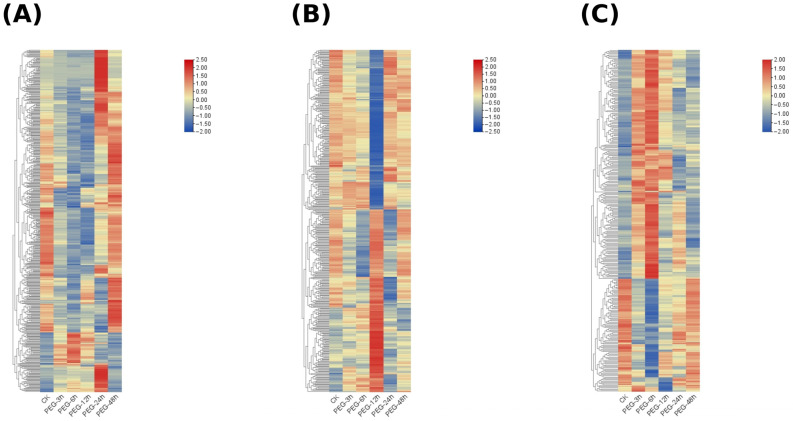 Figure 9
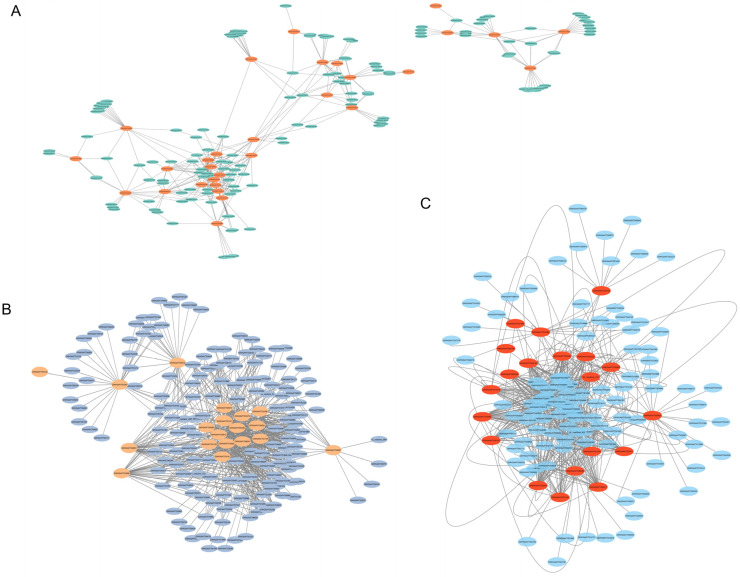 Figure 10
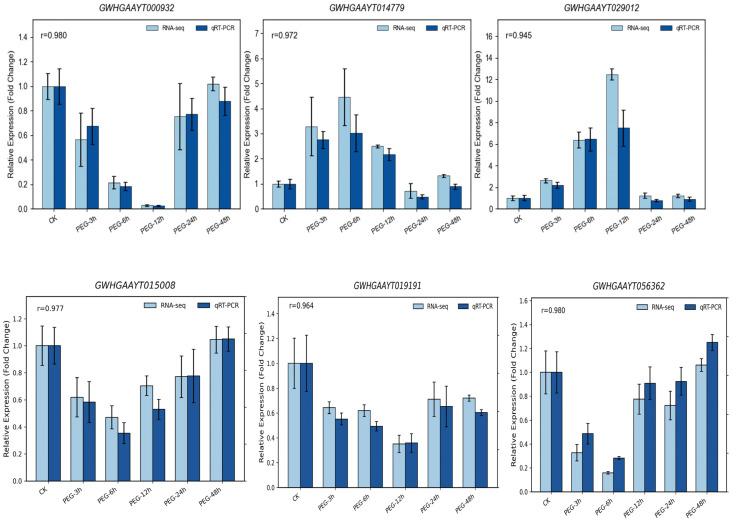 Figure 11
- —Hebei Agriculture Research System
Peer Reviews
No public reviews on file for this paper yet. If you reviewed it on a platform where reviews are public (OpenReview, ICLR, NeurIPS, ICML), you can paste yours below so the community can read it here.
Videos
No videos yet. Explain this paper in a talk, walkthrough, or lecture? Add one.
Taxonomy
TopicsPlant Molecular Biology Research · Plant Gene Expression Analysis · Plant Stress Responses and Tolerance
1. Introduction
As one of the predominant abiotic stressors globally, drought severely restricts crop growth and productivity, thereby constituting a persistent challenge to food security and agricultural sustainability [1,2]. Drought stress induces a series of physiological disorders, such as water deficit, disrupted osmotic regulation, and oxidative damage, which markedly suppress crop growth and development and ultimately result in substantial yield loss. Pear (Pyrus spp.), a prominent temperate deciduous fruit tree in the Rosaceae family, boasts a long history of cultivation and high economic value [3]. However, pear cultivation frequently faces abiotic stresses such as drought, which significantly inhibit growth and result in reduced fruit yield [4]. Utilizing drought-resistant rootstocks is an effective strategy to improve water use efficiency and environmental adaptability in pear trees. Pyrus betulifolia, a wild rootstock resource characterized by a vigorous root system and strong drought tolerance, plays a critical role in drought resistance breeding. Therefore, elucidating its underlying molecular mechanisms of drought resistance is of paramount importance.
Plant response to drought stress is a complex and dynamic process involving multi-gene coordination and the interaction of multiple signaling pathways. Under water deficit, plant cells undergo a series of physiological and biochemical changes, including reduced turgor pressure, oxidative damage induced by the burst of reactive oxygen species (ROS), and osmotic imbalance. To cope with these injuries, plants have evolved sophisticated molecular regulatory mechanisms. By reprogramming their transcriptome and activating ABA-dependent and -independent signaling pathways, plants regulate stomatal closure, induce the synthesis of osmoregulatory substances (e.g., proline and soluble sugars), and enhance antioxidant enzyme activities to re-establish cellular homeostasis [5]. In recent years, transcriptomics has become a powerful tool for systematically revealing global gene expression profiles and mining key regulatory genes under abiotic stress [6]. Through RNA-seq technology, researchers have identified numerous transcription factors (TFs) involved in drought response in various plants. For instance, GbMYB5 positively regulates drought tolerance in cotton [7]; OsbZIP62 participates in the ABA signaling pathway to positively regulate drought tolerance in rice by modulating the expression of stress-related genes [8]; and SlNAC6 influences endogenous ABA levels by regulating the transcription of ABA-related genes, thereby participating in tomato development and drought response [9]. These transcription factors play important roles in critical physiological processes such as stomatal movement, osmolyte synthesis, ROS scavenging, and hormone signaling, constituting the molecular regulatory hubs of plant drought response.
Although research on crop drought resistance is extensive, studies on the molecular mechanisms in pear rootstocks, particularly P. betulifolia, remain relatively lagging. Current research primarily focuses on physiological and biochemical measurements (e.g., photosynthetic rate, enzyme activity changes) or the cloning and functional verification of single genes, lacking a systematic analysis of the dynamic transcriptional regulatory network at the whole-genome level. Plant drought resistance is a continuous process that changes dynamically over time—ranging from early signal perception to intermediate defense activation, and finally to late adaptation and recovery. Consequently, focusing on a single time point often fails to capture the full picture. Moreover, traditional Differential Gene Expression (DGE) analysis often struggles to pinpoint core regulatory factors. Weighted Gene Co-expression Network Analysis (WGCNA) [10], as an advanced systems biology method, utilizes gene expression correlations to construct networks. It effectively identifies co-expressed gene modules and core hub genes within them. While WGCNA has been successfully applied to mine regulatory factors for complex traits in crops like maize and soybean, its application in pear rootstock drought research remains limited.
Natural drought is a slow and progressive process involving numerous variable factors that are difficult to control. In contrast, polyethylene glycol (PEG), as a non-absorbable, non-metabolizable, and non-toxic osmotic agent, allows for precise quantification of stress levels, making it more suitable for studying the molecular mechanisms of plant drought response [11]. Therefore, this study employed a time-course experimental design (0, 3, 6, 12, 24, and 48 h) to investigate the responses of tissue-cultured P. betulifolia plantlets to PEG-induced osmotic stress. Utilizing high-throughput transcriptome sequencing, we systematically analyzed the dynamic patterns of gene expression in P. betulifolia leaves under drought stress. We identified critical stages of the drought response and their characteristic differentially expressed genes. Furthermore, we mined core co-expression modules and hub transcription factors closely related to stress duration. This study provides important candidate gene resources for elucidating the molecular mechanisms of drought resistance in P. betulifolia and facilitating drought resistance breeding.
2. Materials and Methods
2.1. Plant Materials and Growth Conditions
The tissue culture of Pyrus betulifolia was subcultured on Murashige and Skoog solid medium supplemented with 0.5 mg L^−1^ benzylaminopurine and 0.1 mg L^−1^ naphthylacetic acid, under a 16/8 h light/dark cycle at 25 °C. Subsequently, 1-month-old Pyrus betulifolia tissue culture seedlings were subjected to osmotic stress treatment (20% PEG-4000 Is obtained from Sigma Reagent Co., Ltd., Burlington, MA, USA) in the same subculture medium. Leaf samples were collected at 0 h (control group), 3 h, 6 h, 12 h, 24 h, and 48 h. At each sampling time point, leaves from 10 tissue-cultured seedlings with uniform growth were pooled to form a single biological replicate. Three biological replicates were prepared for each time point, with approximately 2 g of leaf tissue collected per replicate and packaged in aluminum foil bags. The samples were rapidly frozen in liquid nitrogen and stored at −80 °C for RNA extraction and subsequent transcriptome analysis.
2.2. RNA-Seq Data Processing, Transcript Assembly, and Expression Analysis
Raw reads were first subjected to quality assessment and adapter detection using the FastQC v0.20.0 [12] package. Subsequently, low-quality reads and adapter-contaminated sequences were removed using NGSQC v2.3.3 [13]. The resulting clean reads were aligned to the Pyrus betulifolia reference genome (http://gigadb.org, accessed on 5 October 2025) using HISAT2 v2.1.0 [14], and transcript assembly and quantification were performed with StringTie v2.1.3b [15]. Gene-level count data were normalized using DESeq2 v1.26.0 [16], which was also employed to calculate fold changes and assess differential expression based on a negative binomial distribution model. Differentially expressed genes (DEGs) were identified according to log_2_ fold change values, with genes showing log_2_ fold change ≥ 1 and q-value ≤ 0.05 classified as upregulated and those with log_2_ fold change ≤ −1 and q-value ≤ 0.05 classified as downregulated.
2.3. Principal Component Analysis (PCA)
Principal component analysis (PCA) was performed to explore the expression patterns among different samples. Raw count data were first transformed using the DESeq2 v1.26.0 package, after which PCA was conducted with the princomp function in R V4.4.1. The resulting components were visualized using the factoextra 1.0.6 and ggplot2 packages V3.5.0.
2.4. Gene Ontology (GO) and KEGG Pathway Enrichment Analysis
Gene Ontology (GO) annotation was performed using the Blast2GO v2.10.1 software, with a significance threshold of p < 0.05. Directed acyclic graphs and hierarchical tree maps were generated using Blast2GO v2.10.1 and ReviGO (http://revigo.irb.hr/, accessed on 1 July 2025). KEGG pathway enrichment analysis and gene-set annotation were conducted with KOBAS 2.0. Query gene sequence files were first retrieved from the Rosaceae Genome Database (https://www.rosaceae.org, accessed on 1 October 2025) and aligned, and the resulting files were used as input for KOBAS. Functional annotation and pathway enrichment were subsequently carried out based on the Kyoto Encyclopedia of Genes and Genomes (KEGG) database. All heatmaps were generated using the heatmap function implemented in TBtools-II V2.435.
2.5. Identification of Gene Co-Expression Modules
Weighted gene co-expression network analysis (WGCNA) was performed in R to identify highly correlated gene modules based on the RNA-seq expression matrix. Gene expression and variation were first filtered using the DCGL package V2.1.2. The adjacency matrix was then transformed into a topological overlap matrix (TOM) using TOM-based similarity algorithms, and modules with highly correlated eigengenes (correlation coefficient > 0.8) were merged. Network visualization was conducted using Cytoscape v3.0.0.
2.6. Quantitative Expression Analysis by RT-qPCR
Gene-specific primers for pear were designed using Primer-BLAST (https://www.ncbi.nlm.nih.gov/tools/primer-blast, accessed on 1 October 2025), with sequences listed in Table S1. Quantitative real-time PCR (qPCR) was performed using cDNA templates from pear samples collected at different time points to analyze pear gene expression under drought stress. Each 20 µL reaction contained 10 µL of 2× Taq Pro Universal SYBR qPCR Master Mix (Vazyme Biotech Co., Ltd., Nanjing, China), 0.5 µL each of forward and reverse primers, 1 µL cDNA, and 8 µL ddH_2_O. The thermal profile included initial denaturation at 95 °C for 30 s, followed by 40 cycles of 95 °C for 5 s and 55 °C for 34 s. Relative expression levels were calculated via the 2−ΔΔCT method with three biological and technical replicates. Statistical analyses were performed using SPSS 22.0 software, while data visualization was generated using Excel 2013, TBtools-IIv2.326, and Graphpad Prism 10.1.2.
3. Results
3.1. Transcriptomic Analysis Based on RNA-Seq
To investigate the transcriptional response dynamics of Pyrus betulifolia to drought stress, we collected leaf samples from in vitro cultured Pyrus betulifolia tissue culture seedlings under 20% PEG-4000 stress treatment and performed RNA sequencing at different time points (0–48 h). Overall, after removing low-quality reads and adapters, a total of 131.01 Gb of data was obtained, with each sample’s Clean Data exceeding 6.31 Gb. Among these, 91.63% of the sequences were successfully aligned to the Pyrus betulifolia genome (Table S2). To assess the reliability of the experimental data, an inter-sample correlation analysis was performed. The results indicated that the correlation coefficients between the three biological replicates under the same treatment conditions were all greater than 0.9 (Figure 1A), demonstrating the high reproducibility of the experimental samples (Table S3). Furthermore, Principal Component Analysis (PCA) revealed that samples from the same treatment group clustered closely together in the principal component space and were distinctly separated from other treatment groups (Figure 1B), indicating significant differences in gene expression profiles between treatments.
Based on these findings, differential expression analysis was conducted on the transcriptome data across the time course. Compared to the control (0 h), a total of 426, 1760, 1124, 286, and 149 differentially expressed genes (DEGs) were identified in leaf samples collected at 3, 6, 12, 24, and 48 h under PEG-induced osmotic stress, respectively (Figure 2A–E). Notably, the number of DEGs peaked at 6 h, with both upregulated and downregulated genes reaching their maximum levels. Further intersection analysis revealed that the DEGs at different time points exhibited both overlaps and distinct temporal specificity, with 15 genes found to be commonly differentially expressed across all time points (3, 6, 12, 24, and 48 h) (Figure S1A,B).
3.2. GO Enrichment and KEGG PathwayAnalyses of Differentially Expressed Genes
Gene Ontology (GO) functional annotation categorizes differentially expressed genes (DEGs) into three major classes: Biological Process (BP), Cellular Component (CC), and Molecular Function (MF). In this study, GO functional annotation was performed on DEGs identified between osmotic stress treatments (3, 6, 12, 24, and 48 h) and the control, followed by statistical analysis of the top-enriched GO terms at each time point. As the duration of stress increased, the number of DEGs exhibited a trend of initially increasing and then decreasing, peaking at 6 h and 12 h, which indicates that the transcriptional response was most active during this phase (Figure 3).
During the early stage of osmotic stress (3 h), enriched GO terms were primarily concentrated in the Biological Process and Molecular Function categories. The DEGs were mainly involved in metabolic process, cellular process, and response to stimulus. At 6 h and 12 h, both the number and functional diversity of enriched GO terms increased significantly, with DEGs distributed across all three GO categories. Within the Biological Process category, metabolic process, cellular process, response to stimulus, and biological regulation were dominant. In the Molecular Function category, binding and catalytic activity predominated, while transporter activity and transcription regulator activity were notably enhanced. Regarding the Cellular Component, DEGs were primarily localized to the cell, organelle, and membrane. As the treatment duration extended to 24 h and 48 h, the number of DEGs and functional categories tended to converge, with enriched GO terms mainly related to metabolic process and cellular process (Table S4).
KEGG pathway enrichment analysis of DEGs across different osmotic stress treatment times is presented in Figure 4. Pathways such as Nitrogen metabolism, Phenylpropanoid biosynthesis, and Linoleic acid metabolism were enriched at multiple time points. DEGs specifically enriched only during the early stage (3 h) were primarily involved in pathways including the MAPK signaling pathway, Arginine and proline metabolism, and Tyrosine metabolism. During the intermediate stage (6 h and 12 h), genes related to DNA replication, Mismatch repair, Pyrimidine metabolism, and Plant hormone signal transduction showed the most active expression. In the late stages of stress (24 h and 48 h), the focus of enrichment shifted; pathways such as Starch and sucrose metabolism, Porphyrin and chlorophyll metabolism, Ribosome biogenesis in eukaryotes, and Protein processing in endoplasmic reticulum were significantly enriched. This suggests that in the later stages, the plant adapts to persistent water deficit primarily by regulating carbon metabolism, energy supply, and protein homeostasis.
3.3. Identification of Key Drought-Responsive Co-Expression Modules and Temporal Pattern Analysis
To elucidate the dynamic transcriptional regulatory processes induced by osmotic stress, we first identified differentially expressed transcription factors (DETFs) and systematically analyzed their family composition and temporal expression patterns. As illustrated in Figure 5A, the MYB, C2C2, AP2/ERF, and bHLH families were the predominant transcription factor types across all time points, with most families exhibiting distinct stage-specific response characteristics where the number of DETFs peaked at 6 h and 12 h before gradually declining at 24 h and 48 h. Based on the clustering analysis of the top 50 DETFs with the highest inter-sample variance (Figure 5B), these factors were clearly categorized into two distinct temporal dynamic patterns. Group I transcription factors exhibited a “down-then-up” trend, characterized by high expression levels in the CK group, followed by a continuous decline to a nadir as stress progressed, and a subsequent recovery. Conversely, Group II transcription factors displayed an “up-then-down” pattern, where expression levels steadily increased to a peak with the progression of stress before gradually declining.
3.4. Temporal Expression Characteristics of Functionally Related Genes Under PEG-Induced Osmotic Stress
To elucidate the temporal dynamics of gene expression in Pyrus betulifolia under PEG-induced osmotic stress, we analyzed DEGs associated with osmotic adjustment, hormone signaling, ROS scavenging, and cellular protection. As shown in Figure 6, these functional modules exhibited distinct temporal response patterns. regarding osmotic adjustment, Osmotic_Proline genes (Figure 6A) displayed a slight downward trend during the early-to-mid stages, followed by a marked increase at the late stage (48 h). In contrast, Osmotic_Sugar genes (Figure 6B) were significantly downregulated at 6–12 h but exhibited a rapid recovery to high expression levels during the late phase (24–48 h). In terms of hormone signaling, Hormone_ABA genes (Figure 6C) showed rapid upregulation at 3 h and peaked at 6 h; this was followed by a transient decline and a subsequent rebound at 24 h. ROS_Scavenging genes (Figure 6D) were significantly induced primarily during the mid-stress stage, whereas Protection_LEA genes (Figure 6E) were characterized by rapid early upregulation followed by sustained fluctuating expression. Conversely, Transport_Water genes (Figure 6F) showed an overall suppressive trend, with the most significant downregulation occurring at 12 h.
3.5. Identification and Temporal Analysis of Key Co-Expression Modules Responding to PEG-Induced Osmotic Stress
To elucidate the key gene networks regulating drought tolerance in plants, this study utilized Weighted Gene Co-expression Network Analysis (WGCNA) on time-series samples under Identification and Temporal Analysis of Key Co-expression Modules Responding to PEG-Induced Osmotic Stress. Using the dynamic tree cut method, a total of 22 co-expression modules were identified (Figure 7A). Among them, three modules exhibited significant and distinct temporal response characteristics (Figure 7B): the MEkhaki4 module (2811 genes) showed a specific transient induction at 12 h (Figure 7D); the MEmagenta2 module (1504 genes) maintained high expression levels during the mid-stress stage (12–24 h) (Figure 7E); and the MEgreen1 module (2343 genes) displayed a significant late-stage specific response, peaking at 48 h (Figure 7C). In contrast, the MEindianred4 module was significantly suppressed by drought stress. The biological functions of genes within the Green1, MEkhaki4, and MEmagenta2 modules were characterized using Gene Ontology (GO) enrichment analysis (Figure 8). The Green1 module predominantly comprised genes associated with the integral components of the membrane and nucleus. Notably, this module exhibited a marked enrichment in core regulatory categories, specifically DNA-binding transcription factor activity and the regulation of transcription. Such findings underscore its pivotal role in orchestrating transcriptional responses under stress conditions (Figure 8A). In contrast, the MEkhaki4 module was uniquely enriched in terms directly linked to photosynthetic activity—such as chloroplast, photosynthesis, and chlorophyll binding—over and above fundamental membrane components (Figure 8B). Simultaneously, the MEmagenta2 module demonstrated a high degree of correlation with nuclear localization and DNA-templated transcription, alongside essential signal transduction pathways, including protein serine/threonine kinase activity and protein phosphorylation (Figure 8C). Among the three clustering modules, differential genes exhibited distinct dynamic expression patterns (Figure 9). Some genes showed peak expression levels in the control group (CK), followed by a sustained decline with prolonged drought stress (PEG treatment). Conversely, other genes demonstrated gradual up-regulation over time. Additionally, certain genes exhibited a fluctuating trend of initial increase followed by decline, reaching expression peaks during the mid-stress phase (e.g., 6 h or 12 h).
3.6. Identification of Core Regulatory Hubs in Drought-Responsive Modules
Hub genes were defined as those with the highest intramodular connectivity within each module [17]. In the MEgreen1, MEkhaki4, and MEmagenta2 modules, a large number of differentially expressed genes (DEGs) were annotated as transcription factors, mainly belonging to the MYB, bZIP, and C2H2 families. Based on the hub gene-centered co-expression networks and their expression patterns, six transcription factors with important potential regulatory roles were selected from these three modules for further analysis, including the pseudo-response regulator 5 (PRR5) homolog GWHGAAYT000932, CONSTANS-LIKE 9 (COL9) homolog GWHGAAYT029012, nuclear transcription factor Y subunit C9 (NF-YC9) homolog GWHGAAYT014779, bZIP transcription factor EMBP-1 homolog GWHGAAYT015008, CONSTANS-LIKE 6 (COL6) homolog GWHGAAYT019191, and the MYB transcription factor REVEILLE 1 (RVE1) homolog GWHGAAYT056362 (Figure 10).
3.7. qRT-PCR Validation of Differentially Expressed Genes
To validate the reliability of RNA-seq data and confirm the expression patterns of the identified key regulatory hub genes, these six representative core genes were selected for qRT-PCR verification. As shown in Figure 11 and Figure S2, although there were slight fluctuations in absolute fold change values due to inherent sensitivity differences between the two technologies, the expression trends detected by qRT-PCR were highly consistent with the FPKM profiles obtained from RNA-seq.
4. Discussion
For perennial woody fruit trees such as the pear, drought tolerance is largely determined by the type of rootstock used. As a widely utilized and superior rootstock, Pyrus betulifolia exhibits significant drought resistance potential, making it a critical material for investigating drought adaptation mechanisms [18]. In this study, systematic transcriptomic profiling of leaves across multiple time points under PEG-induced osmotic stress revealed pronounced time-dependent regulatory dynamics during the stress response. The strong reproducibility among biological replicates and the clear transcriptomic separation among treatments underscore the robustness of our experimental design and the reliability of the sequencing data, providing a solid foundation for subsequent identification of differentially expressed genes and regulatory pathways. Notably, the number of differentially expressed genes (DEGs) peaked at 6 h, suggesting that this stage may represent a critical transition from stress perception to extensive transcriptional reprogramming. In contrast, only a limited number of DEGs were detected at 3 h, mainly reflecting the rapid perception of drought signals and the initiation of early stress responses. As the duration of stress extended beyond 12 h, the number of DEGs gradually decreased, with a pronounced decline observed at 24 h and 48 h, indicating an attenuation of transcriptional regulation intensity and suggesting that the plant may enter a relatively stable regulatory phase at the transcriptional level. It is noteworthy that the composition of differentially expressed genes (DEGs) varied markedly across different time points, indicating a clear phase-specific transcriptional response of Pyrus betulifolia to drought stress. At the early stage of stress (3 h), only a limited number of genes were rapidly activated, primarily involving pathways related to stress perception, hormone signal transduction, and initial osmotic adjustment, reflecting the rapid sensing and primary response of plants to water deficit. As stress progressed to 6 h and beyond, the number of DEGs increased substantially, with progressive activation of genes associated with carbohydrate metabolism, antioxidant defense, ionic homeostasis, and transcription factor regulation, suggesting a transition from transient stress signaling to extensive transcriptional reprogramming. This temporal regulatory pattern is highly consistent with the drought-responsive characteristics reported in Brassica oleracea [19], particularly in the coordinated regulation of starch and sucrose metabolism, osmolyte biosynthesis, and reactive oxygen species scavenging pathways. Furthermore, a large number of time-specific DEGs were identified between the 6 h and 48 h PEG treatments, which were mainly involved in the regulation of photosynthesis, reprogramming of energy metabolism, and hormone signaling pathways. These results imply that this period represents a critical transitional window during which P. betulifolia shifts from short-term stress responses to long-term adaptive regulation. This regulatory feature is in close agreement with the molecular response patterns observed in black cottonwood (Populus trichocarpa [20]), including metabolic reprogramming, enhancement of antioxidant defenses, and modulation of photosynthetic processes under drought conditions.
Moreover, functional analysis of PEG-induced DEGs indicated that P. betulifolia copes with water deficit primarily by coordinating signal transduction, metabolic regulation, and stress response-related processes. Although specific GO and KEGG enrichment results vary among species, the regulatory patterns revealed in this study are generally consistent with the transcriptional response characteristics of woody plants such as apple [21] under drought stress. Previous studies have shown that under drought conditions, plants typically activate various signaling and metabolic pathways to re-establish cellular ion homeostasis, osmotic balance, and reactive oxygen species (ROS) homeostasis, thereby mitigating stress-induced damage [22]. Functional analysis demonstrated that P. betulifolia responds to drought stress mainly by reprogramming metabolic pathways (such as starch and sucrose metabolism, and lipid metabolism) and hormone signaling pathways (such as plant hormone signal transduction). These metabolic adjustments likely facilitate the maintenance of cellular osmotic balance and energy homeostasis, which are fundamental to plant drought resistance [23]. In the early stage of stress (3 h), the MAPK signaling cascade was activated synchronously with proline and arginine metabolism. The significant enrichment of the MAPK signaling pathway further corroborates that the kinase cascade reaction is a core signal transduction mechanism in plant drought response. This pathway typically transmits signals via a MAP3K-MAP2K-MAPK phosphorylation cascade, amplifying the initial drought signals perceived by the cell membrane and transmitting them to the nucleus to activate specific transcription factors, ultimately regulating the expression of drought-related functional genes [24]. Entering the transcriptionally active phase (6–12 h), the response mechanism involved not only extensive hormone signal transduction and transcription factor regulation but also a significant enrichment of DNA repair pathways. This suggests that while mobilizing defense networks, P. betulifolia actively initiates genomic protection mechanisms to counter potential genetic damage caused by oxidative stress. As the stress extended to the late stage (24–48 h), the transcriptional focus gradually shifted toward starch and sucrose metabolism and protein processing in the endoplasmic reticulum.
Drought stress induces the expression of a series of transcription factors (TFs) that regulate physiological responses through complex signaling networks to alleviate drought-induced damage and play key roles in plant growth and development. We analyzed co-expression modules highly associated with drought-responsive genes and identified multiple hub transcription factors, including members of the C2H2, DBB, NF-Y, B3, C2C2, WRKY, bZIP, and bHLH families. Previous studies have confirmed that inducing C2H2 overexpression in sorghum significantly improves drought tolerance [25]. In wheat, overexpression of the C2H2 zinc finger transcription factor TaZAT8-5B enhances drought tolerance and root growth in Arabidopsis; its homologous genes regulate the expression of stress-related proteins such as superoxide dismutase and dehydroascorbate reductase, effectively scavenging ROS and thereby enhancing drought resistance [26]. Similar mechanisms have been reported in apple [27] and rice [28]. Additionally, the expression of DBB in wheat [29] and NF-Y in potato [30] has also been proven to increase drought stress tolerance in transgenic plants. Hormone regulation can also enhance drought resistance; for example, the wheat bHLH-type transcription factor gene TabHLH1 enhances cold tolerance by regulating osmotic stress tolerance via ABA-related pathways [31]. Another report indicated that salicylic acid treatment regulates root hair differentiation and growth by upregulating the expression of GLABRA2 (GL2), thereby improving drought tolerance [32].
Through time-series WGCNA, this study revealed a distinct phase-dependent regulatory strategy governing drought adaptation in P. betulifolia. Notably, the specific upregulation of chloroplast- and photosynthesis-related genes (MEkhaki4) at the early stage (12 h) suggests a ‘compensatory stability’ mechanism, where the plant prioritizes the transcriptional maintenance of photosynthetic machinery to prevent early oxidative damage [33]. Subsequently, the regulatory focus shifted towards active signal transduction during the mid-stage (12–24 h), as evidenced by the sustained enrichment of protein serine/threonine kinases in the MEmagenta2 module, which likely facilitates the transmission of osmotic signals to the nucleus [34]. Ultimately, the extensive activation of transcription factors in the MEgreen1 module at 48 h marks a critical transition from signal processing to systemic transcriptional reprogramming, establishing a new homeostatic state for long-term survival [35].
In the present study, weighted gene co-expression network analysis (WGCNA) effectively reduced the dimensionality of the transcriptomic data and successfully identified the core modules (MEgreen1, MEkhaki4, and MEmagenta2) responsive to osmotic stress, along with their highly connected internal hub genes. Notably, the genes occupying topological core positions within the network were extensively enriched in classic plant stress-responsive transcription factor families, such as MYB, bZIP, and C2H2 [36,37]. Building upon this network topology, we identified key factors with potential global regulatory roles, including PRR5, COL9, NF-YC9, EMBP-1, COL6, and RVE1, and performed qRT-PCR validation on six representative core node genes (GWHGAAYT000932, GWHGAAYT029012, GWHGAAYT014779, GWHGAAYT056362, GWHGAAYT019191, GWHGAAYT015008). The results demonstrated that although the absolute fold-change values exhibited minor fluctuations due to the inherent sensitivity differences between the two quantification techniques, the expression trends of these core genes were highly consistent with the FPKM profiles derived from RNA-seq. This not only strongly substantiates the high reliability of the current RNA-seq dataset but also further implies that these hub transcription factors act as critical molecular switches in the response of Pyrus betulifolia to PEG-induced osmotic stress, collectively driving the hierarchical transcriptional reprogramming of the downstream drought-protective network.
5. Conclusions
Using in-depth time-course transcriptome sequence analysis, we found several hypothetical transcription factors (such asWRKY, NAC, and BZIP), whose functions have already been implicated in the regulation of drought stress in other species. We suggest that these genes may have played an important role in the response of pear to drought stress. However, there are still limitations of our research, and although some genes have been identified, there remain deficiencies in testing their function. Future studies should focus on examining the function of these genes.
The reference list from the paper itself. Each links out to its DOI / PubMed record.
- 1Luo L.J. Breeding for water-saving and drought-resistance rice (WDR) in China J. Exp. Bot.2010613509351710.1093/jxb/erq 18520603281 · doi ↗ · pubmed ↗
- 2Hu C. Elias E. Nawrocki W.J. Croce R. Drought affects both photosystems in Arabidopsis thaliana New Phytol.202324066367510.1111/nph.1917137530066 · doi ↗ · pubmed ↗
- 3Chen Q. Dong H. Li Q. Sun X. Qiao X. Yin H. Xie Z. Qi K. Huang X. Zhang S. Pbr Chi A: A key chitinase of pear in response to Botryosphaeria dothidea infection by interacting with Pbr LYK 1b 2 and down-regulating ROS accumulation Hortic. Res.202310 uhad 18810.1093/hr/uhad 18837899950 PMC 10611555 · doi ↗ · pubmed ↗
- 4Wu J. Wang Z. Shi Z. Zhang S. Ming R. Zhu S. Khan M.A. Tao S. Korban S.S. Wang H. The genome of the pear (Pyrus bretschneideri Rehd.)Genome Res.20132339640810.1101/gr.144311.11223149293 PMC 3561880 · doi ↗ · pubmed ↗
- 5Goufo P. Moutinho-Pereira J.M. Jorge T.F. Correia C.M. Oliveira M.R. Rosa E.A.S. António C. Trindade H. Cowpea (Vigna unguiculata L. Walp.) Metabolomics: Osmoprotection as a Physiological Strategy for Drought Stress Resistance and Improved Yield Front. Plant Sci.2017858610.3389/fpls.2017.0058628473840 PMC 5397532 · doi ↗ · pubmed ↗
- 6Huber A.E. Bauerle T.L. Long-distance plant signaling pathways in response to multiple stressors: The gap in knowledge J. Exp. Bot.2016672063207910.1093/jxb/erw 09926944636 · doi ↗ · pubmed ↗
- 7Chen T. Li W. Hu X. Guo J. Liu A. Zhang B. A Cotton MYB Transcription Factor, Gb MYB 5, is Positively Involved in Plant Adaptive Response to Drought Stress Plant Cell Physiol.20155691792910.1093/pcp/pcv 01925657343 · doi ↗ · pubmed ↗
- 8Yang S. Xu K. Chen S. Li T. Xia H. Chen L. Liu H. Luo L. A stress-responsive b ZIP transcription factor Osb ZIP 62 improves drought and oxidative tolerance in rice BMC Plant Biol.20191926010.1186/s 12870-019-1872-131208338 PMC 6580479 · doi ↗ · pubmed ↗