Pan-Cancer Analysis of PAPPA Gene Reveals Tumor-Specific Prognostic Effects
Samah Mutasim Alfadul, Khalid Omama, Alisa Y. Potapova, Pavel A. Ivanov-Rostovtsev, Maryam Fanian, Reem Mubarak, Hind Ahmed Gasimelseed, Minas M. Balla, Amani M. A. Bakhiet, Khalid Berma, Mohamed Alfaki, Maria V. Babak

TL;DR
This study shows that the PAPPA gene's expression in stromal cells is linked to cancer prognosis, with mixed effects depending on cancer type.
Contribution
The study reveals PAPPA's tumor-specific prognostic effects and its association with cancer-associated fibroblasts in the tumor microenvironment.
Findings
High PAPPA expression correlates with poor survival in pancreatic and lung cancers but improved survival in some brain tumors.
PAPPA is primarily expressed in stromal cells rather than cancer cells in most tumors.
PAPPA remains an independent prognostic factor even when cancer-associated fibroblast infiltration is considered.
Abstract
Pregnancy-associated plasma protein A (PAPPA) is important for normal fetal development, but its exact role in cancer has been unclear. In this study, we analyzed PAPPA across many cancer types to understand how it relates to tumor progression and patient survival. We found that in many tumors, PAPPA is produced not by the cancer cells themselves but by surrounding connective or stromal cells, which can help shape a tumor-supportive environment. PAPPA is linked to worse outcomes in most cancers, while in others it is associated with better survival. Higher PAPPA levels in cancers such as pancreatic and lung cancer were generally associated with poorer prognosis, whereas in certain brain tumors they were linked to improved survival. These findings suggest that PAPPA may serve as a useful biomarker for assessing tumor aggressiveness and highlight the importance of the tumor…
Genes, proteins, chemicals, diseases, species, mutations and cell lines named across the full text — each resolved to its canonical identifier and authoritative record.
Click any figure to enlarge with its caption.
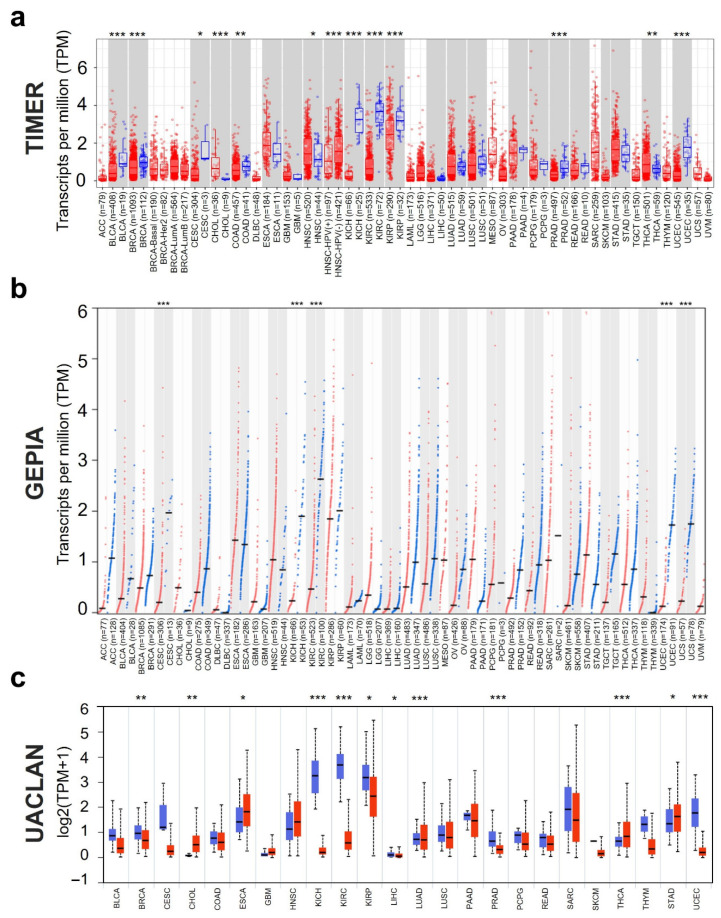 Figure 1
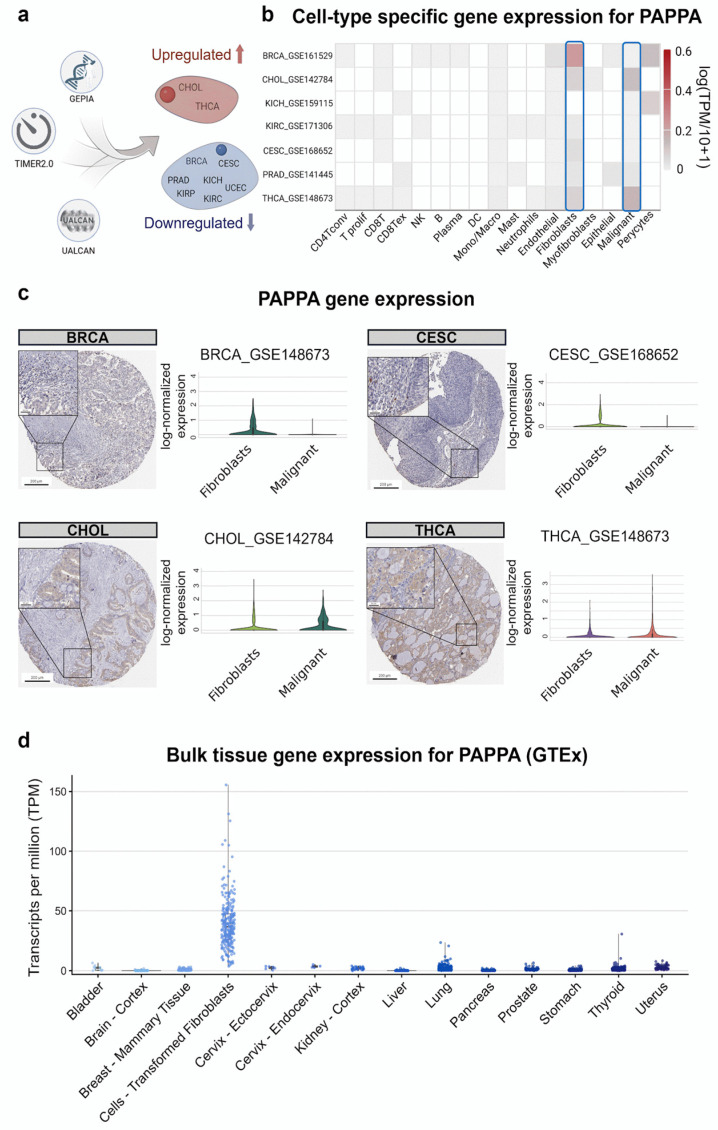 Figure 2
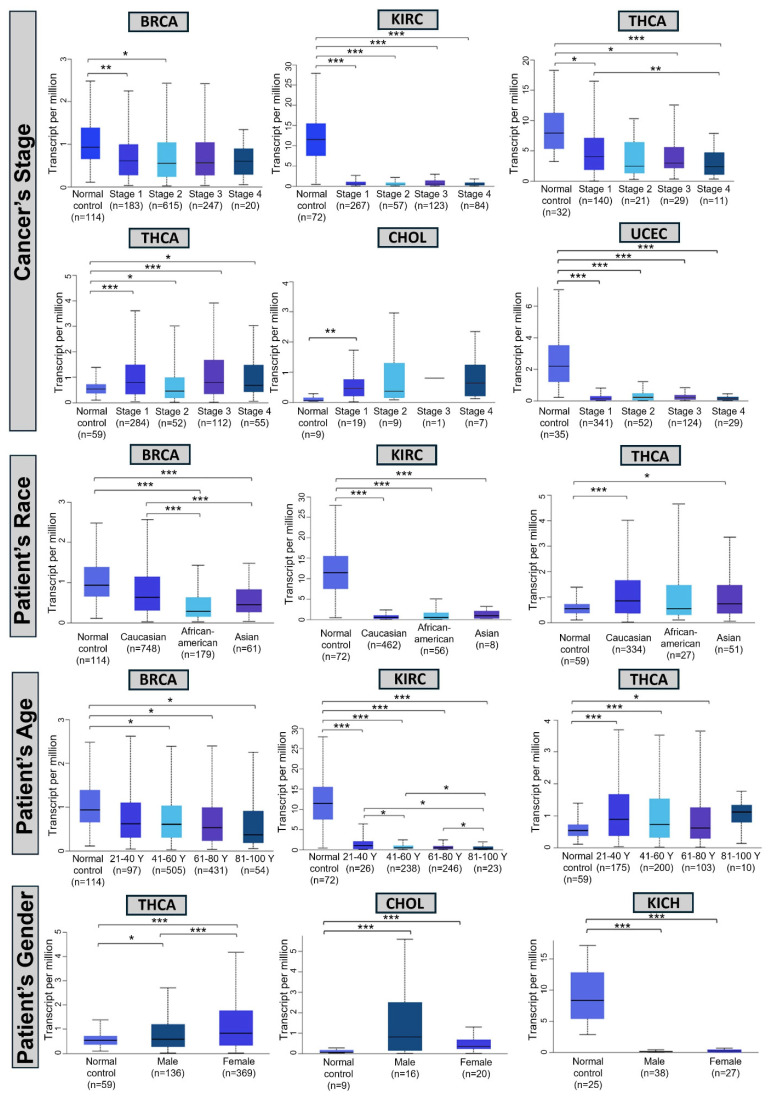 Figure 3
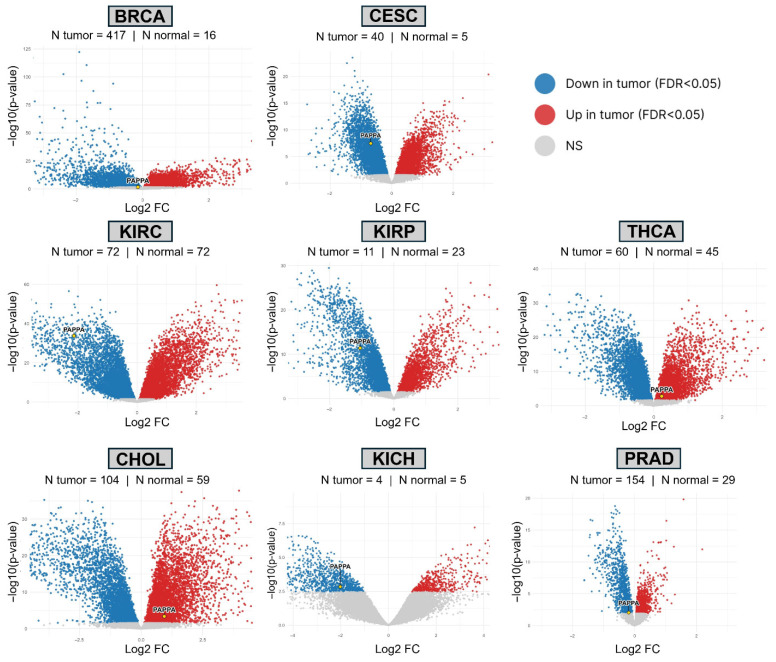 Figure 4
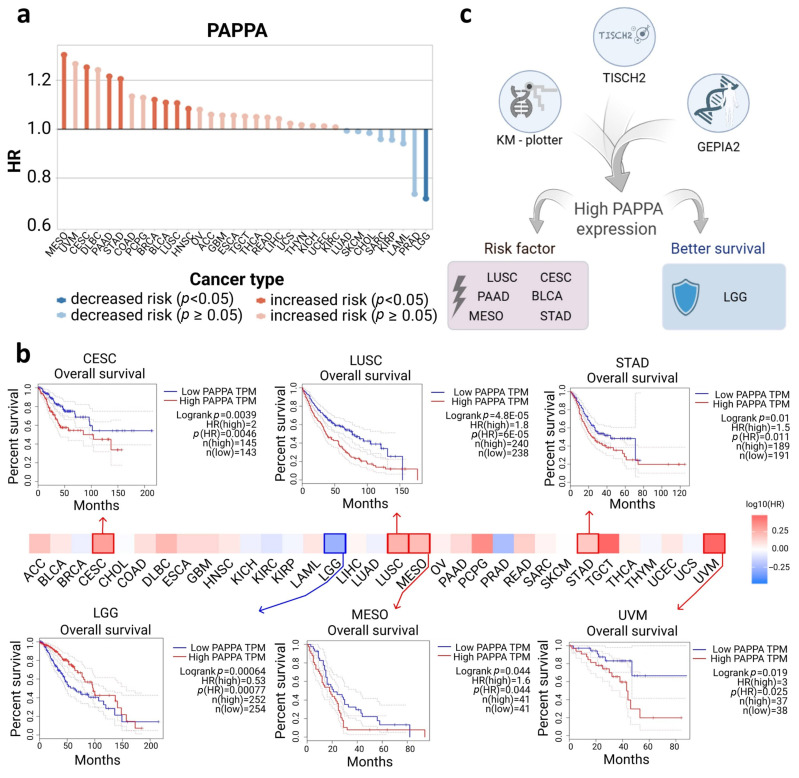 Figure 5
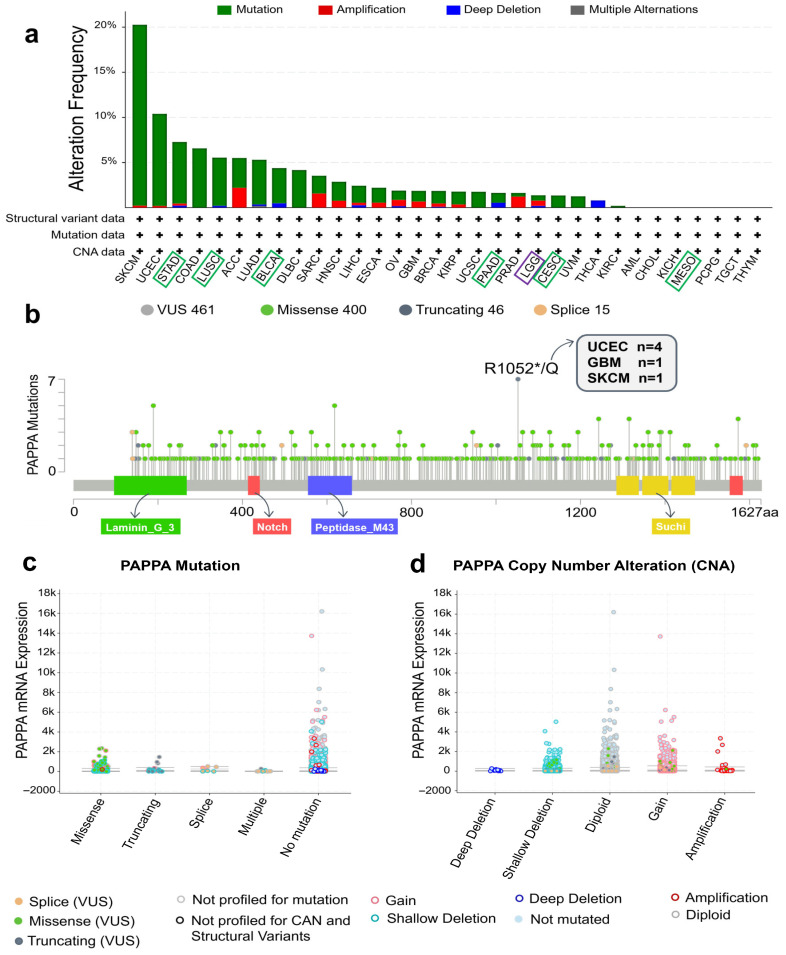 Figure 6
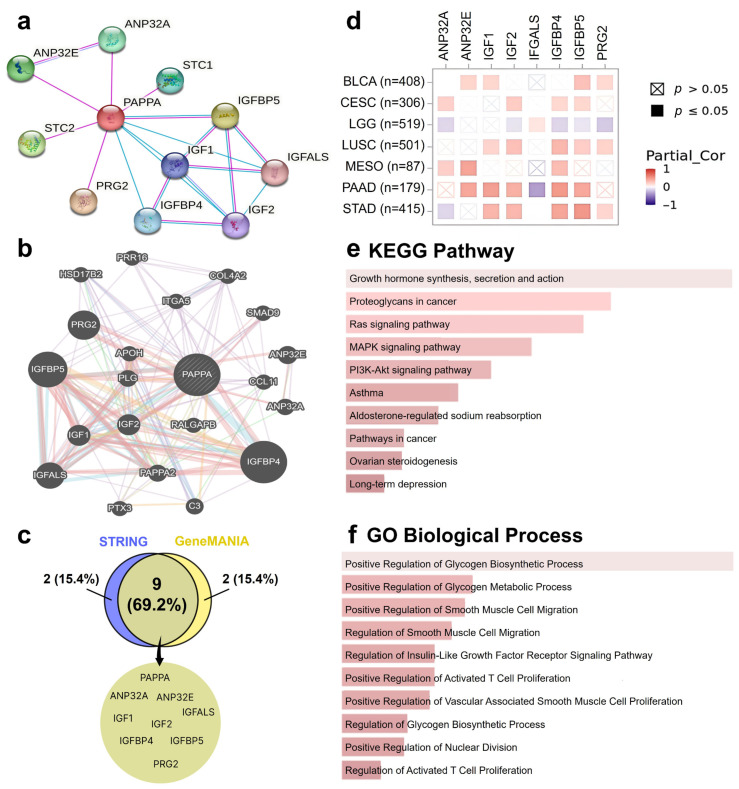 Figure 7
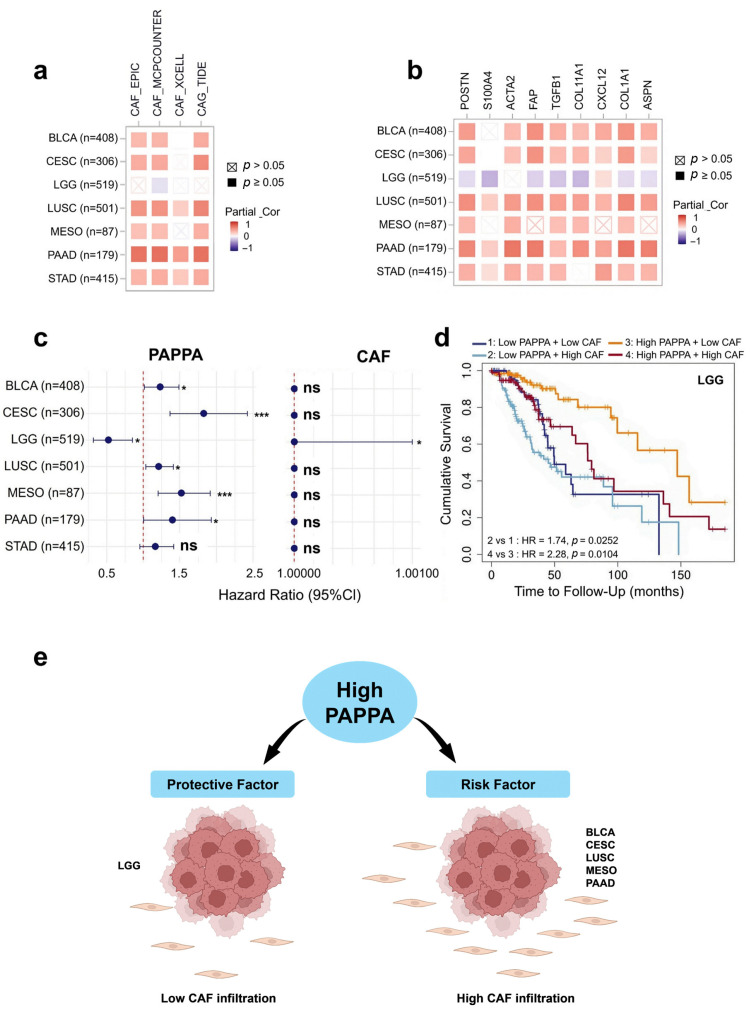 Figure 8
- —Institute of Digital Medicine, City University of Hong Kong
Peer Reviews
No public reviews on file for this paper yet. If you reviewed it on a platform where reviews are public (OpenReview, ICLR, NeurIPS, ICML), you can paste yours below so the community can read it here.
Videos
No videos yet. Explain this paper in a talk, walkthrough, or lecture? Add one.
Taxonomy
TopicsProtease and Inhibitor Mechanisms · Bone and Dental Protein Studies · Protein Kinase Regulation and GTPase Signaling
1. Introduction
Originally identified as a circulating placental antigen abundant in pregnancy, pregnancy-associated plasma protein A (PAPPA) is now recognized as a zinc-binding metalloproteinase with critical regulatory functions. PAPPA is a critical activator of the insulin-like growth factor (IGF) pathway, primarily through its ability to cleave IGF-binding protein-4 (IGFBP-4), thereby releasing IGFs to activate downstream signaling cascades such as the PI3K–AKT pathway [1,2,3,4]. This activation has broad implications, including roles in cell proliferation, survival, and inflammation. PAPPA is widely expressed in normal tissues, with the highest expression levels observed in the kidney and bone [5].
Despite its established role in normal physiology, its function in cancer remains controversial, with evidence supporting both oncogenic and tumor-suppressive properties. Numerous studies have demonstrated that PAPPA is overexpressed in several cancers, such as breast, ovarian, and lung cancers and Ewing sarcoma, where it acts as an oncogene, promoting tumorigenesis, invasion, and resistance to therapies [6,7,8,9]. Conversely, other studies have suggested that PAPPA functions as a tumor suppressor in specific cancer types. For example, it is epigenetically silenced in precursor lesions and invasive breast cancers, with its downregulation associated with enhanced invasiveness and chromosomal instability [10]. Similarly, in renal cell carcinoma, low PAPPA expression is linked to poor prognosis, whereas PAPPA overexpression has been shown to inhibit cell proliferation, migration, and invasion [11]. These findings suggest a context-specific role for PAPPA, potentially influenced by cancer type, tumor stage, and the surrounding microenvironment.
The conflicting evidence regarding PAPPA’s role in cancer highlights the need for a comprehensive understanding of its expression patterns and effect on prognosis across various cancer types. To address this complexity, we conducted a pan-cancer analysis to systematically examine PAPPA expression patterns, clinical relevance, prognostic value, immune infiltration, genetic alterations, and molecular interactions using The Cancer Genome Atlas (TCGA) and additional bioinformatic methods. Our study aimed to provide an integrated characterization of PAPPA and gauge its capacity to serve as a predictive clinical marker in diverse cancer types.
2. Materials and Methods
Details regarding bioinformatic resources, database specifications and modules utilized (Supplementary Table S1), processing of microarray validation datasets, immunohistochemical staining evaluation, survival analysis and statistical parameters, functional enrichment and network construction are provided in Supplementary Information.
Integrated expression profiling and clinical association. To systematically evaluate PAPPA dysregulation across diverse malignancies, we employed a multi-database mining strategy. Initial tumor-normal differential expression screenings were conducted using the TIMER2.0 (https://compbio.cn/timer2/, accessed on 2 February 2025) [12] and GEPIA2 (http://gepia2.cancer-pku.cn/, accessed on 2 February 2025) [13] platforms, followed by detailed stratification based on clinical parameters and promoter methylation status via UALCAN (https://ualcan.path.uab.edu/, accessed on 2 February 2025) [14,15]. All tumor expression analyses were based on TCGA project cohorts and reflect primary tumors at the site of origin; metastatic lesions were not analyzed as a separate category. The criteria for further analysis required consistent expression patterns across multiple independent datasets with statistically significant contrasts, whereby only cancer types that were found to be dysregulated in a similar fashion in at least two databases were further analyzed.
Single-cell characterization and tissue validation. To map transcriptomic signatures to specific cellular lineages within the tumor microenvironment (TME), single-cell transcriptomic profiles were retrieved and analyzed via the TISCH2 repository (http://tisch.comp-genomics.org/, accessed on 8 February 2025) [16]. These profiles were contextualized against baseline physiological expression in non-cancerous tissues using the GTEx project (https://gtexportal.org/home/, accessed on 8 February 2025) [17]. Furthermore, transcriptional findings were corroborated at the proteomic level by evaluating immunohistochemical (IHC) staining patterns from the Human Protein Atlas [18,19]. Tissue microarrays were assessed for staining intensity and subcellular localization to confirm tumor-specific protein expression.
Independent validation and statistical analysis. Validation of expression patterns was performed using external microarray cohorts retrieved from the Gene Expression Omnibus [20,21]. Data processing involved rigorous normalization and differential expression testing using the linear models for microarray data (limma) framework [22], applying the Benjamini–Hochberg correction procedure to maintain a controlled false discovery rate. Comprehensive details regarding data processing and statistical parameters are provided in Supplementary Information.
Prognostic modeling and survival analysis. The clinical relevance of PAPPA was assessed by modeling its association with patient survival outcomes. Kaplan–Meier survival estimates and hazard ratios were generated using the Kaplan–Meier Plotter (https://kmplot.com/analysis, accessed on 8 February 2025) [23,24] and validated using TISCH2 and GEPIA2. Samples were dichotomized into groups with elevated versus diminished transcript levels using the median gene expression value as the cutoff to determine the prognostic impact on overall and disease-free survival, unless the database algorithm specified an optimal cutoff. Samples from TISCH2 are derived from TCGA datasets, rather than from single-cell sequencing samples themselves [16].
Immune landscape and genomic alterations. To characterize the immunological landscape, we quantified the correlation between gene expression and the abundance of tumor-infiltrating immune cells (TIICs) using the TIMER algorithm implemented in TIMER, where gene–cell correlations were assessed using purity-adjusted Spearman correlation coefficients, as provided by the Gene module [25,26]. In parallel, genomic stability was investigated by analyzing somatic mutations and copy number variations (CNVs) via the cBioPortal for Cancer Genomics [27,28,29], allowing for the assessment of genetic alterations associated with PAPPA dysregulation.
Functional enrichment and network analysis. Potential biological mechanisms were elucidated by constructing protein–protein interaction networks utilizing the STRING (https://string-db.org/, accessed on 7 February 2025) [30,31] and GeneMANIA (http://genemania.org/, accessed on 7 February 2025) [32] databases. A consensus gene set derived from these interactions was subjected to Gene Ontology (GO) and KEGG pathway enrichment analyses using Enrichr (https://maayanlab.cloud/Enrichr/, accessed on 7 February 2025) [33,34,35] to identify key signaling cascades and biological processes. Finally, the role of stromal components was investigated by analyzing the infiltration of cancer-associated fibroblasts (CAFs), and their correlation with established marker genes using the TIMER algorithm in TIMER2.0 (https://compbio.cn/timer2/, accessed on 15 February 2025).
Cox risk regression analysis. Cox multivariable regression analyses were performed using the TIMER2.0 platform (accessed on 23 January 2026) to evaluate the independent effects of PAPPA expression and tumor purity on overall survival (OS) using the model Surv(OS, EVENT) ~ Purity + PAPPA. A second model incorporating cancer-associated fibroblast (CAF) infiltration (Surv(OS, EVENT) ~ Infiltrate + Purity + PAPPA) was additionally examined, and the resulting estimates were visualized as forest plots in R (version 4.3.1) using the “forestplot” package.
3. Results
3.1. PAPPA Gene Expression in Pan-Cancer Analysis
The differences in PAPPA gene expression levels between tumor and normal tissues were analyzed using data from three independent databases (Supplementary Table S2). Tumor Immune Estimation Resource 2 (TIMER2.0), Gene Expression Profiling Interactive Analysis 2 (GEPIA2), and University of Alabama at Birmingham Cancer Data Analysis Portal (UALCAN). This multi-database approach ensured the robustness of findings, with significant differential expression determined based on consistent results observed in at least two of the three databases.
The TIMER2.0 analysis revealed significant differences in PAPPA expression across 12 tumor types. Notably, PAPPA expression was significantly upregulated in cholangiocarcinoma (CHOL) (p < 0.001), head and neck squamous cell carcinoma (HNSC) (p < 0.05), and thyroid carcinoma (THCA) (p < 0.01) but downregulated in the remaining nine cancers, namely bladder urothelial carcinoma (BLCA) (p < 0.001), breast invasive carcinoma (BRCA) (p < 0.001), cervical squamous cell carcinoma and endocervical adenocarcinoma (CESC), colon adenocarcinoma (p < 0.01), kidney chromophobe (KICH) (p < 0.001), kidney renal clear cell carcinoma (KIRC) (p < 0.001), kidney renal papillary cell carcinoma (KIRP) (p < 0.001), prostate adenocarcinoma (PRAD) (p < 0.001), and uterine corpus endometrial carcinoma (UCEC) (p < 0.001) (Figure 1a).
To validate these findings, we analyzed PAPPA expression using the GEPIA2 platform, which identified five cancers, namely CESC, KICH, KIRC, UCEC, and uterine carcinosarcoma (UCS), with significantly different PAPPA expression between tumor tissues and adjacent normal tissues. Specifically, all five cancers exhibited significantly downregulated PAPPA expression (p < 0.001) in tumor tissues (Figure 1b). Notably, all GEPIA2-identified cancers except UCS were also detected by TIMER2, demonstrating strong inter-database concordance.
Further confirmation was obtained using the UALCAN platform. This platform validated PAPPA upregulation in CHOL and THCA (p < 0.05) and downregulation in BRCA, KICH, KIRC, KIRP, PRAD, and UCEC (all p < 0.05). Interestingly, UALCAN uniquely identified significantly reduced PAPPA expression in stomach adenocarcinoma (STAD) (p < 0.001), which was not detected in the other two databases (Figure 1c).
For further analysis, we prioritized cancers that showed consistent changes in PAPPA expression in at least two databases, which corresponded to TCGA-defined primary tumor entities. These included two cancers with upregulated PAPPA expression (CHOL and THCA) and seven with downregulated PAPPA expression (BRCA, CESC, KICH, KIRC, KIRP, PRAD, and UCEC) (Figure 2a).
3.2. Single-Cell Expression Analysis Highlights a Stromal Origin for PAPPA
Given that PAPPA expression was largely downregulated in bulk tumor tissues, we investigated its cellular source using single-cell RNA sequencing (scRNA-seq) to determine the tumor microenvironment compartments responsible for its expression. The Tumor Immune Single-cell Hub 2 (TISCH2) database analysis revealed that PAPPA expression was predominantly localized to fibroblasts across multiple cancer types, with minimal or undetectable expression in malignant cells, except in CHOL and THCA (Figure 2b). A comprehensive view of PAPPA expression across all cell types from TISCH2 is provided in Supplementary Figure S1.
To determine the cellular source of PAPPA in cancer tissues, we examined immunohistochemistry (IHC) images from the Human Protein Atlas. The observed staining patterns were consistent with our single-cell expression analysis across multiple cancer types (Figure 2c). In BRCA and CESC, PAPPA staining was predominantly detected in stromal, non-malignant cells, supporting the low PAPPA expression levels found in tumor cells from these cancers. In contrast, in CHOL and THCA, PAPPA staining was primarily localized to cancer cells. To further validate the IHC results, we performed quantitative analysis of single-cell gene expression in malignant and fibroblast cells using TISCH2. The results are shown as violin plots displayed in Figure 2c. In BRCA and CESC, PAPPA expression was higher in fibroblasts (42.3% and 15.1%, respectively) than in malignant cells, which remained below the detection threshold. Conversely, CHOL and THCA exhibited higher expression in malignant cells (69.9% and 67.9%, respectively) and lower expression in fibroblasts (47.7% and no significant signal, respectively).
To further assess stromal contribution at the bulk-tumor level, we performed tumor purity analysis using TIMER2.0. This revealed a predominantly significant negative correlation between PAPPA expression and tumor purity in dysregulated cancers, including BRCA (r = −0.29, p < 0.001), CESC (r = −0.19, p = 0.001), KICH (r = −0.28, p < 0.05), PRAD (r = −0.41, p < 0.001), and UCEC (r = −0.16, p < 0.01). THCA also showed a negative association, although it represented the weakest correlation among the statistically significant cancers (r = −0.09, p < 0.05). In contrast, CHOL, KIRC, and KIRP exhibited weaker, non-significant correlations.
To confirm that fibroblasts also represent the principal non-malignant source of PAPPA under physiological conditions, we interrogated the Genotype-Tissue Expression (GTEx) database, which similarly demonstrated predominant PAPPA expression in fibroblast populations (Figure 2d). Collectively, these findings support stromal enrichment and suggest that bulk tumor PAPPA levels largely reflect fibroblast abundance rather than tumor cell–intrinsic transcriptional regulation.
3.3. Clinical Features of PAPPA Expression
To contextualize PAPPA within a clinical framework, we analyzed its relationship to various clinical parameters using the UALCAN database. This analysis included comparisons by tumor stage, patient race, age, and sex (Figure 3). At advanced disease stages, PAPPA expression differed significantly between tumor and normal tissues in BRCA, CHOL, KIRC, KIRP, THCA, and UCSC. Among these, KIRP was the only cancer type exhibiting significant intra-stage variation, with PAPPA expression markedly reduced in stage IV malignancies relative to stage I lesions (p < 0.01).
In racial comparisons, distinct PAPPA expression patterns were observed in BRCA, KIRC, and THCA across different races. Notably, marked disparities were observed between malignant and adjacent normal samples in KIRC and THCA across racial groups. In contrast, BRCA uniquely displayed variation between races, with PAPPA expression in Caucasian patients differing significantly from those in both African American and Asian patients (both with p < 0.001).
Age-related variations in PAPPA expression were also observed in BRCA, KIRC, and THCA when compared with normal tissues. Among these, KIRC uniquely exhibited significant differences among the age groups. Specifically, PAPPA expression was significantly lower in younger individuals (21–40 years) than in older groups (41–60 years and 61–80 years; p < 0.05). Furthermore, a progressive decline in PAPPA expression was observed with advancing age, as intermediate age groups (41–60 years and 61–80 years) exhibited decreased expression compared with the oldest cohort (81–100 years; p < 0.05).
Finally, sex-associated differences were observed in CHOL, KICH, and THCA, with all three cancers showing significant divergence in transcript abundance between cancerous and non-neoplastic tissues. THCA was the only cancer additionally displaying significant expression differences between men and women (p < 0.001). Additional clinical parameters are provided in Supplementary Figure S2.
3.4. Methylation Status and Its Correlation with PAPPA Expression
To investigate potential epigenetic regulation of PAPPA among dysregulated cancers, we analyzed its promoter methylation status across cancer types using UALCAN (tumor–normal group comparisons) (Supplementary Figure S3). The PAPPA promoter exhibited significantly lower methylation levels in CHOL (p < 0.05) and THCA (p < 0.001) than in normal tissues, which aligned with the upregulated PAPPA gene expression observed in these cancers. In contrast, in KIRC (p < 0.05) and KIRP (p < 0.001), despite lower promoter methylation, PAPPA expression was paradoxically downregulated. For the remaining cancers analyzed (BRCA, CESC, KICH, PRAD, and UCS), no significant differences in promoter methylation were observed. To further evaluate whether promoter methylation was associated with transcriptional output, sample-level expression–methylation correlations were subsequently examined using TCGA PanCancer Atlas datasets in cBioPortal for cancers showing significant group-level differences (Supplementary Figure S4). A significant inverse association was observed only in THCA (Spearman r = −0.32, p < 0.001), whereas CHOL, KIRC, and KIRP showed non-significant correlations.
3.5. PAPPA Gene Expression from Clinical GEO Datasets
To assess the reproducibility of PAPPA deregulation, we analyzed eight Gene Expression Omnibus (GEO) datasets covering BRCA (GSE54002), CESC (GSE7410), KICH (GSE11151), KIRC (GSE53757), KIRP (GSE15641), PRAD (GSE21034), CHOL (GSE26566), and THCA (GSE33630). Each cohort included both primary tumor samples, metastatic samples and non-malignant samples profiled on microarray platforms. All identified tumor samples, including metastatic lesions, were included in the differential expression analysis. Genome-wide volcano plots were generated for every dataset, with PAPPA labeled to show its position relative to all other genes. Tumor and normal sample counts for each cohort are displayed in the panels (Figure 4).
Across these datasets, PAPPA expression showed a uniform direction of change for each cancer type. Compared with normal tissue, BRCA, CESC, KICH, KIRC, KIRP, and PRAD demonstrated lower PAPPA expression in tumors, whereas CHOL and THCA showed higher PAPPA expression. Kidney cohorts displayed the largest fold changes, supported by tumor–normal sampling. Cohorts with fewer normal samples, such as BRCA and PRAD, had smaller effect sizes but retained statistical significance.
Differences in effect magnitude between datasets reflect underlying tissue composition, sample size, and platform characteristics. Studies with matched or near-matched tumor–normal sampling, particularly the kidney cohorts, produced clear contrasts. Cancers with limited availability of normal controls showed narrower fold-change distributions, but the direction of PAPPA expression change remained stable.
These cross-cohort comparisons confirm that PAPPA deregulation is consistent across independent patient datasets. Reduced expression in several epithelial and renal cancers, along with increased expression in CHOL and THCA, supports tumor-type-specific regulation of PAPPA.
3.6. Overall Survival Analysis of PAPPA Expression
To evaluate the effect of PAPPA expression on patient prognosis, overall survival (OS) analyses were performed by stratifying patients into high- and low-expression groups using three independent databases: TISCH2, GEPIA2, and Kaplan–Meier Plotter.
TISCH2 identified nine significant cancers (Figure 5a). High PAPPA expression functions as a risk factor in eight of them: mesothelioma (MESO), CESC, PAAD, and STAD (p < 0.05, hazard ratio [HR] ≥ 1.2), as well as BRCA, BLCA, LUSC, and HNSC, as cancers in which elevated PAPPA was similarly associated with poor prognosis (p < 0.05, 1.2 < HR < 1.5). In contrast, lower-grade glioma (LGG) remained the only cancer where high PAPPA expression correlated with better survival (p < 0.05, 0.6 < HR < 0.8).
GEPIA2 identified five major cancers (Figure 5b) in which elevated PAPPA levels predicted shorter overall survival: CESC (p < 0.01, HR = 2.0), lung squamous cell carcinoma (LUSC; p < 0.001, HR = 1.8), (MESO; p < 0.05, HR = 1.6), STAD (p < 0.05, HR = 1.5), and uveal melanoma (UVM; p < 0.05, HR = 3.0). Consistent with TISCH2, LGG (p < 0.001, HR = 0.53) showed that high PAPPA expression correlated with better OS.
Kaplan–Meier Plotter identified five cancers (Supplementary Figure S5), all showing high PAPPA expression as the risk factor: BLCA (p < 0.05, HR = 1.11), CESC (p < 0.001, HR = 1.24), LUSC (p < 0.05, HR = 1.10), PAAD (p < 0.05, HR = 1.17), and STAD (p < 0.01, HR = 1.21).
Integrative survival analysis revealed seven cancers identified by at least two databases (Figure 5c). Among these, six cancers (BLCA, CESC, LUSC, MESO, PAAD, and STAD) consistently showed poor prognosis associated with high PAPPA expression. In contrast, in LGG, high PAPPA expression predicted improved OS, highlighting a distinct, tumor-specific role of PAPPA.
3.7. Correlation of PAPPA with Immune Cell Infiltration
Immune infiltration analysis revealed distinct cancer-specific associations between PAPPA expression and the tumor immune landscape. To explore whether PAPPA levels were linked to immune composition, TIMER analysis was performed (Supplementary Table S3 and Figure S6).
In BLCA, PAPPA displayed an inverse relationship with tumor purity (r = −0.40, p < 0.001) and a positive correlation with dendritic cells (r = 0.38, p < 0.001). In LUSC, PAPPA expression was likewise negatively correlated with purity (r = −0.31, p < 0.001) and positively associated with neutrophils (r = 0.30, p < 0.001). PAAD exhibited the most pronounced immune-enriched profile, with strong positive correlations with macrophages (r = 0.56, p < 0.001) and CD8^+^ T cells (r = 0.51, p < 0.001).
In contrast, LGG demonstrated an opposite pattern, with PAPPA positively correlated with tumor purity (r = 0.13, p = 0.004) but negatively associated with dendritic cells (r = −0.21, p < 0.001), indicating a distinct microenvironmental context. Other tumor types showed weaker or non-significant associations.
To determine whether these microenvironmental associations translated into independent survival effects, multivariable Cox regression analyses incorporating PAPPA expression and tumor purity were performed. The results largely mirrored the univariate OS trends, with PAPPA remaining a significant risk factor in BLCA (HR = 1.25, p < 0.05), CESC (HR = 1.83, p < 0.001), LUSC (HR = 1.20, p = 0.013), MESO (HR = 1.54, p < 0.001), and STAD (HR = 1.21, p < 0.05). Notably, PAAD, which previously exhibited the strongest immune and stromal infiltration pattern, lost statistical significance after purity adjustment. In contrast, LGG retained a significant protective association (HR = 0.55, p < 0.05), suggesting a biologically distinct, tumor cell-linked role of PAPPA in this context.
3.8. Genetic Alteration Analysis
We used cBioPortal to investigate possible genetic mechanisms of PAPPA dysregulation in cancer. Across 10,967 samples covering 32 TCGA tumor types, we assessed PAPPA for alteration frequency, specific mutation types, and copy number alterations (CNAs). Genetic alterations in the PAPPA gene have been identified across 25 different tumor types. Among these alterations, mutations were the most frequent, followed by amplifications. Notably, melanoma, despite not showing any dysregulation in PAPPA expression compared to normal tissue, had the highest mutation frequency (20%). Among the seven identified prognostic cancers, the mutation frequency was relatively low: STAD (7%), LUSC (6%), and the remaining cancers were below 5%. Interestingly, LGG, which is the only cancer where high PAPPA expression is associated with an improved prognosis, exhibited the highest amplification frequency among these seven cancers (0.6%) (Figure 6a). A total of 461 PAPPA mutation sites were identified across TCGA samples. For instance, a truncating mutation (R1052*/Q) was detected in UCEC, GBM, and SKCM (Figure 6b). Missense mutations showed the strongest association with changes in PAPPA mRNA levels, followed by truncating mutations (Figure 6c).
The CNA analysis revealed that shallow deletions were the most common alterations affecting PAPPA, whereas deep deletions were less frequent and showed only a minimal impact on PAPPA mRNA expression (Figure 6d). Thereafter, we evaluated the effect of genetic alterations of PAPPA on the clinical outcomes of patients. No significant differences in OS or disease-free survival were observed between the altered and non-altered groups (Supplementary Figure S7).
3.9. PAPPA Enrichment Analysis
To gain a comprehensive understanding of the biological functions of PAPPA, we analyzed its interaction networks using the STRING and GeneMANIA databases.
First, we constructed a protein–protein interaction network in STRING, identifying the top 10 proteins most closely associated with PAPPA (Figure 7a). A similar gene interaction network was generated in GeneMANIA (Figure 7b). To highlight overlapping partners across both platforms, we compared the two networks using a Venn diagram, which revealed nine common genes, including PAPPA itself (Figure 7c).
Next, we evaluated the correlation between PAPPA and these eight genes across multiple cancers using the TIMER2.0 database with tumor purity adjustment. The heatmap (Figure 7d) illustrated these correlations. Among all genes investigated, IGFBP4, IGFBP5, IGF1, were the most consistently prevalent, showing positive correlations across multiple cancers with the strongest correlations observed in STAD (IGFBP5: r = 0.50, p < 0.001; IGFBP4: r = 0.42, p < 0.001; IGF1: r = 0.34, p < 0.001), followed by PAAD (IGFBP4: r = 0.48, p < 0.001; IGF1: r = 0.45, p < 0.001; IGFBP5: r = 0.41, p < 0.001). Although IGF1 was positively correlated with PAPPA, its correlation coefficients were consistently weaker than those observed for IGFBP4 and/or IGFBP5 within the same tumor types. Interestingly, in LGG, PAPPA expression showed predominantly negative correlations with six genes, including IGFBP5 (r = −0.09, p < 0.05) and IGFBP4 (r = −0.15, p < 0.001), while no significant correlation was observed with IGF1.
We next explored the molecular functions of PAPPA within the tumor context by utilizing Kyoto Encyclopedia of Genes and Genomes (KEGG) pathway enrichment analysis, which revealed strong associations of PAPPA with cancer and immune-related pathways, including growth hormone synthesis and secretion, proteoglycans in cancer, and oncogenic cascades such as RAS, MAPK, and PI3K–AKT signaling (Figure 7e). Consistently, Gene Ontology (GO) enrichment analysis demonstrated PAPPA’s involvement in the IGF receptor signaling pathway, regulation of glycogen metabolism, and regulation of smooth muscle cell migration and proliferation (Figure 7f).
3.10. PAPPA and Cancer-Associated Fibroblasts
To further investigate the role of PAPPA in the tumor microenvironment, we assessed its association with cancer-associated fibroblasts (CAFs), a major stromal component implicated in immune suppression and tumor progression. CAF infiltration was estimated using TIMER2.0, and correlations between PAPPA expression and CAF levels were calculated with tumor purity adjustment across cancers identified from the overall survival analysis (Figure 8a). Only cancers that showed significant correlations in at least two CAF estimation algorithms were considered. The results from MCP-COUNTER algorithms demonstrated that PAPPA expression was significantly positively correlated with CAF infiltration in BLCA (r = 0.36, p < 0.001), CESC (r = 0.41, p < 0.001), LUSC (r = 0.53, p < 0.001), MESO (r = 0.32, p < 0.01), PAAD (r = 0.70, p < 0.001), and STAD (r = 0.40, p < 0.001). In contrast, LGG displayed a weak but significant negative correlation (r = −0.10, p < 0.05) (Supplementary Table S4).
Next, we performed CAF marker analysis using TIMER2.0 to assess the correlation between PAPPA expression and various CAF markers (Figure 8b). After tumor purity adjustment, the results demonstrated that CAF markers, including POSTN, ACTA2, TGFB1, and COL1A1, were positively correlated with PAPPA expression across all cancers in which high PAPPA expression was associated with poor prognosis. Among these cancers, PAAD showed the strongest associations, with a strong positive correlation observed for ACTA2 (r = 0.64, p < 0.001), COL1A1 (r = 0.64, p < 0.001), FAP (r = 0.62, p < 0.001), and COL11A1 (r = 0.51, p < 0.001). In contrast, LGG displayed negative correlations between PAPPA expression and 7 CAF markers, including S100A4 (r = −0.26, p < 0.001), COL11A1 (r = −0.24, p < 0.001), TGFB1 (r = −0.20, p < 0.001), FAP (r = −0.14, p < 0.01).
To assess whether PAPPA-associated effects depended on CAF abundance, multivariable Cox proportional hazards regression was performed using TIMER2.0, incorporating PAPPA expression and CAF infiltration, and the results are presented as a forest plot (Figure 8c). Across most cancers, PAPPA remained significantly associated with overall survival, whereas CAF infiltration was not significant. In LGG, PAPPA remained protective (HR = 0.52, p < 0.01) while CAF infiltration was associated with poorer survival (HR ≈ 1.00, p < 0.001). Kaplan–Meier analysis further supported this pattern, showing that high PAPPA expression was associated with improved survival, particularly in tumors with low CAF infiltration (Figure 8d). The combined relationship between PAPPA expression, CAF abundance, and patient prognosis is summarized in the schematic model (Figure 8e).
4. Discussion
PAPPA is a key enzymatic regulator of IGF signaling, cleaving IGFBP-4 to amplify local growth factor availability within the tumor microenvironment. However, its role in cancer remains ambiguous, with evidence supporting both oncogenic and tumor-suppressive activities [2,15]. The present pan-cancer analysis evaluated PAPPA gene expression patterns, prognostic significance, and its association with cancer-associated fibroblast (CAF) infiltration across multiple cancer types, highlighting the microenvironmental context.
PAPPA expression was significantly dysregulated across nine cancer types, being downregulated in seven cancers (BRCA, CESC, KICH, KIRC, KIRP, PRAD, and UCEC) and upregulated in two (CHOL and THCA). Independent GEO datasets largely validated these expression patterns. Single-cell RNA-seq analysis demonstrated that PAPPA was predominantly expressed in stromal fibroblasts rather than malignant epithelial cells in most tumors. In contrast, in CHOL and THCA, PAPPA expression was detected in both stromal and tumor cells, a finding further supported by immunohistochemical staining demonstrating PAPPA positivity within malignant cells.
Consistent with this cellular distribution, tumor-purity analysis revealed predominantly significant inverse correlations between PAPPA expression and tumor purity across dysregulated cancers, with THCA showing a comparatively weaker but still significant association, whereas CHOL, KIRC, and KIRP exhibited weak or non-significant correlations, indicating that bulk PAPPA levels in most tumors largely reflect stromal/fibroblast abundance rather than tumor cell–intrinsic transcription. This spatial distribution suggests that PAPPA is primarily a paracrine factor that may participate in influencing tumor growth, invasion, and immune regulation [8].
Promoter methylation analysis based on tumor–normal bulk comparisons revealed PAPPA hypomethylation in CHOL, THCA, KIRC, and KIRP, suggesting a context-dependent epigenetic contribution to its regulation. This pattern was consistent with PAPPA upregulation in CHOL and THCA, whereas KIRC and KIRP displayed reduced PAPPA expression despite lower promoter methylation. However, when assessed at the individual tumor sample level, expression–methylation correlation was significant only in THCA, whereas CHOL, KIRC, and KIRP showed non-significant correlations. Together, these findings indicate that promoter methylation alone does not fully explain PAPPA transcriptional variability and that cellular composition or additional regulatory mechanisms may contribute [36].
Survival analyses indicated that high PAPPA expression was associated with worse outcomes in BLCA, CESC, LUSC, MESO, PAAD, and STAD, whereas favorable outcomes were observed in LGG. Notably, these trends remained largely stable after adjustment for tumor purity, suggesting that PAPPA’s prognostic relevance is not merely a by-product of stromal proportion but reflects a partially independent biological signal.
Genetic alteration analysis revealed a low mutation frequency of PAPPA, with more than 86% of detected variants being missense. This observation is consistent with previous reports indicating a limited phenotypic impact of PAPPA mutations [2]. Gene interaction analyses showed generally stronger correlations with IGFBP4 and IGFBP5 and IGF1 across multiple cancers, suggesting a closer transcriptional association within the IGF-binding protein axis. KEGG pathway enrichment further identified proteoglycans in cancer, PI3K–AKT, and RAS signaling pathways as recurrent PAPPA-associated pathways [37].
A particularly noteworthy finding was the strong and consistent association between PAPPA expression and both CAF infiltration and canonical CAF marker genes across multiple cancers. In tumors with adverse outcomes, PAPPA levels correlated positively with CAF abundance and marker expression. Multivariable Cox regression accounting for CAF infiltration and tumor purity showed that PAPPA remained an independent prognostic factor in most cancers, whereas CAF infiltration was mostly not significant, indicating that PAPPA’s effect on survival is not fully explained by CAF abundance.
These observations are consistent with accumulating experimental evidence indicating that PAPPA functions as an active microenvironmental regulator rather than merely a passive stromal marker. Multiple mechanistic studies converge on the concept that PAPPA does not simply reflect fibroblast presence but actively participates in stromal remodeling processes that facilitate tumor expansion and invasion. For example, in gastric cancer, proteolytically active PAPPA secreted by tumor cells and CAFs increases local IGF bioavailability and “educates” adjacent quiescent fibroblasts toward pro-tumor phenotypes, thereby establishing a feed-forward loop that promotes tumor growth, invasion, and metastatic dissemination [38].
Parallel findings in non-small cell lung cancer demonstrate that PAPPA secretion is required to drive in vivo xenograft growth, while in vitro proliferation is unaffected; only expression that elevates serum PAPPA levels increases tumor weight [8]. Comparable patterns have been reported in hepatocellular carcinoma, where PAPPA is predominantly expressed by hepatic stellate cell–derived myofibroblasts, while malignant hepatocytes exhibit minimal expression, indicating that its tumor-promoting activity is largely mediated through paracrine stromal mechanisms [39].
Consistent with the role of PAPPA as a risk factor, experimental studies in ovarian cancer have demonstrated that elevated PAPPA promotes tumor growth and platinum resistance, while PAPPA neutralization enhances cisplatin sensitivity and improves therapy response [40,41].
Interestingly, in LGG, which generally has a favorable prognosis, although CAF infiltration was low and negatively correlated with PAPPA expression, Cox analysis showed that even this limited CAF presence was associated with poorer survival. Despite this, PAPPA remained a significant protective factor, with high expression linked to better outcomes, particularly in tumors with low CAF abundance. These results are supported by a prior study, indicating that CAFs can influence outcomes even in fibroblast-poor LGG tumors [42].
Collectively, our results suggest a model (Figure 8e) in which PAPPA functions as a prognostic risk factor in several cancers, often marking a stromal “bad neighborhood” characterized by high CAF abundance, while in other tumor contexts it shows a protective association that appears less dependent on stromal influence.
5. Conclusions
This pan-cancer study demonstrates that PAPPA is an independent prognostic biomarker whose biological and clinical effects vary across tumor types. In BLCA, CESC, LUSC, MESO, PAAD, and STAD, elevated PAPPA expression is associated with adverse outcomes and often coincides with high CAF infiltration, although CAF abundance itself is not consistently an independent risk factor. In contrast, in fibroblast-poor tumors such as LGG, higher PAPPA expression is linked to more favorable outcomes, whereas CAF infiltration is considered an adverse prognostic factor. Future studies integrating spatial, single-cell, and functional approaches are needed to clarify the cellular sources and regulatory mechanisms underlying PAPPA activity across tumor types.
6. Limitations
This study encompasses analyses that rely on publicly available databases and datasets; therefore, our findings require experimental wet-laboratory validation to establish their biological and functional significance.
The reference list from the paper itself. Each links out to its DOI / PubMed record.
- 1Lawrence J.B. Oxvig C. Overgaard M.T. Sottrup-Jensen L. Gleich G.J. Hays L.G. Yates J.R.3rd Conover C.A. The insulin-like growth factor (IGF)-dependent IGF binding protein-4 protease secreted by human fibroblasts is pregnancy-associated plasma protein-A Proc. Natl. Acad. Sci. USA 1999963149315310.1073/pnas.96.6.314910077652 PMC 15910 · doi ↗ · pubmed ↗
- 2Conover C.A. Oxvig C. The Pregnancy-Associated Plasma Protein-A (PAPP-A) Story Endocr. Rev.2023441012102810.1210/endrev/bnad 01737267421 · doi ↗ · pubmed ↗
- 3Li W. Li H. Zhou L. Wang Z. Hua B. Pregnancy-Associated Plasma Protein A Induces Inflammatory Cytokine Expression by Activating IGF-I/PI 3K/Akt Pathways Mediat. Inflamm.20192019843698510.1155/2019/8436985 PMC 675494031582904 · doi ↗ · pubmed ↗
- 4Oxvig C. The role of PAPP-A in the IGF system: Location, location, location J. Cell Commun. Signal.2015917718710.1007/s 12079-015-0259-925617049 PMC 4458251 · doi ↗ · pubmed ↗
- 5Conover C.A. Bale L.K. Overgaard M.T. Johnstone E.W. Laursen U.H. Füchtbauer E.M. Oxvig C. van Deursen J. Metalloproteinase pregnancy-associated plasma protein A is a critical growth regulatory factor during fetal development Development 20041311187119410.1242/dev.0099714973274 · doi ↗ · pubmed ↗
- 6Zhang J. Zhang Y. Li L. Nian Y. Chen Y. Shen R. Ma X. Pregnancy-associated plasma protein-A (PAPPA) promotes breast cancer progression Bioengineered 20221329130710.1080/21655979.2021.200072434974815 PMC 8805841 · doi ↗ · pubmed ↗
- 7Hjortebjerg R. Høgdall C. Hansen K.H. Høgdall E. Frystyk J. The IGF-PAPP-A-Stanniocalcin Axis in Serum and Ascites Associates with Prognosis in Patients with Ovarian Cancer Int. J. Mol. Sci.202425201410.3390/ijms 2504201438396692 PMC 10888379 · doi ↗ · pubmed ↗
- 8Pan H. Hanada S. Zhao J. Mao L. Ma M.Z. Protein secretion is required for pregnancy-associated plasma protein-A to promote lung cancer growth in vivo P Lo S ONE 20127 e 4879910.1371/journal.pone.004879923152806 PMC 3494721 · doi ↗ · pubmed ↗