Lipid Profiles and Fatty Acid Positional Distribution in Two Farmed Seahorse Species by Untargeted Lipidomics and Enzymatic Hydrolysis
Tianxi Bi, Dandan Wang, Xiaoming Jiang, Tingting Lin, Yi Shao, Yuming Wang, Taher Abdelnaby, Lu Zhang, Chengcheng Wang, Tiantian Zhang

TL;DR
This study compares the lipid profiles of two farmed seahorse species, revealing differences in fatty acid distribution that could aid in developing targeted nutritional supplements.
Contribution
The study provides the first comprehensive lipidomic comparison of farmed Hippocampus abdominalis and H. erectus using untargeted lipidomics and enzymatic hydrolysis.
Findings
Triglycerides were the dominant lipid class in both seahorse species.
H. abdominalis had higher phospholipid levels and more unsaturated fatty acids in its triglyceride fraction.
DHA was evenly distributed in H. abdominalis but concentrated at sn-1,3 in H. erectus.
Abstract
Seahorses, such as commercially farmed Hippocampus abdominalis and H. erectus, possess notable nutritional properties including antioxidant and anti-tumor activities. Lipids are key bioactive components distinguishing marine organisms from terrestrial counterparts, yet the lipidomic profiles of cultured seahorses remain poorly characterized, limiting their targeted nutritional application. Here, we employed untargeted lipidomics combined with enzymatic hydrolysis to comprehensively compare the lipid profiles of these two species. Triglycerides (TG) were the dominant lipid class in both seahorses. H. abdominalis exhibited higher total phospholipids, as well as more unsaturated fatty acids in its TG fraction. Docosahexaenoic acid (DHA) was evenly distributed across sn-positions in H. abdominalis but concentrated at sn-1,3 in H. erectus, while EPA was localized at sn-1,3 in both. These…
Genes, proteins, chemicals, diseases, species, mutations and cell lines named across the full text — each resolved to its canonical identifier and authoritative record.
Click any figure to enlarge with its caption.
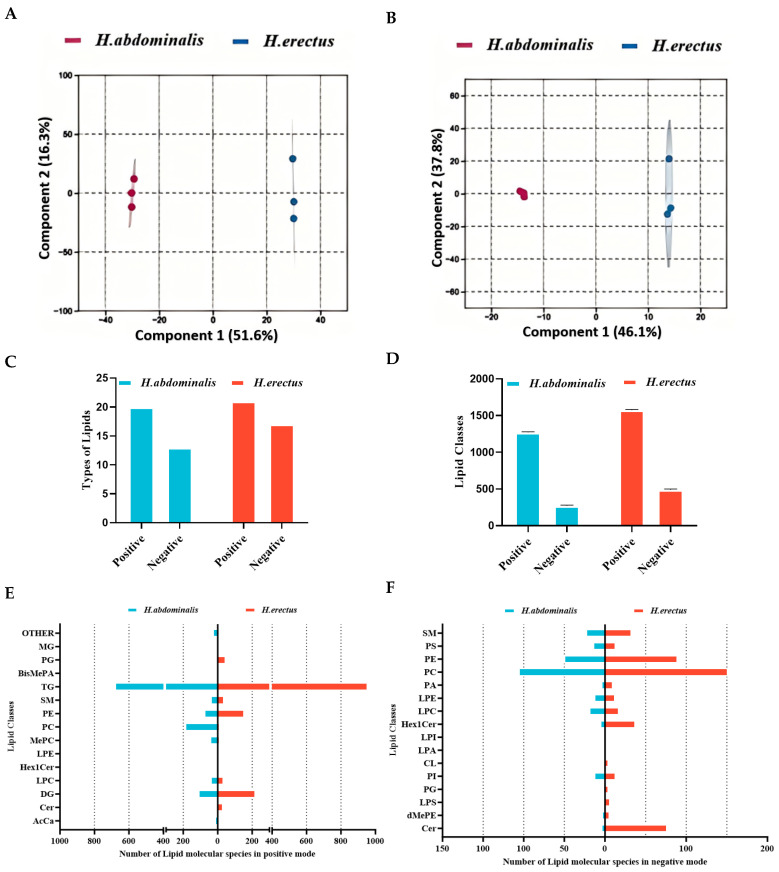 Figure 1
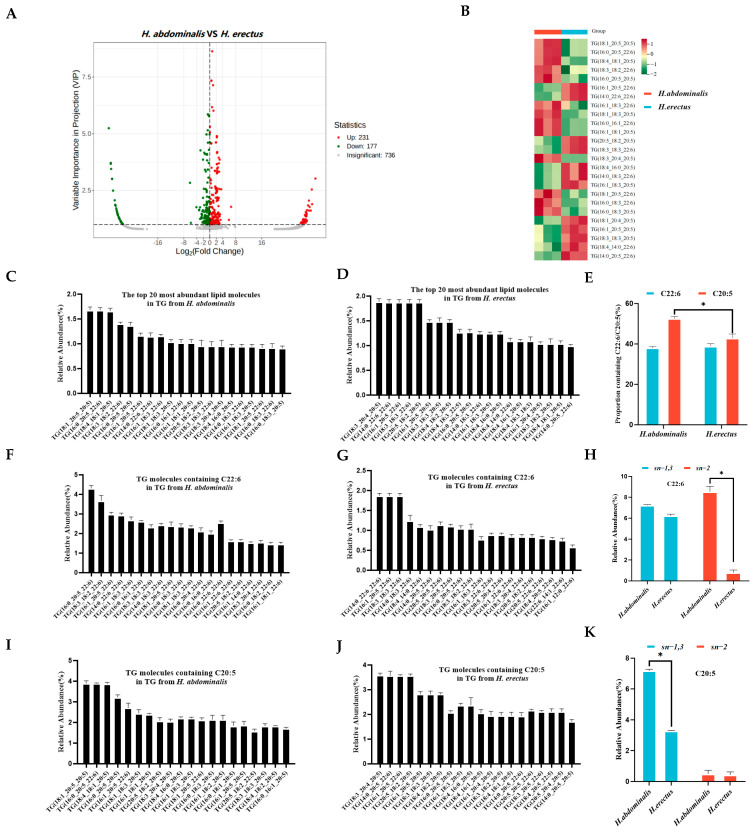 Figure 2
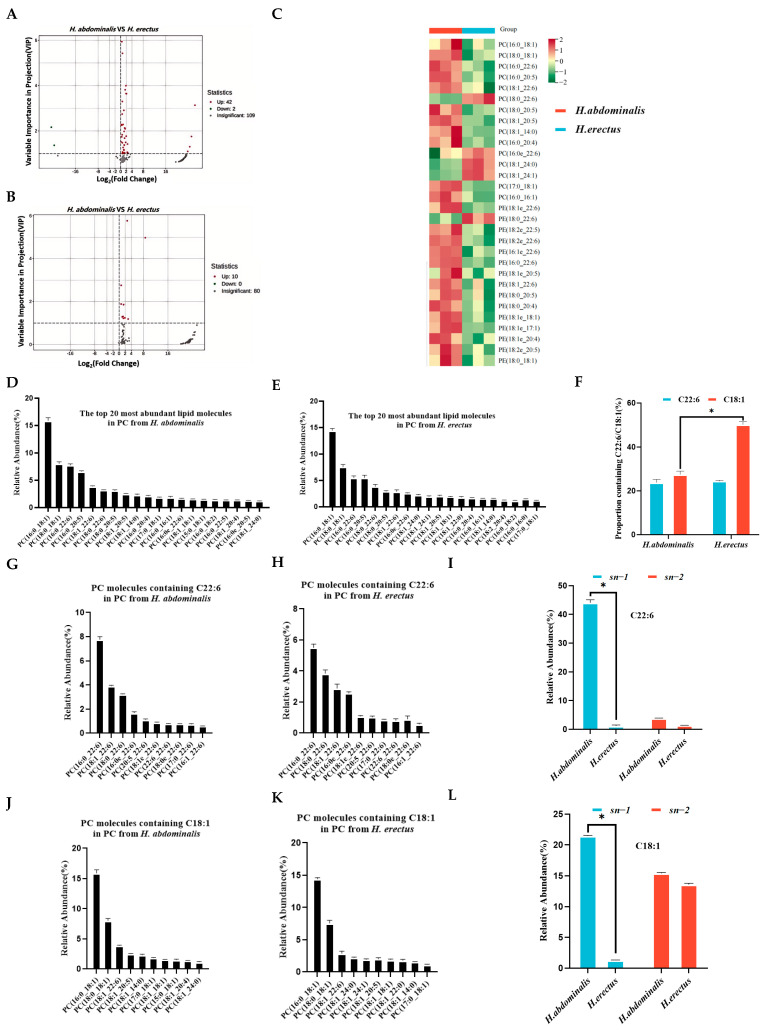 Figure 3
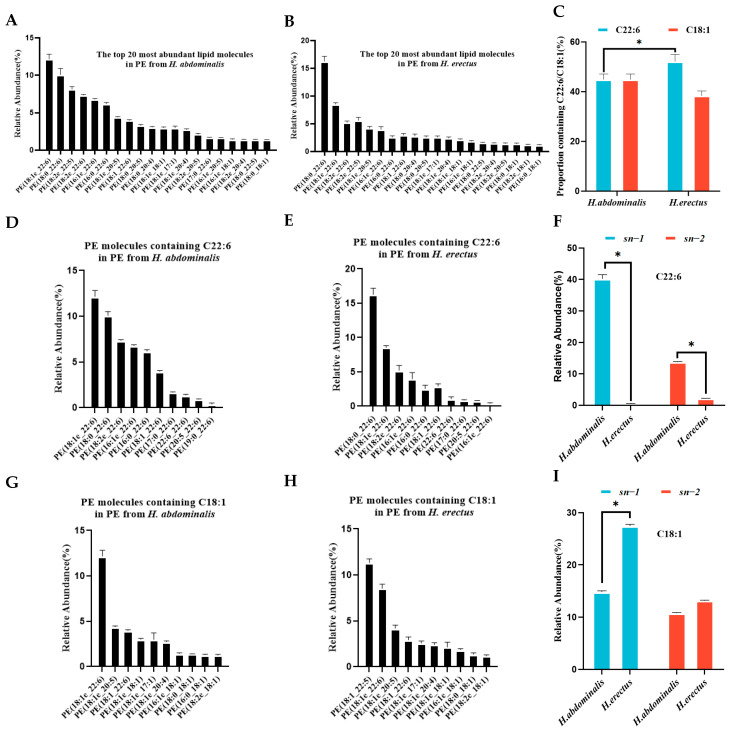 Figure 4
- —National Key Research and Development Program of China
- —the National Natural Science Foundation of China
- —the Taishan Scholars Program
- —Leading the Charge with Open Competition Project of the State Key Laboratory of Marine Food Processing and Safety Control
- —Youth Innovation Team Program of Universities in Shandong Province
Peer Reviews
No public reviews on file for this paper yet. If you reviewed it on a platform where reviews are public (OpenReview, ICLR, NeurIPS, ICML), you can paste yours below so the community can read it here.
Videos
No videos yet. Explain this paper in a talk, walkthrough, or lecture? Add one.
Taxonomy
TopicsAquatic life and conservation · Aquaculture Nutrition and Growth · Coconut Research and Applications
1. Introduction
Seahorses are rare marine bony fishes with substantial culinary and medicinal potential [1,2]. Currently, seahorses in major Asian regions are primarily traded as traditional medicinal materials, while a small fraction are marketed as ornamental marine fishes [3]. Accordingly, aquaculture has emerged as a crucial solution to meet the edible and medicinal demand for seahorses [4]. Notably, Hippocampus abdominalis and H. erectus have been commercially cultivated on a global scale [5,6].
Numerous studies have demonstrated that seahorses not only contain beneficial nutrients such as proteins and minerals [7,8] but also rich in unsaturated fatty acids [9,10], including omega-3 long-chain unsaturated fatty acids such as docosahexaenoic acid (DHA, 22:6n-3) and eicosapentaenoic acid (EPA, 20:5n-3) [11]. These compounds exhibit significant biological activities in combating cardiovascular and cerebrovascular diseases as well as neurodegenerative disorders [12]. To date, there have been literature reports on the lipid profiles of H. erectus [13], while no research in the literature has yet reported the lipid profiles of H. abdominalis being successfully cultivated on a large scale. Thus, the analysis of H. abdominalis lipid profiles and the comparison with those of other seahorse species have become an urgent issue to address.
Notably, current lipid analysis of seahorse has primarily focused on lipid profiling, with few studies investigating the fatty acid positional distribution of their major molecular species. Importantly, the positional structure of triglyceride (TG) and phospholipid (PL) can affect the in vivo absorption and metabolism of lipids, which in turn influences their biological activity and function [14,15]. Furthermore, the enzymatic method is the most effective and rapid approach for identifying the structure of common lipid molecules [16]. Thus, identifying the fatty acid positional distribution of major lipids in seahorses is also a key topic in seahorse lipid analysis.
In this study, an analytical strategy integrating untargeted lipidomics and immobilized enzyme hydrolysis was used to systematically characterize the lipid profiles and the fatty acid positional distribution of major lipid molecular species in two major cultured seahorse species, Hippocampus abdominalis and Hippocampus erectus. By examining interspecific differences in lipid content, composition, and structure, this research fills a vital knowledge gap on seahorse nutrition and enables a deeper understanding of their health functions and reliable lipid profiling.
2. Materials and Methods
2.1. Experimental Sample
Two seahorse species, H. abdominalis and H. erectus, were donated by Weihai Yinze Biotechnology Co., Ltd. (Weihai, China). This facility is licensed for large-scale artificial seahorse breeding and strictly complies with the Convention on International Trade in Endangered Species of Wild Fauna and Flora (CITES) and national aquatic wildlife protection laws. The seahorses used in our research are in full compliance with the basic principles specified for seahorses intended for scientific research purposes under CITES Appendix II. Rearing conditions for both species were strictly standardized and monitored, including dissolved gas concentrations, light intensity, water temperature, and tank hygiene. The juveniles were fed Artemia nauplii, while adults were given a diet of opossum shrimp. Upon maturity, 100 individuals of each species (1:1 male-to-female ratio, which is consistent with the roughly equal proportion of males to females in consumption, as well as the typical ratio observed under aquaculture conditions) were randomly sampled from separate same-batch culture tanks. Following guidelines approved by the Institutional Animal Care and Use Committee (IACUC), seahorses were humanely euthanized via overdose anesthesia with tricaine methanesulfonate (MS-222). Euthanized specimens were rinsed thoroughly with 0.22 μm-filtered seawater to remove surface mucus and exogenous impurities, then blotted dry. Each seahorse species was further assigned to three subgroups and subjected to frozen transportation at –20 °C to the laboratory. Subsequently, the samples were freeze-dried with a Scientz-18N freeze dryer (Ningbo Xinzhi Co., Ltd., Ningbo, China), ground into a fine powder, and processed for subsequent lipid extraction and analysis.
2.2. Reagents
Chloroform, methanol, hydrochloric acid, and sodium hydroxide used in this study were all of reagent grade and purchased from Sinopharm Chemical Reagent Co., Ltd. (Shanghai, China). n-Hexane, isopropanol, acetonitrile, and ammonium formate were of chromatographic grade and purchased from Sigma-Aldrich (St. Louis, MO, USA). Thin-layer chromatography (TLC) silica gel plates were provided by Yantai Huayang New Material Technology Co., Ltd. (Yantai, China), and the triglyceride (TG) assay kit (Cat. No.: A020-1-1) was purchased from Nanjing Jiancheng Bioengineering Institute (Nanjing, China).
2.3. Lipid Extraction and Purification
The extraction of total lipids from seahorses was performed with appropriate modifications based on the Folch method [17]. Briefly, a specified mass of dried H. abdominalis and H. erectus powder was mixed with 10 volumes (m/v) of extraction solvent (chloroform: methanol = 2:1, v/v), respectively. Butylated hydroxyanisole (BHA) was added to the chloroform–methanol extraction solution at a concentration of 100 μg/mL to prevent lipid oxidation. After multiple processing steps, the lower organic phase was collected and concentrated under reduced pressure to remove organic solvents, yielding total seahorse lipids. Subsequently, column chromatography was performed to isolate the triglyceride (TG), phosphatidylcholine (PC), and phosphatidylethanolamine (PE) fractions. Specifically, 10 g of total lipids were loaded onto a silica gel column (packed with 60 g of silica gel; internal diameter = 2 cm). Pure dichloromethane was initially adopted as the eluent, and triglycerides eluted at the third column volume (CV). After the complete collection of all neutral lipid fractions, phospholipid components were eluted using a dichloromethane/methanol mixture (5:1, v/v), from which phosphatidylethanolamine (PE) and phosphatidylcholine (PC) were sequentially isolated.
The eluted fractions were subsequently identified and their purities were initially evaluated via thin-layer chromatography (TLC). The analysis was performed on silica gel G plates with dimensions of 10 × 5 cm, a sorbent particle size of 5–20 μm, and a stationary phase layer thickness of 0.23 mm. Approximately 100 μg of the lipid sample was applied. For neutral lipids (TG), the mobile phase consisted of petroleum ether/diethyl ether/acetic acid (85:15:1, v/v/v). For polar lipids (PC and PE), the mobile phase was chloroform/methanol/water (65:25:4, v/v/v). Lipid-containing bands were visualized utilizing the iodine vapor method, and their identities were confirmed by comparing them with commercial standards, exhibiting Rf values of 0.87 for TG, 0.56 for PC, and 0.84 for PE.
Subsequently, the purity of the collected lipid fractions (PC, PE, and TG) was strictly quantified using a Waters HPLC system coupled with a Waters 2424 Evaporative Light Scattering Detector (ELSD) (Waters Corporation, Milford, MA, USA). Separation was achieved on a YMC-Did-120 silica-bonded diol column (250 × 4.6 mm, 5 μm sorbent particle size) maintained at 55 °C. The mobile phase system consisted of phase A (n-hexane/isopropanol/acetic acid/triethylamine = 81.42:17:1.5:0.08, v/v/v/v) and phase B (isopropanol/water/acetic acid/triethylamine = 84.42:14:1.5:0.08, v/v/v/v) at a flow rate of 1.0 mL/min. A gradient elution program was applied as follows: 0 min, 95% A; 5 min, 80% A; 7 min, 60% A; 17 min, 30% A; 23 min, 0% A; 25.5 min, 95% A; and 30 min, 95% A. The ELSD conditions were optimized with a detector sensitivity gain value of 50, a drift tube temperature of 50 °C, and a nebulizer gas pressure of 25 psi, operating in heating mode (power level 60%). For each analysis, an injection volume of 20.0 μL of the lipid fraction at a concentration of 1.0 mg/mL was introduced into the system.
The purities of all the aforementioned substances, as determined by ELSD peak area normalization, were confirmed to be above 90%. These highly pure samples were then frozen and stored at −20 °C for subsequent analysis.
2.4. Analysis of Fatty Acid Compositions
TG were quantified using a commercial assay kit (Cat. No. A020-1-1, Nanjing Jiancheng Bioengineering Institute). Phospholipids (PL) were determined via the molybdenum blue colorimetric method [18]. Briefly, sample solutions were prepared with chloroform–methanol (2:1, v/v) as the solvent, followed by digestion with perchloric acid. The inorganic phosphorus content in the samples was then measured, and phospholipid content was calculated by multiplying the measured inorganic phosphorus content by a conversion factor of 25.
The total lipids, as well as the samples separated by silica gel column chromatography, were individually placed into methylation reagents (hydrochloric acid: methanol = 1:5, v/v), homogenized, and reacted in a metal bath at 90 °C for 3 h, with homogenization performed every 30 min during the reaction. After cooling, n-hexane was added for extraction. Once the mixture was allowed to stand and separate into layers, 1 mL of the supernatant was collected and dried by nitrogen blowing. The dried sample was then re-dissolved in 50 μL of n-hexane and used for subsequent gas chromatography analysis [19].
The GC system was set as follows: An Agilent 7820A Gas Chromatograph (Agilent Technologies, Santa Clara, CA, USA) with a capillary column (AE. FFAP; 30 m × 0.32 mm × 0.25 μm film thickness); The gas chromatography detector employed was a Flame Ionization Detector (FID). The detector and injector temperatures were maintained at 250 °C and 240 °C, respectively. The column temperature program was programmed as follows: initial temperature of 170 °C, ramped up to 240 °C at a rate of 3 °C/min, and then held isothermally at 240 °C for 35 min. High-purity nitrogen was used as the carrier gas, with a constant flow rate of 1.0 mL/min. The total runtime for a single sample analysis was 48.5 min [20].
2.5. Ultra-High-Performance Liquid Chromatography-Tandem Mass Spectrometry (UPLC-MS) Analysis
For lipid profile analysis, a high-resolution orbitrap mass spectrometer (UPLC-Q-Orbitrap) coupled with an ACQUITY UPLC BEH C18 column (2.1 mm × 100 mm, 1.7 μm) was used. The system included a UPLC module from Waters Corporation (Milford, MA, USA) and an electrospray ionization (ESI) source from Thermo Fisher Scientific (Waltham, MA, USA). Mobile phase A consisted of acetonitrile/water (60:40, v/v) containing 10 mmol/L ammonium formate, and mobile phase B was isopropanol/acetonitrile (90:10, v/v). The gradient elution program was as follows: initial conditions (100% A); linear increase to 32% B over 1.5 min; further increase to 85% B by 15.5 min; rapid ramp to 97% B within 0.1 min, held for 2.4 min; then decreased to 32% B within 0.1 min, held for 1.9 min. Curtain Gas (Cur) was set to 35 psi; the flow rates of both Gas 1 (GS1) and Gas 2 (GS2) were configured to 55 psi; Ion Source Voltage/Float (ISVF) was adjusted to 5500/−4500 V; Ion Source Temperature (TEM) was maintained at 350 °C; Declustering Potential (DP) was set to 80 V; Entrance Potential (EP) was set to 10 V; and Collision Cell Exit Potential (CXP) was set to 15 V. Quantitative analysis of total ion current (TIC) chromatograms was performed using Lipid Search Launcher 4.2.21 software (Thermo Fisher Scientific) [21].
2.6. Determination of Fatty Acid Positional Distribution
To determine the positional distribution of fatty acids in TG, PC, and PE, 2 mg of the lipid sample and 1 mg of immobilized Novozym 435 lipase were placed into each centrifuge tube separately. The reaction was carried out in 40 mL of 95% ethanol [22]. After 12 h, the immobilized enzymes were removed from the enzymatic hydrolysates via centrifugation, and the enzyme-free mixture was heated at 95 °C for 1 min under a nitrogen atmosphere and immediately quenched in an ice bath. The mixture was then dried and concentrated in a nitrogen environment prior to high-performance thin-layer TLC separation.
The TG enzymatic hydrolysates were separated using a solvent system of petroleum ether, diethyl ether, and acetic acid at a volume ratio of 85:15:1 (v/v/v), from which the produced monoacylglycerols (MG, Rf = 0.25) and the unreacted initial TG (Rf = 0.87) were obtained. The PC and PE enzymatic hydrolysates were treated with a solvent system of chloroform, methanol, and water at a volume ratio of 65:25:4 (v/v/v), obtaining unreacted PC (Rf = 0.56) and PE (Rf = 0.84), along with their respective products, LPC (Rf = 0.27) and LPE (Rf = 0.33). Finally, the target bands were scraped off and subjected to fatty acid composition analysis.
2.7. Statistical Analysis
Triplicate experiments were conducted for both the quantitative analysis of lipid molecules and the determination of lipid class composition, while triplicate measurements were performed for fatty acid component analysis. All data in the figures are expressed as the mean ± standard error of the mean (SEM). Statistical analysis was performed using one-way analysis of variance (ANOVA), followed by Tukey’s post hoc test to identify significant differences between groups. Differences were considered statistically significant at p < 0.05 and marked with different letters. Orthogonal Partial Least Squares-Discriminant Analysis (OPLS-DA), heatmap analysis, and volcano plot generation were carried out using the free online data analysis platform Metware Cloud (https://cloud.metware.cn).
3. Results
3.1. Lipid Content and Lipid Class Composition
As shown in Supplementary Figure S1, the lipid extraction yield of H. abdominalis (76.4 mg/g dry weight) was higher than that of H. erectus (69.1 mg/g dry weight), indicating that H. abdominalis exhibited a higher lipid content. The fatty acid content of the total lipids of Hippocampus abdominalis and Hippocampus erectus were analyzed using gas chromatography (GC) through comparison with the mixed standard chromatogram (Figure S2), with the results summarized in Table 1. For H. abdominalis, 16 fatty acids with carbon chain lengths ranging from C14 to C22 were identified, with major components including C16:0, C16:1, C18:0, C18:1, C20:5n-3 (EPA), and C22:6n-3 (DHA). Saturated fatty acids (SFA) accounted for 38.9% of its total lipids (predominantly C16:0 at 23.1%, C18:0 at 9.6%, and C14:0 at 3.6%), while 10 unsaturated fatty acid (UFA) species contributed 61.1% (monounsaturated fatty acids (MUFA) at 29.9%, mainly C18:1 at 20.8% and C16:1 at 7.4%; polyunsaturated fatty acids (PUFA) at 31.3%, dominated by DHA at 14.37% and EPA at 8.3%. For H. erectus, the major fatty acids were C16:0 (27.4%), C18:1 (15.6%), C18:0 (11.0%), C16:1 (8.5%), and C14:0 (7.6%), with SFA, MUFA, and PUFA accounting for 50.4%, 24.1%, and 25.6% of total lipids, respectively. The UFA content of H. abdominalis (59.4%) was higher than that of H. erectus (49.6%), and the total DHA + EPA content of both species was higher than that of H. kelloggi.
3.2. Differences in TG Molecular Species Between Two Seahorse Species and Fatty Acid Positional Distribution in TG
According to Figure S3, TG was the major component of seahorse lipids, with H. erectus (26.7%) having a slightly lower TG content than H. abdominalis (29.5%). Phospholipids (PL) accounted for 9.2–12.3% of total lipids, with H. abdominalis showing a higher PL content than H. erectus. Then the lipid components of the two seahorse species were analyzed by means of lipidomics. Preliminary findings indicated that there were differences between them through comparison with the Total Ion Chromatogram (TIC) profiles under the two modes (Figures S4 and S5). OPLS-DA results (Figure 1A,B) revealed significant differences in lipid molecular characteristics between the two species. In positive ion mode, the number of lipid types was comparable between them, but H. erectus had more lipid types in negative ion mode. Regarding lipid class composition (Figure 1D–F), H. erectus exhibited a significantly higher diversity of lipid classes across both ion modes. Upon data integration, TG emerged as the predominant lipid class. Notably, several specific lipid classes, including LPA, LPI, CL, and BisMePA, were entirely absent in H. abdominalis.
A total of 408 significantly different TG lipid species were identified between the two species (Figure 2A), with 231 upregulated and 177 downregulated in H. abdominalis relative to H. erectus. Differential TG species screened by |log_2_ fold change| > 1 and VIP score > 1 were visualized via volcano plots (Figure 2B), and 25 of the top 20 most abundant TG species in each seahorse showed significant interspecific differences. H. abdominalis had 683 detected TG molecular species, while H. erectus had 958 (Figure 1E). The most abundant TG species in both seahorses almost all contained C20:5 or C22:6 (Figure 2C,D). The proportion of C22:6-containing lipid species was approximately 38% in both, while higher levels of C22:6-containing lipids (e.g., TG(C16:0/C20:5/C20:6) at 4.3%) and slightly higher levels of C20:5-containing lipids (e.g., TG(C18:1/C20:5/C20:5) at 3.9%) than H. erectus. The proportion of C20:5-containing species was significantly higher in H. abdominalis (52.6%) than in H. erectus (42.9%) (Figure 2E). Furthermore, H. abdominalis contained a substantial amount of the lipid TG(C14:0/C22:6/C22:6) at 1.9%, and its dominant C20:5-containing lipid was TG(C18:3/C20:4/C20:5) at 3.6% (Figure 2F,G,I,J). Enzymatic hydrolysis results (Table S1, Figure 2H,K) showed that in H. abdominalis, C22:6 was distributed at both sn-1,3 (7.2%) and sn-2 (8.5%) positions of TG, while in H. erectus, C22:6 was predominantly at sn-1,3 positions (6.2%). C20:5 was concentrated at sn-1,3 positions in both, with a higher content in H. abdominalis (7.2%) than in H. erectus (3.3%).
3.3. Differences in PL Molecular Species Between Two Seahorse Species
For PL components, 44 differential PC species were identified between the two seahorses (Figure 3A), with 42 upregulated and 2 downregulated in H. abdominalis. Ten differential PE species were detected (Figure 3B), all upregulated in H. abdominalis. Volcano plots visualized these differential species (Figure 3C). Among the top 10 most abundant PC and PE species in each seahorse, 15 PC and 15 PE species showed significant interspecific differences, with most being more abundant in H. abdominalis. H. abdominalis had 51 PE molecular species, compared to 90 in H. erectus (Figure 1F).
3.4. Molecular Species and Positional Distribution of Fatty Acids in PC
The most abundant PC species in both seahorses almost all contained C22:6 or C18:1 (Figure 3D,E). The proportion of C22:6-containing PC species was slightly lower in H. abdominalis (23.8%) than in H. erectus (24.5%), while the proportion of C18:1-containing PC species was significantly lower in H. abdominalis (27.5%) than in H. erectus (50.2%) (Figure 3F). H. abdominalis had higher levels of C22:6-containing PC species (e.g., PC(C16:0/C22:6) at 7.8%) and slightly higher levels of C18:1-containing PC species than H. erectus (PC(C16:0/C22:6) at 5.5%) (Figure 3G,H,J,K). The most abundant PC species in both was PC(C16:0/C18:1), with relative contents of 15.9% (H. abdominalis) and 14.4% (H. erectus). Enzymatic hydrolysis results (Table S2, Figure 3I,L) showed that PC in H. abdominalis had high DHA content (44.0% at sn-1 position), while DHA content in H. erectus was approximately 1% at both sn-1 and sn-2 positions. C18:1 in H. abdominalis was primarily at sn-1 (21.4%), while in H. erectus, C18:1 content at sn-1 (15.1%) and sn-2 (13.6%) were similar.
3.5. Molecular Species and Positional Distribution of Fatty Acids in PE
The most abundant PE species in both seahorses almost all contained C22:6 or C18:1 (Figure 4A,B). The proportion of C22:6-containing PE species was lower in H. abdominalis (44.9%) than in H. erectus (52.2%), while the proportion of C18:1-containing PE species was higher in H. abdominalis (44.9%) than in H. erectus (38.4%) (Figure 4C). H. abdominalis had a significantly higher abundance of alkoxy ether phospholipid PE, such as PE(C18:1e/C22:6) (12.2%), PE(C18:2e/C22:6) (7.4%), and PE(C18:1e/C20:5) (4.4%) (Figure 4D,E,G,H). Enzymatic hydrolysis results (Table S3, Figure 4F,I) showed that PE in H. abdominalis had high DHA content (40.2% at sn-1, 13.72% at sn-2), while DHA content in H. erectus was below 2.5% at sn-2. C18:1 in H. abdominalis was relatively evenly distributed between sn-1 (14.8%) and sn-2 (10.8%), while in H. erectus, C18:1 content was higher at sn-1 (27.4%) than at sn-2 (13.2%).
4. Discussion
The present study systematically characterized the lipid composition, molecular species, and fatty acid positional distribution of two seahorse species (H. abdominalis and H. erectus), revealing significant interspecific differences. Given that these species are now globally cultured under similar controlled conditions, these variations are not driven by their immediate environment, but rather can be attributed to species-specific metabolic characteristics [23,24,25]. These inherent differences highlight the superior nutritional value and functional potential of H. abdominalis compared to H. erectus. In terms of lipid class composition, both seahorse species showed TG as the predominant lipid class, which is consistent with the lipid profile of many deep-sea fish [26]. Notably, the two seahorse species were relatively abundant in the diversity of their DG molecular species, a phenomenon that might be associated with the hydrolysis of TG catalyzed by TG lipase within the organisms during transportation and storage. Furthermore, The higher UFA content (especially DHA and EPA) in H. abdominalis (61.1%) compared to H. erectus (49.6%) is a key finding, as PUFAs like DHA and EPA are well-documented for their beneficial effects on human health, including lowering blood lipids and alleviating atherosclerosis [27]. The total DHA + EPA content of both seahorses was higher than that of H. kelloggi [9], further confirming seahorses as a valuable source of these essential fatty acids.
The OPLS-DA results demonstrated distinct lipid molecular characteristics between the two species, with H. erectus possessing more lipid types, particularly in negative ion mode. This difference may be related to the ionization properties of lipids: triglycerides are effectively ionized in positive ion mode, while phospholipids (with negatively charged phosphate groups) form stable [M-H]^−^ or [M+HCOO]^−^ ions in ESI negative mode, facilitating their detection [28,29]. The higher relative proportion of PC in H. abdominalis (9.9% vs. 9.0% in H. erectus) is noteworthy, as PC is a critical component of cell membrane and plays important roles in lipid metabolism. The analysis of TG molecular species revealed 408 differential species between the two seahorses, with H. abdominalis showing higher levels of DHA- and EPA-containing lipids. The enrichment of DHA and EPA in the major TG species of both seahorses, even at moderate overall proportions in total lipids, indicates targeted accumulation of these PUFAs, which is consistent with findings in some marine fish species [30]. Furthermore, we focus primarily on the differences in fatty acids at the sn-1,3 and sn-2 positions of TG. The rationale behind this focus is that triglycerides in the digestive tract are preferentially hydrolyzed by pancreatic lipase into sn-2 monoacylglycerol prior to absorption. The experimental results demonstrated that the positional distribution of fatty acids in TG further amplifies the nutritional superiority of H. abdominalis in that DHA is enriched at the sn-2 position (8.5%), a position with higher fatty acid absorption efficiency while the EPA content at the sn-1,3 positions is significantly higher than that in H. erectus. This distinct positional distribution pattern facilitates the more efficient exertion of DHA and EPA’s nutritional benefits [31].
For phospholipids, H. abdominalis showed upregulation of most differential PC and PE species, despite having fewer total PE molecular species than H. erectus. The high abundance of alkoxy ether phospholipid PE in H. abdominalis (e.g., PE(C18:1e/C22:6)) is particularly significant, as these lipids possess superior oxidation resistance and are associated with multiple nutritional function [32,33]. The positional distribution of fatty acids in PC and PE also contributes to the higher lipid absorption efficiency of H. abdominalis in that DHA is highly concentrated at the sn-1 position of PC (44.0%) and PE (40.2%), while the even distribution of C18:1 in PE may further optimize lipid metabolism [34].
Collectively, these results indicate that H. abdominalis may possess superior nutritional value to H. erectus from the aspect of lipid and thus holds greater potential for the development of lipid-derived functional ingredients and precision nutrition products [35]. The distinct lipid profiles of the two seahorse species furnish a scientific foundation for their targeted application in the food and pharmaceutical industries. Given that the present study is constrained by the lack of quantitative analysis of lipid molecular species, future research could focus on conducting in-depth quantitative investigations to clarify the precise lipid composition of the two seahorse species, as well as evaluating the in vitro and in vivo biological activities of these target lipids.
5. Conclusions
This study clarified the lipid differences between two farmed seahorse species, H. abdominalis and H. erectus, by comparing their lipid content, composition, molecular species, and fatty acid positional distribution and using untargeted lipidomics combined with enzymatic hydrolysis. Of these lipids, triglyceride (TG) was the major lipid class in both species. Interestingly, H. abdominalis had higher levels of phospholipids (PL) than H. erectus. Specifically, the content of docosahexaenoic acid (DHA) and eicosapentaenoic acid (EPA) in the TG of H. abdominalis was higher than that in H. erectus. Moreover, DHA in H. abdominalis was evenly distributed at the sn-1,3, and sn-2 positions, while in H. erectus, DHA was mainly distributed at the sn-1,3 positions. In contrast, EPA was concentrated at the sn-1,3 positions in both seahorse species. Additionally, the DHA content in phosphatidylcholine (PC) and phosphatidylethanolamine (PE) of H. abdominalis was much higher than that in H. erectus, and this DHA was mainly concentrated at the sn-1 position. Notably, H. abdominalis also contained a large amount of alkoxy ether phospholipids. This study addresses the existing research gaps in the lipid profiles of two commercially viable large-scale cultured seahorse species. Specifically, it characterizes the interspecific differences in lipid molecular species, as well as the difference in fatty acids at distinct positions of the major molecular species (i.e., TG, PC, and PE). These findings provide a fundamental basis for the species identification and development of functional lipids derived from seahorses.
The reference list from the paper itself. Each links out to its DOI / PubMed record.
- 1Kumaravel K. Ravichandran S. Balasubramanian T. Sonneschein L. Seahorses—A source of traditional medicine Nat. Prod. Res.2012262330233410.1080/14786419.2012.66265022360853 · doi ↗ · pubmed ↗
- 2Camins E. Stanton L.M. Correia M. Foster S.J. Koldewey H.J. Vincent A.C.J. Advances in life-history knowledge for 35 seahorse species from community science J. Fish Biol.20241041548156510.1111/jfb.1569938408838 · doi ↗ · pubmed ↗
- 3Loh T.L. Tewfik A. Aylesworth L. Phoonsawat R. Species in wildlife trade: Socio-economic factors influence seahorse relative abundance in Thailand Biol. Conserv.201620130130810.1016/j.biocon.2016.07.022 · doi ↗
- 4Dias T.L. Rosa I.L. Baum J.K. Threatened fishes of the world: Hippocampus erectus perry, 1810 (Syngnathidae)Environ. Biol. Fishes 20026532610.1023/A:1020539222587 · doi ↗
- 5Kodagoda Y.K. Liyanage D.S. Omeka W.K.M. Kwon H. Hwang S.D. Lee J. Molecular characterization, expression, and functional analysis of cystatin B in the big-belly seahorse (Hippocampus abdominalis)Fish Shellfish. Immunol.202212444245310.1016/j.fsi.2022.04.02035460877 · doi ↗ · pubmed ↗
- 6Zhang Y.Y. Ryu B.M. Qian Z.J. A Review—Biology, Aquaculture and medical use of seahorse, Hippocampus spp.Annu. Res. Rev. Biol.201714112
- 7Ko J. Wan Q. Bathige S.D.N.K. Lee J. Molecular characterization, transcriptional profiling, and antibacterial potential of G-type lysozyme from seahorse (Hippocampus abdominalis)Fish Shellfish Immunol.20165862263010.1016/j.fsi.2016.10.01427732899 · doi ↗ · pubmed ↗
- 8Cui X.H. Zhao X.F. Li J.T. Li Z.W. Ren X. Zhao Y.G. Fu X.J. Li X.X. Advances in the global distribution, chemical constituents, and pharmacology of Hippocampus, a traditional marine Chinese medicine Front. Mar. Sci.2021877492710.3389/fmars.2021.774927 · doi ↗