Proof of Concept for Tumor Mutational Burden Prediction Through Biophysical Analysis Based on UHF-Dielectrophoresis
Héloïse Daverat, Nina Blasco, Sandrine Robert, Amandine Rovini, Claire Dalmay, Fabrice Lalloué, Arnaud Pothier, Karine Durand, Thomas Naves

TL;DR
This paper explores using electromagnetic sensing to predict tumor mutational burden, a key biomarker for cancer immunotherapy, as a faster and cheaper alternative to sequencing.
Contribution
The study introduces UHF-dielectrophoresis as a novel biophysical method for assessing tumor mutational burden.
Findings
EMS measurements showed an upward shift correlated with higher tumor mutational burden in cancer cell lines.
ENU-induced mutagenesis was reliably detected through changes in electromagnetic signatures.
The method can detect both intrinsic and experimentally induced mutational load differences.
Abstract
Tumor Mutational Burden (TMB) is a critical biomarker used to determine patient eligibility for immunotherapy with immune checkpoint inhibitors. However, its gold-standard assessment via whole exome sequencing is limited by high costs, technical complexity, and lengthy processing times. To address these challenges, we investigated whether Ultra-High-Frequency (UHF) electromagnetic wave sensing could serve as an alternative method for evaluating TMB. We analyzed the dielectrophoresis crossover frequency spectrum and corresponding electromagnetic signature (EMS) of cancer cells using a lab-on-a-chip biosensor that integrates microfluidics with dielectrophoresis-based electro-manipulation. Across seven solid tumor cell lines exhibiting diverse TMB levels, EMS exhibited an upward shift correlated with higher TMB, suggesting a relationship between mutational load and electromagnetic…
Genes, proteins, chemicals, diseases, species, mutations and cell lines named across the full text — each resolved to its canonical identifier and authoritative record.
Click any figure to enlarge with its caption.
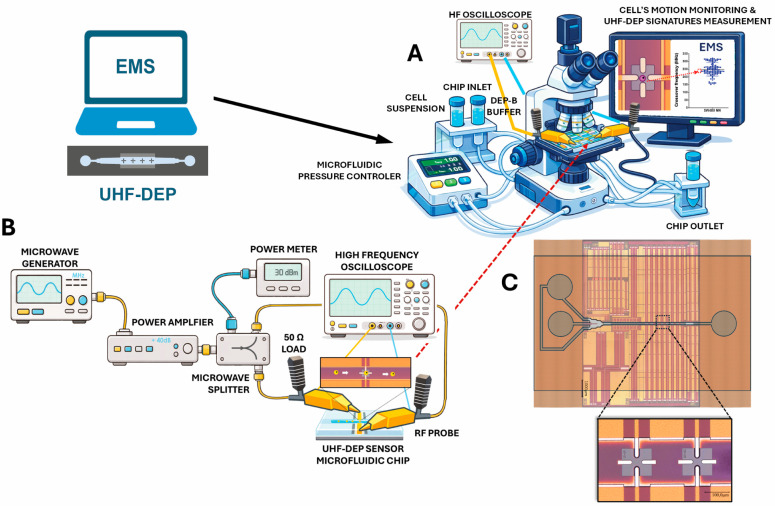 Figure 1
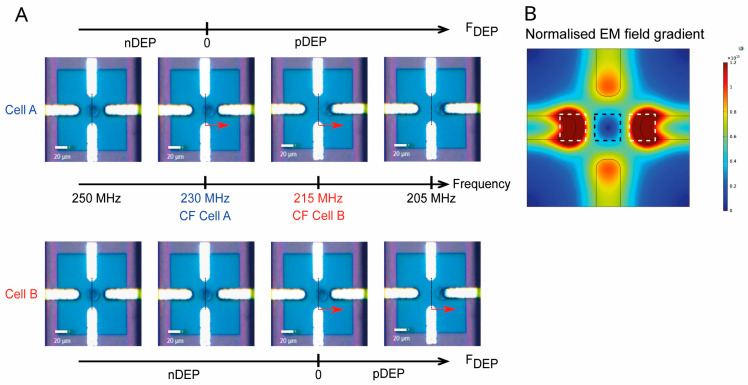 Figure 2
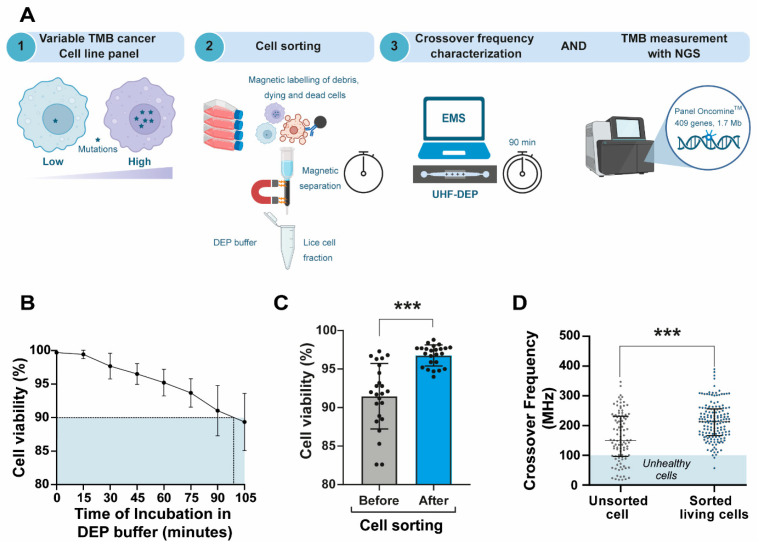 Figure 3
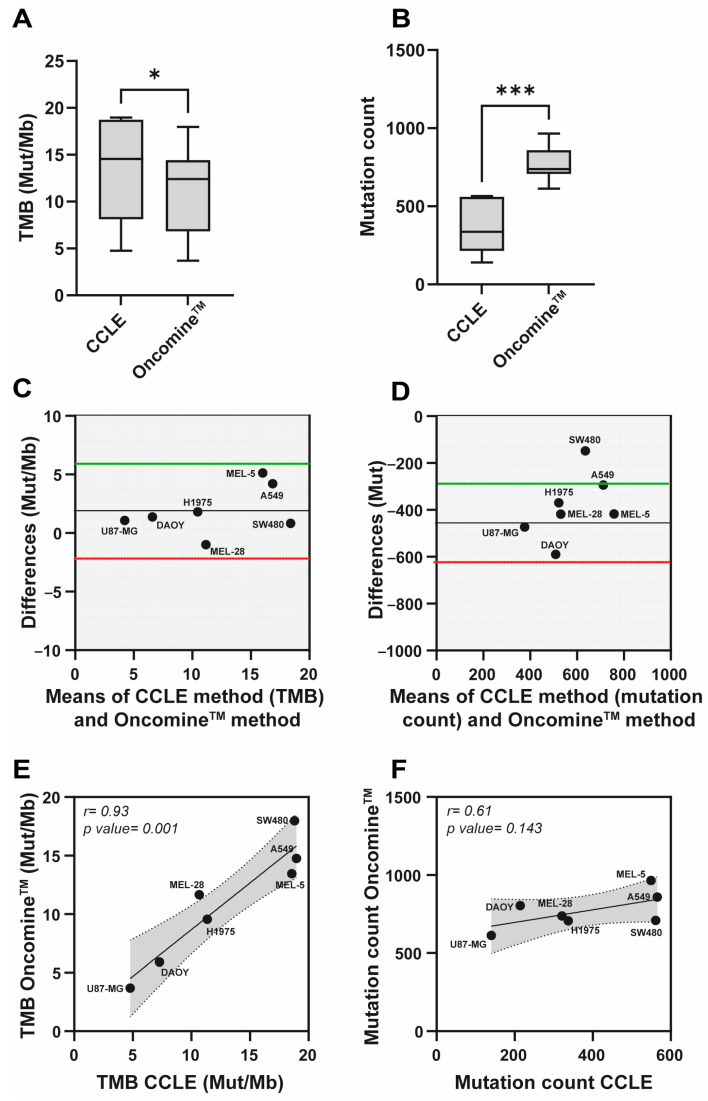 Figure 4
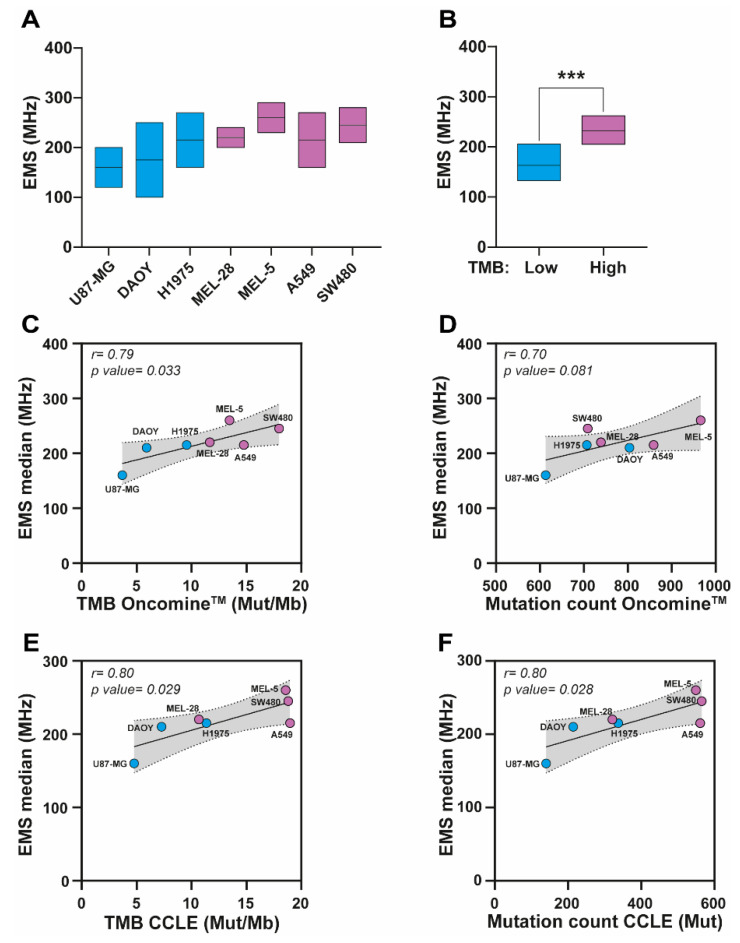 Figure 5
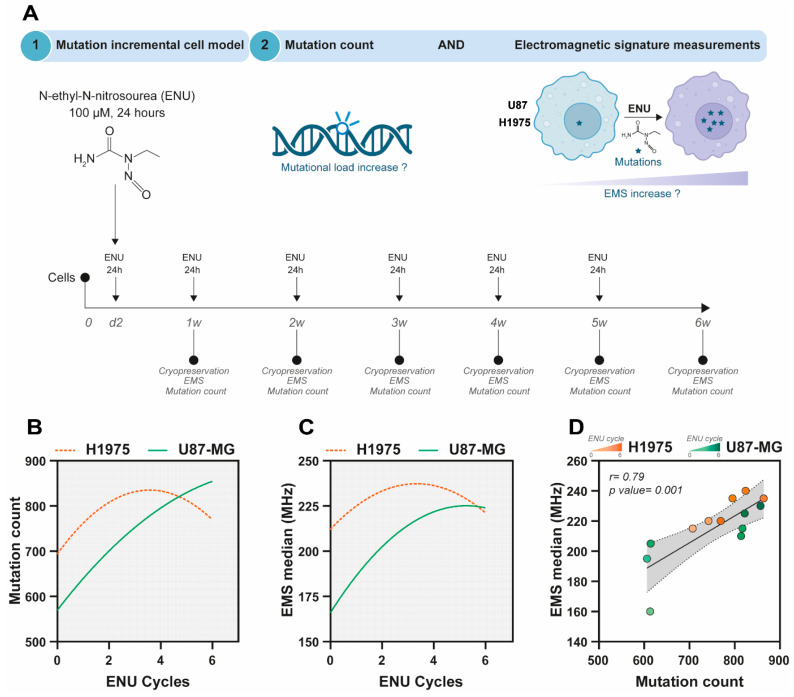 Figure 6
- —Ligue Contre le Cancer, Comité d’Orientation sur le Cancer, CHU Dupuytren, Limoges
- —Région Nouvelle Aquitaine
- —Platinom platform
- —European Regional Development Fund (ERDF)
- —Ministry of Higher Education and Research and the Nouvelle Aquitaine council
- —European Union
Peer Reviews
No public reviews on file for this paper yet. If you reviewed it on a platform where reviews are public (OpenReview, ICLR, NeurIPS, ICML), you can paste yours below so the community can read it here.
Videos
No videos yet. Explain this paper in a talk, walkthrough, or lecture? Add one.
Taxonomy
TopicsMicrofluidic and Bio-sensing Technologies · Microbial Inactivation Methods · Cancer Cells and Metastasis
1. Introduction
Over the past two decades, immune checkpoint inhibitors (ICI), such as anti-PD-1 (Programmed cell Death protein 1), anti-PD-L1 (Programmed Death-Ligand 1), and anti-CTLA4 (cytotoxic T-lymphocyte-associated protein 4) agents, have transformed the therapeutic landscape of cancer by providing durable responses and improved tolerability [1,2,3,4]. These therapies have become central to the treatment of certain cancers, especially for patients whose tumors exhibit high PD-L1 expression [5,6]. However, although PD-L1 is a relevant biomarker for predicting ICI response, patients with low PD-L1 expression may also respond favorably to these therapies [7,8,9,10]. Notably, the FDA-approved (Food and Drug Administration) monoclonal antibody pembrolizumab (Keytruda^®^), which targets PD-1, has demonstrated efficacy in patients with low PD-L1 expression [11]. Conversely, up to 15–40% of patients may fail to respond to immunotherapy despite high PD-L1 expression [12]. While multiple mechanisms may contribute to this immunotolerance [13], they remain largely unexplained. This variability in response underscores the urgent need for more accurate, robust, and comprehensive biomarkers to better guide ICI-based treatment decisions [14]. Consequently, other parameters must be considered, such as tumor mutational burden (TMB), which is a better predictor of response to immunotherapy than checkpoint inhibitor expression alone.
Indeed, TMB has garnered significant interest in recent years, with an exponential increase in data and publications in the literature. Specifically, TMB has emerged as a critical biomarker for predicting response to immunotherapy [15,16,17,18]. TMB quantifies the total number of non-synonymous somatic mutations and additional coding variants per megabase within the coding regions of a tumor genome. Tumors with high TMB, defined as ≥10 mutations per megabase (Mut/Mb), are more likely to respond to immunotherapy [19,20,21,22]. It is important to note that individual mutations vary in their functional impact, with some mutations more likely to alter cellular behavior, signaling pathways, and therapeutic response. Because mutations generate neoantigens or tumor-specific antigens recognized by the immune system as foreign, an anti-tumor response is triggered when ICI release the natural brakes on the immune system [17,23]. Therefore, an accurate assessment of TMB can aid in selecting patients most likely to benefit from ICI. However, despite its potential, TMB measurement using the current gold standard, whole exome sequencing (WES), is often costly, resource-intensive, and time-consuming for routine clinical application [24]. This limitation restricts its integration into standard oncological workflows, particularly in resource-constrained settings. To address this, a novel technology based on Dielectrophoresis (DEP) could provide a rapid method for identifying mutation rates.
DEP is a label-free electrokinetic technique that uses electric fields to manipulate and sort particles based on their intrinsic dielectric properties. DEP can also be employed to characterize specific physical specificities of biological cells. Biologically, cells behave as polarizable dielectric entities. Variations in their electrical permittivity and conductivity across different frequencies reflect their unique cellular characteristics, summarized as distinctive bioelectric signatures [25]. Depending on the frequency range of the electric field interacting with the cell, these signatures highlight different cellular components. At low frequencies (<10 kHz), they primarily represent the properties of the cell membrane, whereas at higher frequencies (100 kHz–500 MHz), they provide information about internal structures such as the nucleus, organelles, and cytoplasmic contents [26,27]. Operating in the ultra-high frequency (UHF) band, electromagnetic waves can penetrate the plasma membrane and reach the cell’s interior without causing damage. Consequently, ultra-high frequency dielectrophoresis (UHF-DEP) enables intracellular dielectric characterization while preserving cell viability, facilitating further investigations.
A dielectrophoresis experiment on a cell subpopulation may involve measuring the UHF-DEP crossover frequencies (CF) for a representative subset of cells from the sample. Specifically, when a cell is exposed to a non-uniform electric field, a crossover frequency is observed at the point where the field’s frequency is adjusted such that the cell shifts from a negative DEP regime (cell repulsion) to a positive DEP regime (cell attraction) [26]. At this characteristic frequency, the DEP force becomes zero. This DEP crossover at UHF is can be detected using a quadrupole microelectrode structure, as demonstrated in previous studies [28,29]. In practice, the CF value varies among individual cells within the studied subpopulation due to inherent cellular heterogeneity, resulting in variable dispersion of these characteristic frequencies. Once characterized by a representative number of cells, a median crossover frequency value is calculated. The electromagnetic signature (EMS) of the population is defined as the interquartile frequency range around the CF median value, encompassing ±25% of all measured cells.
Ultra-High-Frequency electromagnetic sensing presents as a novel approach for assessing the mutational load by analyzing the dielectrophoretic properties of cancer cells within the tens of MHz range. Although UHF-DEP does not directly measure mutational burden, it is plausible that UHF-DEP can detect electromagnetic properties indirectly associated with the cell’s mutational status. Mutations alter DNA sequences, leading to changes in genome and chromatin structure, disrupting gene expression, and causing modifications in the genes, RNAs, and proteins they encode. Notably, non-synonymous mutations result in either loss or gain of protein function, triggering significant changes in cellular phenotype, homeostasis, and behavior. These mutations can affect cell signaling pathways, metabolic processes, and cell cycle regulation—key hallmarks of cancer cells [30].
Here, we propose a model in which EMS of cells, measured by UHF-DEP, can indirectly provide insights into the genomic characteristics of cancer cells as a complementary biophysical parameter. This study potentially paves the way for exploring the relationships among between genotype, phenotype, and biophysical properties, suggesting that EMS data could help to guide patient eligibility for ICI treatments. Our findings highlight the potential of EMS to identify high-TMB solid tumor cell lines and to detect experimentally induced increases in somatic variant load. Future research will focus on validating the correlation between EMS and mutational burden across a broader range of cancer cell lines and tumors, including matched healthy counterparts, to reinforce EMS’ role as a predictive biomarker in oncology.
2. Materials and Methods
2.1. Cell Culture
Six solid cancer cell lines were obtained from the American Type Culture Collection (ATCC): lung adenocarcinoma (A549, H1975), glioblastoma (U87-MG), melanoma (SK-MEL-5 [MEL-5], SK-MEL-28 [MEL-28]) and, colon adenocarcinoma (SW480). The medulloblastoma cell line DAOY was kindly provided by the Dr. Mirella Tanori from the Italian National Agency for New Technologies, Energy and Sustainable Economic Development. All cell lines were cultured under adherent conditions in Dulbecco’s Modified Eagle Medium (DMEM) GlutaMAX (Gibco, Thermo Fisher Scientific, Illkirch, France). The medium was supplemented with 10% fetal bovine serum (FBS) (IDbio, Limoges, France) and 1% antibiotics (penicillin and streptomycin at 100 U/mL and 100 μg/mL, respectively) (Gibco, Thermo Fisher Scientific, Illkirch, France). All cell cultures were maintained at 37 °C in a humidified atmosphere with 5% CO_2_. Cells were cryopreserved by freezing at −80 °C in complete medium containing 10% Dimethylsulfoxide (DMSO) (Sigma-Aldrich, Saint-Quentin-Fallavier, France). To ensure experimental integrity, we performed weekly PCR-based screening of all cell cultures for mycoplasma contamination.
2.2. ENU Treatment
H1975 and U87-MG cell lines were exposed to 100 μM of the mutagenic agent N-ethyl-N-nitrosourea (ENU, Sigma-Aldrich, Saint-Quentin-Fallavier, France) for 24 h to increase their mutational load, thereby raising the number of somatic variants. This treatment was repeated six times at one-week intervals, allowing sufficient time for the clearance of cells undergoing death due to treatment-induced genotoxicity and for the enrichment of viable cell population.
2.3. Electromagnetic Signature Analysis
The electromagnetic signatures (EMS) of the target cell subpopulations of interest were established by measuring the intrinsic bioelectric characteristics of the cells using a lab-on-a-chip electromagnetic biosensor [31] capable of sensing intracellular dielectric properties (Figure 1A). This device integrates microfluidics and dielectrophoresis technologies to characterize cells in suspension through a high-frequency (>10 MHz) electromagnetic field (Figure 1A–C). An external flow controller drives the particle suspension through the microfluidic channel until the cells reach the sensing area. The UHF-DEP electric field applied to the cells is generated using a continuous-wave high-frequency signal generator combined with a power amplifier. A power splitter is used to apply the same signal, in both magnitude and phase, to the two sensor inputs. These signals are delivered to two wideband and matched to 50 Ohm impedance microstrip waveguide lines on the middle of which the micro size sensor device is implemented. RF probes are used to ensure proper connectivity with the power splitter; for which a 50 Ohm load is connected in parallel on each probe to prevent standing wave effects caused by the high impedance of the sensor. A high-speed oscilloscope monitors the DEP signal applied to the sensor in real time.
To measure the cell crossover frequency, cells are driven toward the four-electrode system. When a cell reaches the vicinity of the quadrupole, the flow is stopped, and a high-frequency negative DEP (nDEP) signal is applied (at 250 MHz, as shown in Figure 2A). This causes the cell to center itself in the region where the electromagnetic field gradient is weakest (black square area in Figure 2B). By gradually decreasing the frequency, a slight movement of the cell can be observed due to thermal and Brownian noise when the DEP force becomes very weak. As the frequency is further decreased until the cell switches to positive DEP (pDEP), the cell moves toward a lateral electrode (white square, Figure 2A). The frequency at which cellular movement begins is defined as the UHF dielectrophoresis CF. For cell A, the CF is 230 MHz, and for cell B, it is 215 MHz (Figure 2B). This measurement is repeated on several cells for each sample.
2.4. DEP Medium Preparation
The DEP medium is a specially formulated osmotic solution designed for electro-manipulation. It consists of deionized water supplemented with precisely controlled amounts of sucrose (8.5%), Tris base (1 mM), and anhydrous MgCl_2_ (0.69 mM) (Sigma-Aldrich, Saint-Quentin-Fallavier, France). To ensure compatibility with live-cell experiments, the medium’s pH was adjusted to the physiological value of 7.4. The conductivity of the medium was carefully controlled and monitored at 20 mS/m before each experiment using a calibrated conductivity meter. All measurements were conducted within a narrow conductivity range to ensure reproducibility, consistent with previously reported DEP protocols [28,29,32].
2.5. Genomic DNA Extraction and Qualification
Genomic DNA was extracted using the Maxwell^®^ CSC Genomic DNA Kit for cell lines on the Maxwell^®^ CSC Instrument PLC (Promega Corporation, Madison, WI, USA). DNA concentrations were measured with the Qubit™ Broad-Range (BR) dsDNA Assay Kit (Thermo Fisher Scientific, Illkirch, France) using a Qubit™ fluorometer (Thermo Fisher Scientific, Illkirch, France).
2.6. Tumor Samples
Genomic DNA from patient breast tumor samples for TMB analysis was obtained from the Centre de Ressources Biologiques (CRBioLim), in strict compliance with current regulations governing the use of biological samples for research purposes. The research was approved by the Institutional Review Board (IRB) of the Anatomo-Pathology Department of Dupuytren Hospital under approval number 2022-029. All procedures were conducted in accordance with the ethical standards of the Declaration of Helsinki. Written informed consent was obtained from all participants prior to their inclusion in the study.
2.7. TMB Determination by Next-Generation-Sequencing
TMB measurement was performed using 20 ng of genomic DNA with the Oncomine™ Tumor Mutation Load Assay kit (Thermo Fisher Scientific, Illkirch, France). Library quantification was conducted using the Ion Library TaqMan™ Quantification kit (Thermo Fisher Scientific, Illkirch, France) on the QuantStudio 5 real-time quantitative PCR instrument (Thermo Fisher Scientific, Illkirch, France). Libraries were loaded onto an Ion 540 chip using the Ion Chef™ Instrument (Thermo Fisher Scientific, Illkirch, France) sequencing array preparation system and subsequently sequenced on the Ion S5™ instrument (Thermo Fisher Scientific, Illkirch, France). Data analysis was performed using the online Ion Reporter™ Software version 5.20 (Thermo Fisher Scientific, Illkirch, France).
2.8. Statistical Analysis
Statistical analyses were conducted using GraphPad Prism software (version 10.0, Dotmatics, San Diego, CA, USA). Non-parametric Mann–Whitney tests were applied, and Pearson correlation analyses were used to assess linear relationships. Differences were considered statistically significant when p < 0.05. All experiments were independently repeated at least three times to ensure robustness and reproducibility. For all statistical analyses, a minimum of 200 individual cells per condition were collected from at least three independent biological replicates. Individual cell measurements were aggregated within each replicate, and the resulting replicate means were used as the unit of analysis.
3. Results
3.1. Analysis Workflow Development: Focus on Maintaining Cell Viability
Although EMS depends on several factors, the buffer used, DEP-B (DEP-Buffer), is compatible with both the conductivity (anionic) required for EMS analysis and the physiological osmolarity needed to minimize cell toxicity. Molecular and cellular alterations in dying cells can otherwise introduce significant artifacts, including (i) changes in cell structure and (ii) loss of DNA integrity following membrane disruption. Because cell viability is a critical parameter influencing these measurements, a systematic three-step cell sorting process (Figure 3A, step 2) was incorporated into the workflow designed to analyze TMB and EMS from cell lines with varying TMB levels (Figure 3A, steps 1 to 3). Consistent with this above workflow, DEP-B preserved cell viability for up to 90 min, after which viability decreased by more than 10% (p < 0.0001) (Figure 3B). Using a dead cell removal assay (Supplementary Materials and Methods), we significantly increased the proportion of viable cells (p < 0.0001, Figure 3C) before suspending them in DEP-B. As expected, median EMS frequency values were significantly lower in unsorted cells compared to sorted live cells, likely due to the influence of cell death (p < 0.0001, Figure 3D). Altogether, the cell handling time after sample preparation (Figure 3A, step 2) was limited to a maximum of 90 min to ensure that cell death remained below 10% during EMS characterization (Figure 3A, step 3). The reproducibility of this method was demonstrated across multiple biological replicates, as shown in Supplementary Figure S1. These results highlight the robustness of UHF-DEP in providing consistent measurements.
Overall, this workflow preserves cell viability, allowing for accurate TMB characterization and enhancing the reliability of our analyses to better reflect the biological state of the samples.
3.2. Discrepancies Between Methods for TMB Calculation
To evaluate the accuracy and consistency of tumor mutational burden (TMB) and mutation count calculations, we compared the Oncomine™ oncology panel with publicly available data using a panel of seven human cancer cell lines representative of solid tumors (U87-MG, DAOY, H1975, MEL-28, MEL-5, A549, and SW480) (Figure 4A). Consequently, we curated publicly available TMB data from the Cancer Cell Line Encyclopedia (CCLE) [33], available through the Broad Institute via cBioPortal (https://www.cbioportal.org/ (accessed on 2 July 2025)) [34]. In parallel, experimental data were generated from the same cell lines: after removing dead cells, DNA was extracted and used as template for mutation analysis, ensuring that each sample met quality control standards to exclude DNA degradation. TMB scores and mutation loads were then calculated using the Oncomine™ assay and compared to the CCLE data.
The Oncomine™ assay consistently revealed lower TMB values compared to CCLE (Figure 4A), with statistically significant differences (p < 0.05). Specifically, the TMB ranged from 3.69 to 17.97 Mut/Mb for Oncomine™ and from 4.77 to 18.8 Mut/Mb for CCLE across the different cell lines (Table 1A). Additionally, Oncomine™ showed a consistently higher total mutation count compared to CCLE (Figure 4B), with differences that were highly significant (p < 0.0001), underscoring methodological differences in mutation calling. This discrepancy between Oncomine™ and CCLE highlights the variability that may arise from differences in mutation-calling algorithms, sequencing depth, variant filtering criteria, panel design, and the genomic regions considered for TMB normalization, including potential differences in the inclusion of non-coding regions. Similarly, direct comparison of TMB values obtained with the Oncomine™ assay and Foundation Medicine (FMI) on two patient tumor samples (Tumor A and Tumor B) revealed that Oncomine™ tends to underestimate TMB in Tumor B, but overestimate it in Tumor A (Table 1B). Together, these results demonstrate that variability in TMB estimation is not limited to in vitro analyses but is also evident in tumor sample comparisons (Oncomine™ vs. FMI), highlighting the ambiguity and lack of robustness of current approaches.
Bland–Altman analyses were conducted to evaluate the agreement between the Oncomine™ and CCLE methods for TMB (Mut/Mb) and mutation count. For TMB, Bland–Altman plots demonstrated strong agreement between Oncomine™ and CCLE, with data points closely aligned along the solid line, indicating a small mean difference and acceptable limits of agreement (Figure 4C).
However, greater variability was observed for mutation counts (Figure 4D), highlighting differences in how mutations are counted and included in TMB calculations across methods. A statistically significant correlation was found for TMB values between Oncomine™ and CCLE (r = 0.93, p = 0.001; Figure 4E), indicating high concordance between the two methods in assessing TMB. In contrast, the correlation for mutation counts was moderate and not statistically significant (r = 0.61, p = 0.143; Figure 4F), suggesting that methodological differences in mutation calling have a greater impact on mutation count estimates across methods.
These results highlight the challenges of comparing TMB and mutation count data obtained from different methods. Although there is high concordance in TMB between Oncomine™ and CCLE, the observed variability in mutation counts underscores the need to develop standardized methodologies to ensure consistent and reliable results. This is especially critical for the clinical application of TMB as a predictive biomarker for immunotherapy.
3.3. Relevance of EMS for Determining TMB in Solid Tumor Cells
EMS measurements revealed that values varied across the panel of seven cancer cell lines (Figure 5A). Stratification according to TMB status showed significantly higher EMS frequency ranges in cell lines with high TMB (purple EMS box) compared to those with low TMB (blue EMS box) (p < 0.001; Figure 5B). To further investigate this association, we examined the relationship between EMS and TMB or mutation counts derived from the Oncomine™ assay. EMS correlated significantly with TMB (r = 0.79, p = 0.033; Figure 5C), while the correlation with mutation count showed only a non-significant trend (r = 0.70, p = 0.081; Figure 5D). We then compared these results with data from the CCLE, observing significant correlations between EMS and CCLE-derived TMB (r = 0.80, p = 0.029; Figure 5E) as well as mutation counts (r = 0.80, p = 0.028; Figure 5F).
Together, these findings indicate that EMS measurements are consistently correlated with mutational load across various datasets.
3.4. Assessing TMB and EMS in Response to Evolving Mutations
To directly assess the relationship between mutation accumulation and EMS, we established an incremental mutational burden model by repeatedly exposing U87-MG and H1975 cells to N-ethyl-N-nitrosourea (ENU) (Figure 6A). It is important to note that ENU induces random mutations, most of which remain uncharacterized and have unknown clinical implications. Consequently, the TMB cannot be accurately calculated from these mutations. Instead, we rely on the mutation count as a readout, which, while informative, does not provide the same clinical insight as TMB measurements. Across successive ENU cycles, both cell lines exhibited a progressive increase in mutation counts, although the kinetics differed between models (orange dotted line: H1975, green line: U87-MG, Figure 6B). Concurrently, EMS values increased in a similar stepwise manner after several ENU cycles (orange dotted line: H1975, green line: U87-MG, Figure 6C). Correlation analysis confirmed a strong association between EMS median frequency and mutation count across the ENU exposure series (r = 0.79, p = 0.001; Figure 6D).
These results demonstrate that EMS dynamics closely track increases in mutational load in vitro, supporting the concept that EMS monitoring can serve as a predictive indicator of mutation count.
4. Discussion
Biomarkers, whether prognostic or predictive of treatment response, are fundamental to precision oncology and represent a major challenge in global public health. Developing new technologies that can rapidly and affordably assess these biomarkers is a central objective of translational and interdisciplinary research aimed at improving patient stratification. The advent of immune checkpoint inhibitors (ICIs) has revolutionized cancer therapy but has also underscored the urgent need for reliable biomarkers to optimize patient selection [35]. Among emerging candidates, tumor mutational burden (TMB) has received FDA approval to determine eligibility for pembrolizumab treatment [20]. However, widespread clinical adoption remains limited due to the cost, technical complexity, and turnaround time associated with whole-exome sequencing, the current gold standard for TMB quantification [24]. Furthermore, the applicability of a universal threshold of 10 mutations per megabase remains a subject of debate [36].
To address these limitations, we investigated ultra-high-frequency (UHF) electromagnetic wave analysis as a novel, label-free method to infer TMB by measuring the dielectrophoretic crossover frequencies of cancer cells. Since mutations can alter DNA sequences and consequently affect gene expression, protein function, and intracellular organization—ultimately modifying signaling, metabolism, and proliferation—these molecular alterations may influence the dielectric properties of cells [37]. Nevertheless, the transition from genomic alterations to EMS remains a significant conceptual limitation of the present study. While UHF-DEP is sensitive to intracellular heterogeneity and organelle-level organization, we do not provide a formal biophysical model directly linking specific mutation-driven structural changes to the measured dielectric response. In particular, a rigorous mechanistic interpretation would require dielectric modeling frameworks, such as multi-shell cell models, that explicitly describe the respective contributions of the plasma membrane, cytoplasm, and intracellular compartments to the overall dielectric behavior. Incorporating such models would be a critical next step to move beyond empirical correlations and quantitatively relate mutation-induced intracellular alterations to EMS measurements. Although UHF-DEP characterization does not directly quantify mutations, it offers an indirect yet functional approach to assess mutation-linked biophysical changes. This method provides several advantages: it bypasses DNA extraction and sequencing, enables faster initial screening, and is non-destructive, thereby preserving cell viability for complementary downstream analyses.
Using this UHF-DEP–based workflow, we demonstrated that cells with high TMB could be distinguished from low-TMB cells using an EMS median frequency. TMB classification was defined using Oncomine™ data (≥10 Mut/Mb) consistent with FDA-approved thresholds, without requiring the companion diagnostic from FMI.
Importantly, EMS correlated significantly with TMB across diverse solid tumor cell lines, reinforcing the biological relevance of this parameter. However, insights from experiments involving the mutagenic agent N-ethyl-N-nitrosourea (ENU) highlight certain limitations. ENU induces random, non-physiological mutations that do not mirror the genetic evolution of oncogenesis. Consequently, the observed increases in EMS following ENU exposure may reflect cumulative genetic instability rather than clinically relevant mutational burden. This distinction suggests that mutational load, expressed as variant count, might better represent the degree of divergence between the parental and transformed cell populations, rather than an absolute index of mutation frequency. Further studies using more physiologically relevant models, such as oncogene-driven transformation or primary tumor cells, are warranted to validate this hypothesis. We acknowledge that our proof-of-concept study is limited by the number of independent biological replicates, and that formal power analyses to discriminate closely related cell lines would require substantially larger datasets. Consequently, our primary aim was to evaluate whether UHF-DEP–derived parameters capture biologically meaningful trends rather than to establish definitive classification thresholds. The similarity observed between certain cell line profiles highlights the limited discriminative power of EMS when used in isolation, reinforcing that comparisons with healthy counterparts are intended to contextualize trends rather than to achieve perfect classification.
Clinically, these observations imply that the most meaningful application of EMS may rely on comparative analyses between tumor cells and their matched healthy counterparts. Such differential assessments could provide a personalized dielectric reference, enhancing the sensitivity and interpretability of EMS-based diagnostics.
Overall, our findings support the potential of UHF-DEP analysis as a complementary tool for biomarker assessment, particularly for mutations captured through TMB. By enabling the detection of biophysical variations associated with mutational load, UHF-DEP could enhance patient stratification for ICI therapy and contribute to more personalized treatment selection.
These preliminary data underscore the potential of UHF-DEP to characterize cancer cells, paving the way for its broader application in patient stratification. Future research should focus on establishing standardized operating protocols, evaluating inter-sample reproducibility, and benchmarking UHF-DEP performance against established molecular assays and biomarkers. Furthermore, integrating UHF-DEP with sequencing-based tests could improve predictive accuracy by enabling multi-parametric biomarker strategies, with UHF-DEP serving as a complementary biophysical indicator rather than as a sole classification criterion. Large-scale studies across diverse cancer types will be essential to confirm that patients identified using this approach derive tangible clinical benefit from ICIs, validating UHF-DEP as a predictive and clinically actionable biomarker.
The reference list from the paper itself. Each links out to its DOI / PubMed record.
- 1Tan S. Li D. Zhu X. Cancer immunotherapy: Pros, cons and beyond Biomed. Pharmacother.202012410982110.1016/j.biopha.2020.10982131962285 · doi ↗ · pubmed ↗
- 2Shiravand Y. Khodadadi F. Kashani S.M.A. Hosseini-Fard S.R. Hosseini S. Sadeghirad H. Ladwa R. O’Byrne K. Kulasinghe A. Immune Checkpoint Inhibitors in Cancer Therapy Curr. Oncol.2022293044306010.3390/curroncol 2905024735621637 PMC 9139602 · doi ↗ · pubmed ↗
- 3Salik B. Smyth M.J. Nakamura K. Targeting immune checkpoints in hematological malignancies J. Hematol. Oncol.20201311110.1186/s 13045-020-00947-632787882 PMC 7425174 · doi ↗ · pubmed ↗
- 4Klein O. Kee D. Markman B. Carlino M.S. Underhill C. Palmer J. Power D. Cebon J. Behren A. Evaluation of TMB as a predictive biomarker in patients with solid cancers treated with anti-PD-1/CTLA-4 combination immunotherapy Cancer Cell 20213959259310.1016/j.ccell.2021.04.00533930312 · doi ↗ · pubmed ↗
- 5Butterfield L.H. Najjar Y.G. Immunotherapy combination approaches: Mechanisms, biomarkers and clinical observations Nat. Rev. Immunol.20242439941610.1038/s 41577-023-00973-838057451 PMC 11460566 · doi ↗ · pubmed ↗
- 6Chen X.-J. Yuan S.-Q. Duan J.-L. Chen Y.-M. Chen S. Wang Y. Li Y.-F. The Value of PD-L 1 Expression in Predicting the Efficacy of Anti-PD-1 or Anti-PD-L 1 Therapy in Patients with Cancer: A Systematic Review and Meta-Analysis Dis. Markers 20202020671791210.1155/2020/671791233488843 PMC 7787798 · doi ↗ · pubmed ↗
- 7Garon E.B. Rizvi N.A. Hui R. Leighl N. Balmanoukian A.S. Eder J.P. Patnaik A. Aggarwal C. Gubens M. Horn L. Pembrolizumab for the Treatment of Non–Small-Cell Lung Cancer N. Engl. J. Med.20153722018202810.1056/NEJ Moa 150182425891174 · doi ↗ · pubmed ↗
- 8Socinski M.A. Jotte R.M. Cappuzzo F. Orlandi F. Stroyakovskiy D. Nogami N. Rodríguez-Abreu D. Moro-Sibilot D. Thomas C.A. Barlesi F. Atezolizumab for First-Line Treatment of Metastatic Nonsquamous NSCLCN. Engl. J. Med.20183782288230110.1056/NEJ Moa 171694829863955 · doi ↗ · pubmed ↗