4D Flow MRI at 0.6 T—Self-Gating Versus Camera-Based Respiratory Binning
Sébastien Emery, Luuk Jacobs, Jacob Malich, Gloria Wolkerstorfer, Yiming Dong, Ece Ercan, Jouke Smink, Martijn Nagtegaal, Sebastian Kozerke

TL;DR
This study compares two methods for reducing motion in 4D MRI scans at low magnetic field strength, finding they produce similar results.
Contribution
The study evaluates the effectiveness of self-gating versus camera-based binning for 4D flow MRI at 0.6 Tesla.
Findings
Self-gating and camera-based binning showed strong agreement with cross-correlation coefficients of ~0.87.
Velocity analysis revealed high concordance (R2 = 0.99) between the two methods.
Camera-based binning is independent of MR image SNR, making it a viable alternative at low field strengths.
Abstract
Four-dimensional (4D) flow MRI enables the comprehensive assessment of cardiovascular hemodynamics. To compensate for respiratory motion, self-gating strategies are typically used and perform reliably at clinical field strengths. With the recent push towards field strengths below 1 Tesla, these strategies need to be re-evaluated given the reduced signal-to-noise ratio (SNR). Camera-based, contactless respiratory monitoring offers an attractive alternative to self-gating, as it is unaffected by imaging. This study compared respiratory self-gating (SG) and camera-based (VE) binning for phase-contrast gradient-echo (PC-GRE) 4D flow MRI at 0.6 T. Data were acquired from twenty healthy subjects (age: 32.8 ± 12.6 years) using a pseudo-spiral undersampled Cartesian four-point velocity encoding scheme. Reconstructions were performed with FlowMRI-Net for the end-expiratory state using either SG…
Click any figure to enlarge with its caption.
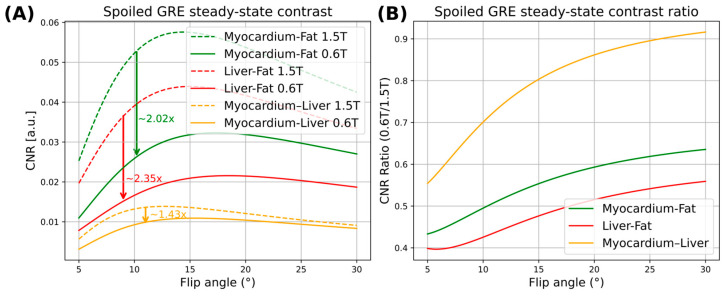 Figure 1
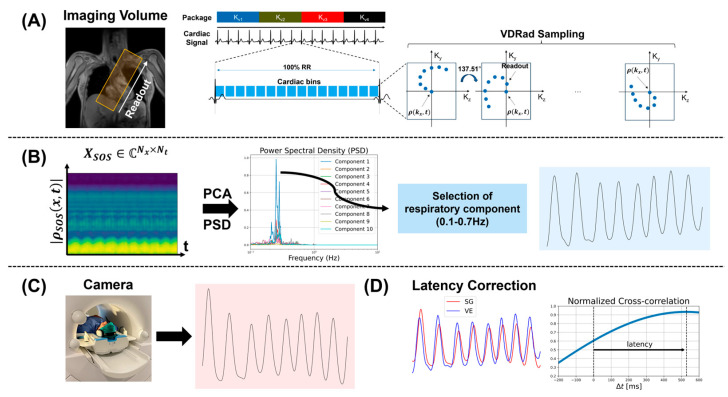 Figure 2
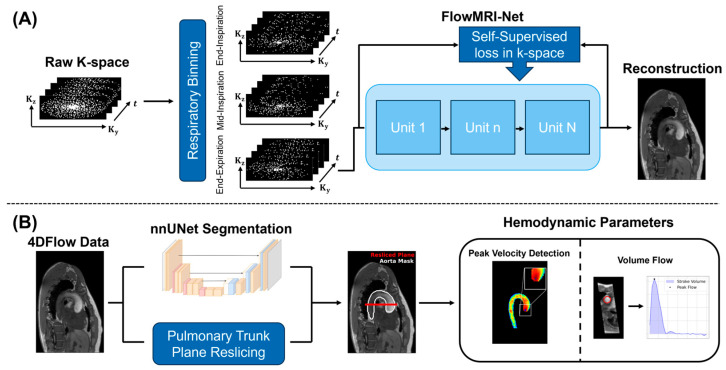 Figure 3
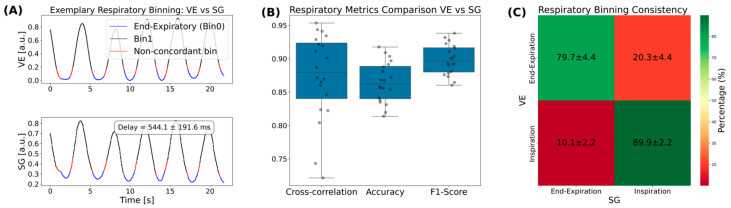 Figure 4
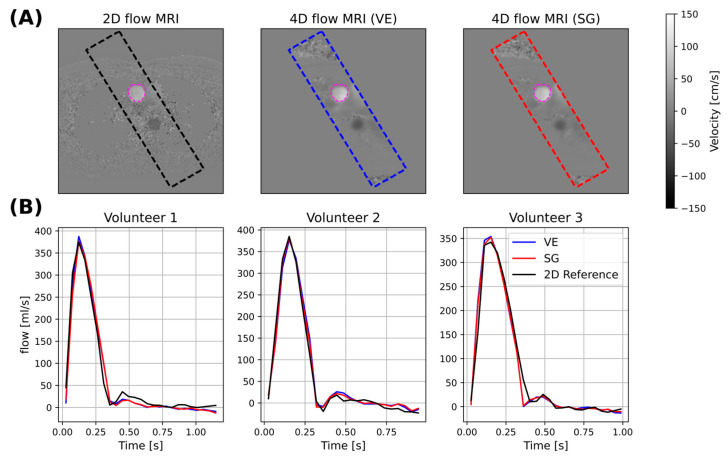 Figure 5
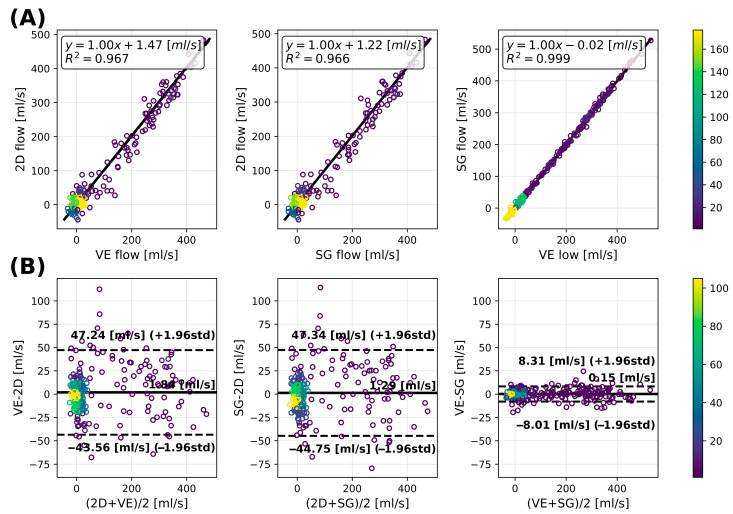 Figure 6
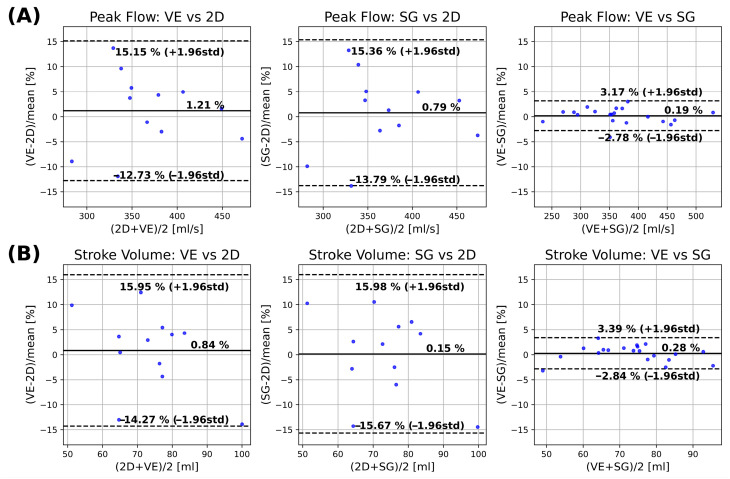 Figure 7
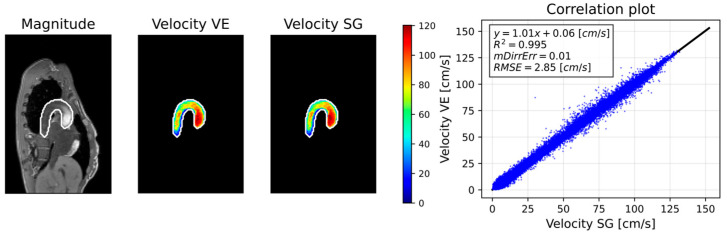 Figure 8
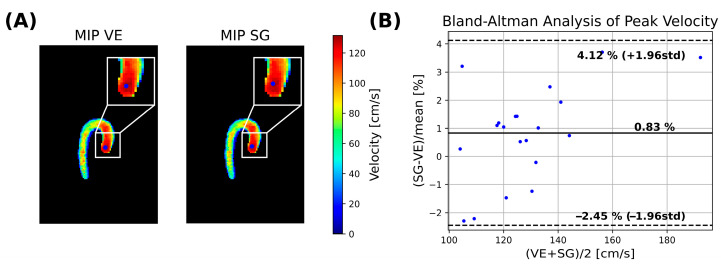 Figure 9
- —Swiss National Science Foundation
- —European Partnership on Metrology
- —Participating States
- —PPS Allowance made available by Health Holland
Peer Reviews
No public reviews on file for this paper yet. If you reviewed it on a platform where reviews are public (OpenReview, ICLR, NeurIPS, ICML), you can paste yours below so the community can read it here.
Videos
No videos yet. Explain this paper in a talk, walkthrough, or lecture? Add one.
Taxonomy
TopicsAdvanced MRI Techniques and Applications · Atomic and Subatomic Physics Research · Non-Invasive Vital Sign Monitoring
1. Introduction
Four-dimensional (4D) flow magnetic resonance imaging (MRI) is a time-resolved 3D phase-contrast (PC) technique that encodes blood flow velocities in all three spatial directions [1]. It enables comprehensive assessment of cardiovascular hemodynamics, from volumetric flow rates and peak velocities to advanced metrics such as wall shear stress, pressure gradients and 3D flow particle path visualization [2]. However, physiological motion, particularly due to respiration, represents one of the primary sources of artifacts in 4D flow MRI [3]. Consequently, respiratory compensation strategies have become a key objective in the development of 4D flow MRI protocols to enable broader clinical adoption.
Early approaches for respiratory motion compensation in 4D flow MRI relied on prospective gating using bellows [4,5,6] or navigators [7,8,9] to acquire data only during a restricted phase of the respiratory cycle. While these methods improved image quality, they also prolonged scan times and reduced acquisition efficiency, often resulting in clinically impractical examinations [10]. To overcome these limitations, more recent methods acquire data continuously in free breathing and retrospectively sort the measurement data into different respiratory bins using a surrogate signal [11]. Typically, the end-expiratory bin is reconstructed as it is the most reproducible respiratory phase [12]. Surrogate signals may be derived using MR-based self-gating (SG) [13,14,15,16] or other contactless approaches, such as video camera [17,18,19], pilot tone [10,20,21,22,23], or radar [24,25,26] approaches.
MR data-driven binning or self-gating derives the respiratory signal from the periodic sampling of the k-space center (k_0_(t)) [27,28,29] or from a one-dimensional profile (S(x,t)) [13,14,15,30,31,32]. In practice, SG often relies on projections spatially resolved along the superior–inferior (SI) direction, which provide robustness and specificity [33] of the respiratory signal arising from the periodic modulations of the heart–liver and lung–diaphragm interfaces. The breathing motion is typically extracted from the 1D profiles using principal component analysis (PCA). SG techniques have been widely implemented at clinical field strengths (1.5 T and 3 T), particularly for cine [15,28,29,30,34] and for PC imaging [11,13,31,35,36,37,38], where the high contrast-to-noise ratio (CNR) of the anatomical interfaces ensures robust respiratory signal extraction. However, with reduced SNR and CNR at lower magnetic fields, the respiratory modulation may become small relative to other signal components, potentially compromising respiratory signal extraction.
In recent years, mid-field MR systems operating at field strengths between 0.1 and 1 T have regained attention due to advantages such as reduced power deposition, favorable field homogeneity, and overall ease of use [39,40], which could facilitate more widespread adoption of 4D flow MRI in clinical practice. However, the intrinsically lower SNR at these field strengths may compromise SG, making a reassessment necessary. Most of the existing mid-field literature has focused on comparisons using standard clinical protocols, which are predominantly breath-held cine 2D acquisitions [41,42,43]. Recently, Sieber et al. compared a 5D CMR protocol to 2D cine reference scans and showed concordant results [44]. Recent mid-field research on flow imaging has primarily focused on PC balanced steady-state free precession (bSSFP) sequences [27,45] to exploit the higher intrinsic SNR and robust performance of bSSFP at these field strengths, leaving a gap regarding gradient-echo (GRE) 4D flow MRI, where the CNR of the heart–liver and lung–diaphragm interfaces may challenge reliable respiratory signal extraction. To this end, camera-based systems may provide a field strength-independent method for monitoring respiratory motion. The VitalEye (VE) implementation [19], for example, uses a camera to track chest motion to derive a respiratory signal [46,47]. The adoption of camera-based monitoring has been demonstrated across multiple applications, including abdominal imaging [48], cine imaging [49], 4D flow MRI [12,19], lung imaging [50,51], and cholangiography [52,53]. In the context of 4D flow MRI, prior studies have compared camera-based signals to navigators [19] or performed small-scale comparisons among camera, navigator, and self-gating against 2D reference acquisitions [54]. Despite these results, a direct comparison between camera-based and self-gating approaches for 4D flow MRI at mid-field has not yet been performed.
The objective of the present study is to demonstrate PC-GRE 4D flow MRI on a prototype 0.6 T scanner with high-performance gradients and to compare self-gating versus camera-based gating for respiratory motion compensation.
2. Methods
2.1. Signal Considerations
In radio-frequency-spoiled GRE [55], the transverse steady-state magnetization ( ) is given by:
where is the repetition time, and are the longitudinal and transversal relaxation times, is the flip angle, is the equilibrium magnetization and is the field strength.
Respiration-induced motion is reflected by superior–inferior (SI) displacement of the heart–liver interface [33], making this anatomical interface the primary contributor to the motion visible in 1D projection profiles. These profiles also include signal contributions from subcutaneous and abdominal fat. Because fat appears bright in T_1_-weighted imaging, elevated fat signals can partially obscure the modulation arising from the heart–liver interface. A comparison of relative contrast-to-noise ratios (CNR) between 0.6 T and 1.5 T for fat, myocardium, and liver interfaces depending on flip angle is shown in Figure 1. The corresponding ratios between 0.6 T and 1.5 T are included. Relaxation parameters ( ) for 0.6 T and 1.5 T were taken from [39]. Accordingly, a 2.0–2.4 reduction in CNR is expected at 0.6 T when compared to 1.5 T, potentially compromising the accuracy and precision of self-gating approaches.
2.2. Self-Gating
Self-gating signals are obtained by repetitively sampling the k-space center profiles as part of, e.g., pseudo-spiral Cartesian sampling (VDRad) [11] (Figure 2A):
where is the 1D k-space profile for coil at time t and is the respective coil-weighted profile at that time.
Upon inverse Fourier transform of , the projection matrix of the excited volume resolved along the spatial axis x over time is obtained. The projection was sampled approximately every 45 ms in our work, leading to a sampling rate of 22 Hz. The magnitude of the signal was used to derive the respiratory signal.
To extract respiratory motion from multi-coil 1D profiles, several strategies have been proposed in the literature [30,56]. Owing to spatially varying coil sensitivity profiles, individual coils emphasize different anatomical regions within the field of view. In this study, coil information was combined using a sum-of-squares (SOS) approach [28] (Figure 2B):
and principal component analysis (PCA) was applied to the resulting SOS projection. The first ten principal components were computed, and the respiratory motion signal was identified as the component exhibiting the maximum spectral power density within the expected breathing frequency range [0.1–0.7] Hz.
All data (=package) for one velocity encode (K_vi_) were collected before acquiring the next velocity encode (K_vi+1_) to reduce eddy current (EC)-related modulations of the SG signal [11] (Figure 2A).
2.3. Camera Gating
The camera was positioned to target the subject’s chest, capturing movements associated with breathing (Figure 2C). The recorded video was divided into equally sized rectangular patches, and video patches exhibiting periodic respiratory motion were automatically identified [47]. These patches were then weighted according to the strength of the detected motion, and the resulting signal was combined to provide an estimate of the subject’s respiratory motion.
To address potential processing and physiology-related latency of the camera-based respiratory signal [54], the VE signal was temporally aligned to the SG signal using normalized cross-correlation (Figure 2D). The relative delay was determined using:
2.4. Data Acquisition and Reconstruction
Pseudo-spiral undersampled Cartesian four-point 4D flow MRI [11] was implemented, and data were acquired on a prototype 0.6 T MRI system (Philips Healthcare, Best, The Netherlands) equipped with high-performance gradients (max strength: 45 mT/m, max slew rate: 200 T/m/s) and a 32-channel receive coil. Data were obtained from 20 volunteers (age: 32.8 ± 12.6 years, Table 1) following written informed consent and in compliance with institutional and ethical guidelines.
All scans were retrospectively cardiac-gated using a vector electrocardiogram (VCG), and the camera-based respiratory signal was obtained using the VitalEye (VE) camera [19]. A sagittal oblique field-of-view (360 mm × 240–188 mm × 60 mm) covering the thoracic aorta was prescribed (Figure 2A), with an isotropic spatial resolution of 2.5 mm^3^. Further parameters are listed in Table 2. Additionally, three separate two-point breath-hold 2D PC-GRE scans, encoding velocities in- and through-plane, were acquired as reference, using a transverse slice positioned perpendicular to the ascending aorta at the level of the pulmonary trunk (Table 2).
Respiratory gating was performed using either the SG signal or the VE system to bin the k-space data into three equally populated respiratory bins (Figure 3A). This binning strategy was chosen to provide a compromise between residual intra-bin respiratory motion and the increase in the effective undersampling associated with subdividing the data. Reconstruction was subsequently performed for the end-expiratory state (Figure 3A), resulting in an effective undersampling factor of approximately 12–13.5 for the end-expiratory bin.
Data using either SG or VE binning were reconstructed using FlowMRI-Net [12] (Figure 3A). Transfer learning was employed by initializing FlowMRI-Net with publicly available weights from pre-training on ten aortic 4D flow MRI acquisitions acquired at 1.5 T [57], which were subsequently fine-tuned for 100 epochs on four held-out acquisitions of the current 0.6 T data. Fine-tuning took ~2 days on an NVIDIA Titan RTX GPU and 32-core Intel Xeon Gold 6130 CPU. Once trained, image reconstruction took ~3 min per subject. Reconstructions were corrected for concomitant field terms [58] and first-order background phase correction was applied [59]. Potential velocity aliasing in-plane (AP and RL) was corrected using a 4D Laplacian algorithm [60].
The 2D PC-GRE scans were reconstructed using a standard parallel-imaging reconstruction pipeline available in precon (GyroTools LLC, Winterthur, Switzerland).
2.5. Data Analysis
2.5.1. Respiratory Analysis
To compare respiratory curves derived using SG ( and VE ( , the maximum of the cross-correlation function:
was quantified, where and denote the standard deviations of and , and denotes the covariance between the two signals.
To evaluate bin-level agreement, the end-expiratory state was treated as the positive class and the other two bins as the negative class, effectively formulating the problem as a binary classification task. The binning accuracy was computed as the fraction of time points for which the two signals were assigned to the same respiratory bin:
where TP are the true positives, TN the true negatives, FP the false positives and FN the false negatives. A respiratory consistency matrix was generated to provide characterization of bin-level agreement and disagreement, while the F1-score was calculated as a metric that simultaneously accounts for both precision and recall:
2.5.2. 2D Analysis
An axial 2D slice orthogonal to the ascending aorta was extracted from the 3D volume at the level of the pulmonary trunk to enable comparison of flow rate and stroke volume between 2D and 4D flow MRI data (Figure 3B). Correlation plots and Bland–Altman analyses between VE and SG relative to the 2D reference are provided. The statistical significance of differences was calculated using a paired Wilcoxon signed-rank test with p < 0.05.
2.5.3. 3D Analysis
To compare 3D velocity vector field maps between SG and VE, the aorta was automatically segmented using a customized nnUNet network [61,62] (Figure 3B). The velocity maps were subsequently computed and masked using the segmentation mask ( ). To compare SG and VE-based reconstructions, the root-mean-square error ( ) was computed within the vessel mask:
for the vector field components (SG) and (VE) and averaged across all cardiac phases.
The mean directional error (mDirrErr) within the vessel mask was computed for the systolic frames as:
and averaged over these frames.
Furthermore, the velocity magnitude ( ) was computed and a pixelwise correlation analysis was performed. The coefficient of variation ( ) is reported as a measure of the goodness of fit.
Peak velocities within the ascending aorta were extracted (Figure 3B), and agreement between VE and SG was assessed using Bland–Altmann analysis. To identify the region of maximum velocities, a non-maximum suppression strategy was employed at peak systole. First, a maximum intensity projection (MIP) was computed across the slice dimension to generate a 2D MIP map:
Subsequently, a sliding-kernel analysis was performed within the aortic mask. For each kernel position, the mean velocity was calculated, and the kernel yielding the highest mean velocity was designated as the peak velocity location:
where is a (4 × 4) kernel with all pixels belonging to . Peak velocity was then defined as the maximum voxel-wise velocity contained within this kernel:
3. Results
3.1. Respiratory Gating Analysis
Exemplary VE and SG signals are shown in Figure 4A with indicated respiratory binning. The mean delay between the signals was found to be 544 ms across the cohort. The corresponding cross-correlation was 0.87 ± 0.07, the accuracy 0.87 ± 0.03 and the F1-score 0.90 ± 0.02 (Figure 4B). Respiratory consistency analysis (Figure 4C) revealed that 79.7 ± 4.4% of bins corresponding to the end-expiratory state were concordant between both respiratory gating methods and that 20.3 ± 4.4% were non-concordant. The inspiration bin concordance was 89.9 ± 2.2% (10.1 ± 2.2% discordant).
3.2. 2D Analysis
An example peak-systolic through-plane velocity map of the 2D flow MRI reference is compared to corresponding planes extracted from VE and SG 4D flow MRI data in Figure 5A.
Figure 5B shows the extracted flow curves from the 2D reference and the resliced 2D plane from VE and SG for three different volunteers. The flow profiles agree qualitatively for the three different cases.
Quantitative results of the flow analysis are presented in Figure 6 and evaluated using correlation and Bland–Altman analyses. Good correlations were observed between the 2D flow and the 4D flow acquisition for both VE and SG (Figure 6A; R^2^ = 0.967 and R^2^ = 0.966, respectively). An excellent correlation was also observed between the VE and SG methods (R^2^ = 0.999). Bland–Altman analysis (Figure 6B) demonstrated a small bias between the 2D reference and the VE and SG methods (1.84 and 1.29 mL/s, respectively), with limits of agreement (−43.56 to 47.24 mL/s and −44.75 to 47.34 mL/s, respectively). In contrast, no relevant bias was observed between the VE and SG methods (0.15 mL/s), with narrow limits of agreement (−8.31 to 8.01 mL/s).
Agreement of hemodynamic parameters is shown in Figure 7 for peak flow (Figure 7A) and stroke volume (Figure 7B). Peak flow analysis shows a small bias between 2D flow and 4D flow MRI for VE and SG (1.21% and 0.79%), neither of which was significantly different from zero (p = 0.582 and p = 0.622). The corresponding limits of agreement were (−12.73 to 15.15% and −13.79 to 15.36%). Comparison between 4D VE and SG shows a non-significant bias (0.19%, p = 0.43) with narrow limits of agreement (−2.78 to 3.17%). Stroke volume analysis revealed biases between the 2D reference and the 4D VE and SG methods (0.84% and 0.15%, respectively), neither of which were statistically significant (p = 0.622 and p = 0.850). The corresponding limits of agreement were (−14.27 to 15.95% and −15.67 to 15.98%). Comparison between the 4D VE and SG methods showed a non-significant bias (0.28%, p = 0.368) with limits of agreement of (−2.84 to 3.39%).
3.3. 3D Analysis
Figure 8 illustrates 4D flow reconstructions using VE versus SG in one volunteer, along with corresponding velocity correlations. Table 3 summarizes the results of the velocity field analysis across the cohort. A linear relationship was measured across all volunteers, with an average and an intercept of 0.19 ± 0.28 cm/s. The velocity RMSE was cm/s, and the directional error (mDirErr) was .
Peak velocity comparison (Figure 9B) yielded a bias of −0.83% (p = 0.064), with limits of agreement of (−2.45% to 4.12%).
4. Discussion
4D flow MRI was successfully implemented on a prototype 0.6 T system. Good agreement between the VE and SG signals was found after delay correction, indicating that binning into the end-expiratory bin using either VE or SG was sufficiently reliable. Overall, the analysis of respiratory binning demonstrated a good correlation, high accuracy, and high F1-score between VE and SG. Bin assignment was concordant in about 80% of cases between VE and SG. The remaining 20% is attributed to differences in signal amplitude and shape between VE and SG signals, given that different body structures are tracked with the two approaches.
Compared with the 2D flow MRI reference, 4D flow MRI showed a tendency toward slight overestimation of flow for both VE and SG. The variability of both 4D flow methods compared with the 2D reference was similar. Subsequent direct comparison between VE and SG further demonstrated that the two methods were in close agreement, with negligible bias and low variability for both flow and derived hemodynamic parameters.
The slight overestimation of 4D flow relative to the 2D reference is somewhat counterintuitive and contrasts with the general expectations described in the 4D flow consensus paper [2]. In this study, a slice thickness of 10 mm was employed to increase the SNR of 2D flow MRI at 0.6 T, making the measurements more susceptible to misalignment and partial-volume effects [63]. Another contributor may relate to the velocity encoding package interleaving scheme, which increases the sensitivity to hemodynamic changes over the duration of the scan compared with TR- or beat-interleaving schemes. Further studies are needed to investigate these effects.
Comparison of velocity flow fields revealed good agreement between VE and SG reconstructions. Vector field fidelity, evaluated using the root-mean-square error (RMSE) of velocity vectors, demonstrated low error levels, while directional errors calculated over systolic frames were slightly lower than values previously reported in the literature [12]. Peak velocity estimates further exhibited good agreement, with SG- and VE-based reconstructions showing negligible bias and narrow limits of agreement in Bland–Altman analysis.
This study has several limitations. First, the relatively small number of volunteers and hence limited statistical power prevents drawing generalizable conclusions regarding the comparison between the two gating methods. Second, the study population consisted of relatively lean volunteers only. Therefore, future work should evaluate the robustness of both SG and VE across broader body morphologies and in larger cohorts. Third, the SG and VE signals were aligned using cross-correlation to account for temporal delays between the two signals. This approach required the presence of both signals and cannot be applied when only VE is available. For the purposes of this feasibility study, we applied the alignment, but would like to note that further development of delay correction strategies is required in the future.
5. Conclusions
In this feasibility study, respiratory self-gating and camera-based respiratory binning yielded similar image quality and hemodynamic measurements from 4D flow MRI at 0.6 T. The camera-based approach offers practical advantages, as it is independent of imaging SNR. Further studies in larger and more diverse populations are needed to fully assess the robustness and generalizability of the methods at mid-field.
The reference list from the paper itself. Each links out to its DOI / PubMed record.
- 1Markl M. Frydrychowicz A. Kozerke S. Hope M. Wieben O. 4D Flow MRIJ. Magn. Reson. Imaging 2012361015103610.1002/jmri.2363223090914 · doi ↗ · pubmed ↗
- 2Dyverfeldt P. Bissell M. Barker A.J. Bolger A.F. Carlhäll C.-J. Ebbers T. Francios C.J. Frydrychowicz A. Geiger J. Giese D. 4D Flow Cardiovascular Magnetic Resonance Consensus Statement J. Cardiovasc. Magn. Reson.2015177210.1186/s 12968-015-0174-526257141 PMC 4530492 · doi ↗ · pubmed ↗
- 3Dyverfeldt P. Ebbers T. Comparison of Respiratory Motion Suppression Techniques for 4D Flow MRI Magn. Reson. Med.2017781877188210.1002/mrm.2657428074541 PMC 6084364 · doi ↗ · pubmed ↗
- 4Santelli C. Nezafat R. Goddu B. Manning W.J. Smink J. Kozerke S. Peters D.C. Respiratory Bellows Revisited for Motion Compensation: Preliminary Experience for Cardiovascular MR Magn. Reson. Med.2011651097110210.1002/mrm.2268721413074 PMC 3126878 · doi ↗ · pubmed ↗
- 5Ehman R. Mc Namara M. Pallack M. Hricak H. Higgins C. Magnetic Resonance Imaging with Respiratory Gating: Techniques and Advantages Am. J. Roentgenol.19841431175118210.2214/ajr.143.6.11756333787 · doi ↗ · pubmed ↗
- 6Bissell M.M. Raimondi F. Ait Ali L. Allen B.D. Barker A.J. Bolger A. Burris N. Carhäll C.-J. Collins J.D. Ebbers T. 4D Flow Cardiovascular Magnetic Resonance Consensus Statement: 2023 Update J. Cardiovasc. Magn. Reson.2023254010.1186/s 12968-023-00942-z 37474977 PMC 10357639 · doi ↗ · pubmed ↗
- 7Ehman R.L. Felmlee J.P. Adaptive Technique for High-Definition MR Imaging of Moving Structures Radiology 198917325526310.1148/radiology.173.1.27810172781017 · doi ↗ · pubmed ↗
- 8Danias P.G. Mc Connell M.V. Khasgiwala V.C. Chuang M.L. Edelman R.R. Manning W.J. Prospective Navigator Correction of Image Position for Coronary MR Angiography Radiology 199720373373610.1148/radiology.203.3.91696969169696 · doi ↗ · pubmed ↗