Tailoring Electronic Properties of Precision Graphene Nanoribbons via Nanopore Engineering
Kun Liu, Guanzhao Wen, Gianluca Serra, Nicolás Arisnabarreta, Hongde Yu, Andrea Lucotti, Yarden Peleg Walg, Hartmut Komber, Zhen‐Lin Qiu, Qing‐Song Deng, Ran He, Wenhui Niu, Thomas Heine, Eike Brunner, Mischa Bonn, Steven De Feyter, Matteo Tommasini, Hai I. Wang, Ji Ma

TL;DR
This paper shows how adding nanopores to graphene nanoribbons can change their electronic properties, offering a new way to design materials for electronics.
Contribution
The study introduces two new porous graphene nanoribbons and systematically shows how nanopores affect their electronic behavior.
Findings
Porous GNRs have wider bandgaps and lower charge mobility compared to nonporous GNRs.
Nanopore engineering modulates exciton dynamics and electronic structure of GNRs.
Solution-phase synthesis enables precise nanopore incorporation into GNRs.
Abstract
The precise incorporation of nanopores into graphene nanoribbons (GNRs) offers a complementary strategy for modulating their opto‐electronic properties beyond conventional width and edge engineering. However, a systematic understanding of the relationship between the structure and electronic properties of porous GNRs (pGNRs) remains experimentally unexplored due to the lack of rational synthetic strategies. Herein, we report two novel porous GNRs (pGNR 1 and pGNR 2) synthesized via solution‐phase methods, featuring periodically arranged [18]annulene nanopores and gulf‐edged architectures, along with a nonporous GNR (npGNR) as a counterpart. Utilizing efficient Diels‐Alder polymerization and Scholl‐type cyclization, these GNRs attain average lengths of up to 60 nm. The chemical identities of the synthesized GNRs were comprehensively characterized by IR, Raman, and solid‐state NMR…
Genes, proteins, chemicals, diseases, species, mutations and cell lines named across the full text — each resolved to its canonical identifier and authoritative record.
Click any figure to enlarge with its caption.
 SCHEME 1
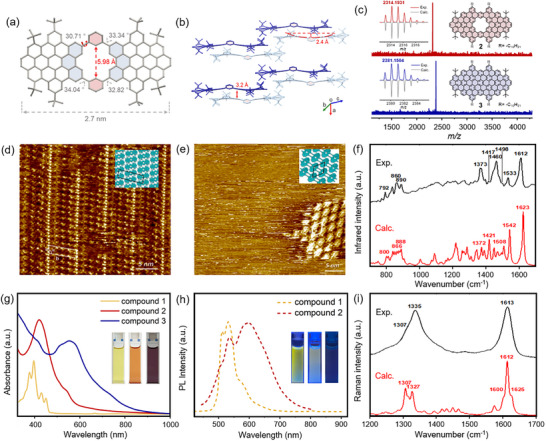 FIGURE 1
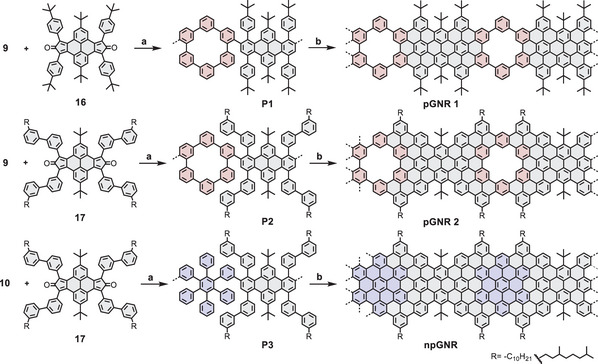 SCHEME 2
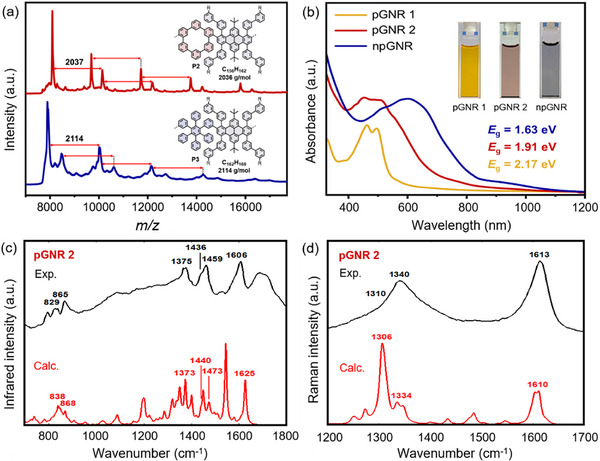 FIGURE 2
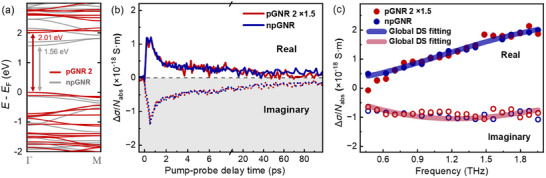 FIGURE 3
- —National Natural Science Foundation of China10.13039/501100001809
- —EIC‐2022‐Pathfinder Open
- —Research Foundation‐ Flanders (FWO)
- —KU Leuven–Internal Funds
Peer Reviews
No public reviews on file for this paper yet. If you reviewed it on a platform where reviews are public (OpenReview, ICLR, NeurIPS, ICML), you can paste yours below so the community can read it here.
Videos
No videos yet. Explain this paper in a talk, walkthrough, or lecture? Add one.
Taxonomy
TopicsSynthesis and Properties of Aromatic Compounds · Graphene research and applications · Covalent Organic Framework Applications
Introduction
1
Precision graphene nanoribbons (GNRs) have attracted considerable interest as promising materials for nanoscale electronic devices due to their highly tunable electronic properties [1, 2, 3, 4, 5]. Utilizing bottom‐up synthesis, via either surface‐assisted or solution‐based precision chemistry, the opto‐electronic and physicochemical properties of GNRs can be meticulously customized by modulating their width and edge structures [6, 7, 8, 9, 10, 11, 12]. Moreover, the deliberate introduction of well‐defined nanopores into graphene nanostructures not only alters their topological geometry but also enables modulation of their physical characteristics, broadening their potential applications in optical modulation [13, 14, 15, 16], thermoelectric devices [17, 18], and ion permeation [19]. Building on this concept, the incorporation of nanopores into GNRs brings a new dimension for engineering their opto‐electronic properties, with the effects primarily dictated by the shape, size, and distribution of the nanopores [20, 21, 22]. To date, experimental access to porous GNRs (pGNRs) remains limited, with most reported cases derived from on‐surface synthesis under ultrahigh‐vacuum conditions [23, 24, 25, 26, 27, 28]. However, this approach is hindered by low yield, undesired formation of cyclic oligomers, and restricted coherent π‐conjugation due to the presence of C–C single bonds along the GNR edges [29]. Recently, our group reported the first example of solution‐synthesized porous GNR via A_2_B_2_ Suzuki polymerization between a bis‐boronic ester macrocyclic monomer and a dihalogenated monomer, followed by the Scholl cyclization [30]. However, the longitudinal extension of these GNRs was limited by the low efficiency of the Suzuki polymerization step, primarily due to the high steric hindrance between the coupling monomers and the heterogeneous biphasic conditions. Furthermore, the structure–property relationship in GNRs associated with the nanopores remains largely unexplored.
In this work, we demonstrate two novel porous GNRs (pGNR 1 and pGNR 2), accompanied by a nonporous extended gulf‐edged GNR (npGNR) featuring the same width via A_2_B_2_ Diels‐Alder polymerization of a diethynyl monomer and cyclopentadienone derivative, followed by cyclodehydrogenation reaction. As representative segments of pGNR 1, pGNR 2, and npGNR, three model compounds (1, 2, and 3) were synthesized in excellent yields to manifest the high efficiency of the Scholl reaction. Crystallographic analysis of compound 1 reveals the characteristic porous topology, featuring a [18]annulene inner cavity with a diameter of ∼6 Å. The successful formation of the targeted GNRs was verified through a combination of infrared (IR), Raman, and solid‐state NMR spectroscopies. pGNR 2 exhibits a broader optical bandgap of 1.91 eV, representing an increase of 0.28 eV compared to the npGNR of the same width, consistent with the calculated trend in bandgap values. Furthermore, time‐resolved terahertz (THz) spectroscopy reveals that intrinsic charge carrier mobility decreases from ∼40 cm^2^ V^−^ ^1^ s^−^ ^1^ for npGNR to ∼27 cm^2^ V^−^ ^1^ s^−^ ^1^ for pGNR 2. Further analysis of frequency‐resolved photoconductivity unveils that the incorporation of nanopores does not increase the charge scattering effects in GNRs. Instead, the reduced photoconductivity observed in pGNR 2 stems from an increased effective mass arising from its porous structure. This study experimentally demonstrates the impact of periodic nanopores on the charge transport properties of GNRs within a well‐defined model system, offering valuable insights for the rational design and implementation of GNR‐based nanoelectronics.
Results and Discussion
2
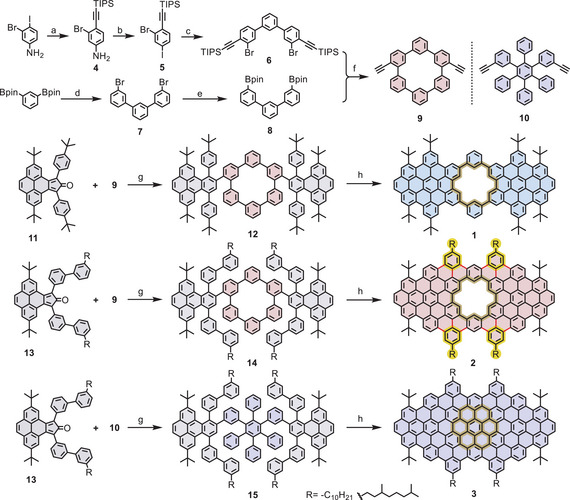
As illustrated in Scheme 1, model compounds 1, 2, and 3, representing well‐defined segments of pGNR 1, pGNR 2, and npGNR, respectively, were synthesized. These model systems serve as molecular references for understanding the electronic structure and provide strong validation of the efficiency of GNR formation. First, 3‐bromo‐4‐((triisopropylsilyl)ethynyl)aniline (4) was prepared in 95% yield by the selective Sonogashira coupling of 3‐bromo‐4‐iodobenzenamine with (triisopropylsilyl)acetylene. Subsequently, compound 4 was converted into ((2‐bromo‐4‐iodophenyl)ethynyl)triisopropylsilane (5) by Sandmeyer reaction in 57% yield. Afterwards, compound 6 was prepared via a twofold Suzuki coupling of 1,3‐bis(4,4,5,5‐tetramethyl‐1,3,2‐dioxaborolan‐2‐yl)benzene with compound 5 in 73% yield. Meanwhile, 3,3′′‐dibromo‐1,1′:3′,1′′‐terphenyl (7) was synthesized through a Suzuki coupling between 1,3‐bis(4,4,5,5‐tetramethyl‐1,3,2‐dioxaborolan‐2‐yl)benzene and 1‐bromo‐3‐iodobenzene in 90% yield. Subsequent Miyaura borylation gave 3,3''‐bis(4,4,5,5‐tetramethyl‐1,3,2‐dioxaborolan‐2‐yl)‐1,1':3',1''‐terphenyl (8) in 95% yield. Afterward, the Suzuki coupling of 6 and 8 at a dilute concentration, followed by treatment with tetrabutylammonium fluoride (TBAF), provided diethynyl‐[6]cyclo‐meta‐phenylene macrocycle 9 with a yield of 10 % over two steps. For the synthesis of a nonporous model compound as a counterpart, diethynyl‐hexaphenylbenzene 10 was prepared following a previously reported procedure with slight modifications [9]. With macrocyclic building block 9 in hand, a subsequent Diels–Alder reaction with cyclopentadienone 11 afforded the corresponding oligophenylene precursor 12 in 92% yield. Finally, the Scholl reaction of 12, carried out using iron chloride as the Lewis acid and oxidant, yielded model compound 1 in 90% yield. Following a similar synthetic strategy to that of compound 1, the π‐expanded porous model compound 2 and the corresponding nonporous model compound 3 with the same width, were obtained in 94% and 92% yields, respectively from precursors 14 and 15 under the same Scholl reaction condition.
Synthetic route toward model compounds 1, 2, and 3. Reagents and conditions: (a) (triisopropylsilyl)acetylene, CuI, PdCl2(PPh3)2, TEA, THF, r.t., 24 h, 95%; (b) NaNO2, KI, HCl/H2O/MeCN, 50–80°C, 30 min, 57%; (c) 1,3‐bis(4,4,5,5‐tetramethyl‐1,3,2‐dioxaborolan‐2‐yl)benzene, Pd(PPh3)4, K2CO3, THF/EtOH/H2O, 60°C, 48 h, 73%; (d) 1‐bromo‐3‐iodobenzene, Pd(PPh3)4, K2CO3, toluene/EtOH/H2O, 60°C, 24 h, 90%; (e) B2pin2, Pd(dppf)Cl2, KOAc, 1,4‐dioxane, 100°C, 12 h, 95%; (f) i. Pd2(dba)3, [(tert‐Bu)3PH]BF4, NaHCO3, THF/H2O, 80 °C, 3 days, 12%; ii. TBAF, THF, r.t., 20 min, 86%; (g) Ph2O, 260°C, 24 h, 92% for compound 12, 90% for compound 14 and 87% for compound 15; (h) FeCl3, CH3NO2, CH2Cl2, r.t., 1 h, 90% for compound 1, and 2 h, 94% for compound 2, and 2 h, 92% for compound 3.
The successful formation of 1‐3 was first confirmed by MALDI‐TOF MS analysis, in which the observed spectra were in good agreement with the simulated isotopic distribution patterns (Figure 1c and Figure S1). Thanks to its good solubility, the chemical structure of 1 was validated by ^1^H NMR spectroscopy and corresponding 2D NMR measurements (Figure S57). Moreover, a single crystal of 1 was obtained by slow vapor diffusion of methanol into a solution of compound 1 in 1,2‐dichlorobenzene, allowing for single‐crystal X‐ray diffraction measurement. Compound 1 crystallized along with 1,2‐dichlorobenzene molecules in a triclinic space group P1̅. As depicted in Figure 1a, 1 features a characteristic porous structure with an [18]annulene nanopore with a diameter of 5.98 Å. Additionally, the structure exhibited a bowl‐shaped geometry with a depth of 2.4 Å, attributed to steric repulsion between the phenanthrene units and the adjacent, tilted phenyl rings, which exhibited dihedral angles ranging from 30.71° to 34.04°. Furthermore, compound 1 forms racemic dimers via face‐to‐face π–π interactions with an interlayer distance of 3.2 Å (Figure 1b). These dimers further exhibit a brick‐layer stacking along the a‐axis by aligning with another pair of racemic dimers via π–π interactions. The structural studies of model compounds 1 and 2 were further carried out via scanning tunnelling microscopy (STM) at the highly oriented pyrolytic graphite (HOPG)/1,2,4‐trichlorobenzene (TCB) interface (Figure 1d and e). Accordingly, Figures 1d and S22 present STM images of an ordered network of bright units arranged in rows of alternating contrast for 1, presumably bearing the tert‐butyl groups in the upright position. Similar STM experiments were performed for 2, as observed in the STM images presented in Figures 1e and S23. These images exhibit an oblique arrangement of high‐contrast units. It is suggested that the peripheral decyl alkyl chains (represented as propyl) are pointing upwards into the supernatant solution and without interdigitation [31, 32]. Furthermore, the poor stability of 2 at the surface may result from the lack of strong intermolecular interactions, as only small domains are visualized. In contrast to 1 and 2, compound 3 exhibited low affinity for the HOPG surface and a strong tendency to aggregate, which consistently resulted in only large, high‐contrast blobs in STM measurements, despite our efforts under various conditions. Single‐crystal analysis and solution NMR characterizations of 2 and 3 were also not possible due to their poor solubility, which is attributed to the planar skeleton and pronounced aggregation in common organic solvents. Nevertheless, to validate the chemical structure of model compounds 2 and 3, we conducted IR and Raman measurements, and compared the obtained results with DFT‐calculated spectra (Figure S9). Concerning the IR spectrum of 2 (Figure 1f), we assign the two features measured at 792 and 890 cm^−1^ to the DUO and SOLO vibrations [33], respectively, which are computed at 800 and 888 cm^−1^. The relatively intense bands at 860 and 1373 cm^−1^ are vibrational markers of the nanopore, computed at 866 and 1372 cm^−1^ and assigned to out‐of‐plane and in‐plane CH bending in the pore, respectively (Table S5). The intense band observed at 1460 cm^−1^ does not have a clear computational counterpart. We tentatively assign this feature to the CH_2_ scissoring mode of the C_10_H_21_ alkyl chains, which are shorter in our model, and therefore provide a weaker transition. On the other hand, the Raman spectrum (Figure 1i) of 2 shows the two characteristic D‐ and G‐bands as expected for molecular graphene, at 1335 and 1613 cm^−1^, which are assigned to ring‐breathing and CC stretching modes, respectively.
(a, b) X‐ray crystallographic structure of 1 from the top and side views. Hydrogen atoms and solvent molecules are omitted for clarity. (c) HR MALDI‐TOF MS spectra of 2 and 3. (d) STM image of 1 self‐assembled at the HOPG/TCB interface; the inset shows a tentative model based on the experimentally extracted unit‐cell parameters: a=1.6 ± 0.2 nm, b=6.2 ± 0.4 nm, and α=109 ± 2°. U bias=‐0.5 V, I set=0.18 nA. (e) STM image of 2 self‐assembled at the HOPG/TCB interface; the inset shows a tentative model based on the experimentally extracted unit‐cell parameters: a=2.5 ± 0.1 nm, b=2.7 ± 0.1 nm, and α=63 ± 2°. U bias=‐0.75 V, I set=0.12 nA. (f) Normalized experimental and calculated IR spectra of 2. (g) UV–vis absorption spectra of 1, 2, and 3 in THF (10−5 M); the inset shows the photographic images of THF solutions of 1, 2, and 3 under ambient light. (h) PL spectra of 1 and 2 in THF (10−5 M); the inset shows the photographic images of THF solutions of 1, 2, and 3 under ultraviolet light at 365 nm. (i) Normalized experimental and calculated Raman spectra of 2.
To evaluate the influence of nanopore defects on optical properties, model compounds 1‐3 were further investigated using UV–vis absorption and fluorescence spectroscopy in anhydrous tetrahydrofuran. The UV‐vis spectrum of the nonporous compound 3 exhibited a main absorption at 556 nm, corresponding to its intense violet color (Figure 1g). In contrast, the porous compounds 1 and 2 displayed significantly blue‐shifted main absorption peaks at 396 nm and 420 nm, respectively, aligning well with the DFT‐calculated spectra (Figure S7a). The optical energy gaps (E gap) of compounds 1‐3 were estimated from the onset wavelengths of their absorption spectra, revealing the narrowest gap for 3 (1.69 eV), followed by those of 2 (2.06 eV) and 1 (2.66 eV). The nonporous model compound 3 exhibited no detectable luminescence due to the aggregation‐caused quenching (ACQ) effect, which is commonly observed in polycyclic aromatic hydrocarbons (PAHs) without structural defects [14, 34]. In contrast, as its porous counterpart with the same size, compound 2 emitted orange fluorescence at 597 nm (Figure 1h). These findings underscore the crucial role of engineered nanopores in modulating the bandgap and enhancing photoluminescence (PL) in nanographenes.
Encouraged by the successful synthesis of model compounds, the synthesis of the corresponding GNRs was further investigated. With building blocks 9 and 10 in hand, a subsequent Diels–Alder reaction with cyclopentadienones (16 or 17) afforded polyphenylene precursors P1, P2, and P3 in yields of 96%, 93%, and 95%, respectively (Scheme 2). Linear‐mode MALDI‐TOF MS analysis of the crude polymers revealed a family of signals spaced by 1396, 2037, and 2114 g mol^−1^ for P1, P2, and P3, respectively, corresponding to the molecular weight of their repeat units (Figures 2a and S3). Subsequently, the high‐molecular‐weight polyphenylene precursors were fractionated using recycling gel permeation chromatography (GPC), followed by analytical size‐exclusion chromatography (SEC) analysis against linear polystyrene (PS) standards. The analysis of P1 revealed a number‐average molar mass (M n) of ∼ 39.3 kDa with a narrow polydispersity (Đ) of ∼1.07 (Figure S2), whereas P2 and P3 exhibited higher M n of ∼ 48.5 kDa and 56.4 kDa, along with broader dispersities of ∼1.23 and 1.55, respectively (Figures S4 and S5). Finally, cyclodehydrogenation of the obtained fractions of P1‐P3 with the highest molecular weight via the Scholl reaction using FeCl_3_ yielded the targeted pGNR 1, pGNR 2, and npGNR with yields of 95%, 91%, and 94%, respectively. The average lengths of the resulting pGNR 1, pGNR 2, and npGNR were estimated to be approximately 60 nm, 50 nm, and 55 nm, based on their number‐average degree of polymerization (DP¯ * n
- ≈ 28 for P1, DP¯
n
- ≈ 24 for P2, and DP¯
n
- ≈ 26 for P3) and the length of the corresponding repeat unit. Owing to the presence of bulky tert‐butyl substituents and branched 3,7‐dimethyloctyl chains at the ribbon edges, the obtained GNRs exhibited good dispersibility in common organic solvents (0.1 mg mL^−1^), such as N‐methyl‐2‐pyrrolidone (NMP), chlorobenzene, and 1,2,4‐trichlorobenzene.
Synthesis of pGNR 1 and pGNR 2 as well as npGNR. Reagents and conditions: (a) Ph2O, 260°C, 24 h, 96% for P1, 93% for P2, and 95% for P3; (b) FeCl3, CH3NO2, CH2Cl2, r.t., 3 days, 95% for pGNR 1, 91% for pGNR 2, and 94% for npGNR.
Spectroscopic characterizations of polymer precursors and GNRs. (a) MALDI‐TOF MS analysis of polymer P2 and P3 (matrix: DCTB, linear mode). (b) UV‐vis absorption spectra of pGNR 1, pGNR 2, and npGNR in NMP (0.1 mg mL−1). (c) Normalized experimental (black line) and calculated (red line) IR spectra of pGNR 2. (d) Normalized experimental (black line) and calculated (red line) Raman spectra of pGNR 2.
The successful conversion of P1‐P3 into GNRs was initially corroborated through a comprehensive analysis involving IR and Raman spectroscopies, complemented by DFT simulations. In the experimental IR spectrum of pGNR 2 (Figure 2c), a prominent band appears at 865 cm^−1^, which closely aligns with the DFT‐predicted peak at 868 cm^−^ ^1^ and is attributed to the out‐of‐plane CH bending vibration localized at the nanopore. Another vibrational marker of the nanopore is a shoulder at 1436 cm^−1^ (computed at 1440 cm^−1^), corresponding to in‐plane CH bending at the pore. Additionally, a broad band observed at around 1695 cm^−1^ can be assigned to the CO stretching of a carbonyl group attached to a sp^2^ carbon at the GNR terminus, as well as infrared combination bands observed in aromatic systems [35, 36]. Furthermore, the unexpectedly weak intensity of the band predicted at 1542 cm^−1^, which corresponds to in‐plane CH bending within the pore, can be attributed to solid‐state effects that are not considered in our gas‐phase model. The Raman spectrum of pGNR 2 (Figure 2d), supported by DFT calculations, reveals the characteristic D‐ and G‐bands of molecular graphene, corresponding to collective ring‐breathing and C–C stretching vibrations, respectively. Moreover, solid‐state magic‐angle spinning (MAS) NMR measurements further support the successful graphitization of polymer P2 and P3 into the corresponding pGNR 2 and npGNR. The ^1^H MAS NMR of both pGNR 2 and npGNR exhibits slightly decreased chemical shifts, suggesting the formation of planarized structures with less agglomeration and reduced ring‐current shifts (Figure S16). In addition, the ^13^C cross‐polarization (CP) and directly excited (DE) MAS NMR spectra further corroborate the suggested structures (Figure S17).
Furthermore, the UV‐vis absorption spectra of the three GNRs dispersed in NMP are presented in Figure 2b. For pGNR 1, a distinct absorption peak with the longest wavelength is observed at 495 nm, whereas pGNR 2 exhibits a significantly red‐shifted absorption peak at 510 nm, attributed to π‐extension via the fusion of four additional phenyl rings along the gulf edges. In contrast to pGNR 2, the nonporous counterpart, npGNR, displays a pronounced bathochromic shift, with an absorption maximum at 601 nm, originating from extended electronic conjugation along the GNR backbone. Based on the Tauc plot method (Figure S6), pGNR 1 exhibits a broad optical bandgap of 2.17 eV, whereas pGNR 2 shows a narrower bandgap of 1.91 eV, being 0.28 eV larger than that of npGNR (1.63 eV). To elucidate the electronic effect of nanopore incorporation in the GNR, the band structure of pGNR 2 and its nonporous counterpart (npGNR) were calculated using the projector augmented‐wave (PAW) method in conjunction with the Perdew–Burke–Ernzerhof (PBE) exchange‐correlation functional (Figure 3a). These results reveal that the introduction of nanopores into the GNR backbone significantly alters the electronic structure, impacting both the bandgap and band dispersion. Specifically, pGNR 2 exhibits a near‐flat dispersion near the valence band maximum (VBM) and conduction band minimum (CBM), with bandwidths of ∼0.18 eV (VB) and ∼0.15 eV (CB), respectively, resulting in a wider bandgap of 2.01 eV. In contrast, npGNR exhibits more pronounced band dispersion, with wider VB and CB bandwidths of ∼0.26 eV and ∼0.29 eV, respectively, and a narrower bandgap of 1.56 eV, corresponding to a smaller effective mass (m^^ *) and more delocalized charge carriers.
Band structures and charge transport properties of pGNR 2 and npGNR. (a) Calculated band structures of pGNR 2 (red) and npGNR (gray). (b) Time‐resolved and (c) frequency‐resolved complex terahertz photoconductivity normalized to the absorbed photon density (Δσ/N abs) of both pGNR 2 and npGNR after photoexcitation at 3.1 eV. The solid lines in (c) correspond to a global fitting by the Drude–Smith model to pGNR 2 and npGNR.
To further assess the influence of periodic nanopores on the carrier transport properties in GNRs, we performed the optical pump‐terahertz probe (OPTP) spectroscopy [37, 38] on pGNR 1, pGNR 2, and npGNR films following excitations at 3.1 eV. For pGNR 1, light excitation results in zero real conductivity as shown in Figure S24, indicating complete exciton formation within the sample [39]. We discuss the plausible reasons for this purely excitonic response in pGNR 1 in the supporting information. Figure 3b shows the time‐resolved photoconductivity normalized to the absorbed photon density (Δσ/N abs) of pGNR 2 and npGNR. Both exhibit a sub‐picosecond rise in photoconductivity, consistent with the rapid generation of free carriers after photoexcitation. The subsequent decay, with a weighted average lifetime of ∼ 3 ps (fitting by exponential functions), corresponds to the carrier trapping and/or exciton formation [39, 40]. Remarkably, when the photoconductivity signals of pGNR 2 are scaled by a factor of 1.5, the overall dynamics closely match those of npGNR, indicating comparable carrier lifetimes but a reduced intrinsic photoconductivity in pGNR 2 after introducing the pore structure into GNRs.
To investigate the origin of the lower photoconductivity of pGNR 2, we recorded the frequency‐resolved photoconductivity at ∼0.8 ps after excitation. As shown in Figure 3c, after rescaling the photoconductivity of pGNR 2 by a factor of 1.5, the photoconductivity of both GNRs exhibits an indistinguishable frequency dependence. This result suggests that both GNRs share a similar scattering mechanism. To quantitatively describe the transport properties, the frequency‐resolved photoconductivity spectra are globally fitted using the phenomenological Drude‐Smith model [39, 41]. This model provides scattering times (τ DS) as 52 ± 2 fs and backscattering parameters (c) as ‐0.95 ± 0.01. These results indicate that introducing nanopores does not necessarily increase the charge scattering. Rather, the relatively low photoconductivity observed in pGNR 2 can be attributed solely to an increased effective mass (m ^*^) caused by its porous architecture, as supported by DFT calculations (Table S15): specifically, npGNR exhibits a significantly lower m^^
- value (0.115 m 0) compared to pGNR 2 (0.169 m 0). This effect may be attributed to the fact that the periodic nanopores interrupt the conjugation pathway, reducing the curvature of the electronic bands and thus increasing the carrier inertia. Based on the obtained microscopic parameters for transport, we can further estimate the charge carrier mobility in npGNR and pGNR 2. The intrinsic mobility (µ), calculated as µ = eτ DS/m ^*^, is high for both npGNR and pGNR 2 (795 ± 30 vs. 541 ± 21 cm^2^ V^−^ ^1^ s^−^ ^1^, respectively). Similarly, the dc‐limit mobility (µ dc), estimated via µ dc = µ(1 + c), is 40 ± 8 cm^2^ V^−1^s^−^ ^1^ for npGNR and 27 ± 5 cm^2^ V^−^ ^1^ s^−^ ^1^ for pGNR 2. Our results highlight the critical role of backbone continuity in controlling exciton dynamics and achieving high charge mobility in GNRs.
Conclusion
3
In summary, we established a model system to experimentally investigate the influence of nanopores on the opto‐electronic properties of precision GNRs. Through an efficient Diels–Alder polymerization strategy and Scholl‐type cyclization, a novel class of porous GNRs, accompanied by a nonporous GNR were synthesized with average lengths of up to 60 nm. To elucidate the structural features of the corresponding GNRs, three representative model compounds (1, 2, and 3) were synthesized in high yields. Single‐crystal X‐ray analysis of compound 1 confirmed a well‐defined porous structure, characterized by a [18]annulene cavity with a diameter of 5.98 Å. The obtained GNRs were thoroughly characterized by IR, Raman, and solid‐state NMR spectroscopies. The incorporation of nanopores induced marked alterations in the opto‐electronic properties. Both model compound 2 and pGNR 2 exhibited pronounced blue shifts in their absorption spectra and improved solubility compared to the nonporous counterpart. Optical measurements indicated that incorporating nanopores serves as an effective strategy for modulating the electronic bandgap of GNRs, as evidenced by pGNR 2, which exhibited an optical bandgap of 1.91 eV—0.28 eV wider than that of its nonporous counterpart (npGNR, 1.63 eV). THz spectroscopy further revealed that introducing nanopores does not increase charge scattering but instead flattens the band dispersion, leading to an increased effective mass and a consequent reduction of charge carrier mobility from nearly 40 cm^2^ V^−^ ^1^ s^−^ ^1^ for npGNR to around 27 cm^2^ V^−^ ^1^ s^−^ ^1^ for pGNR 2. This study presents an effective strategy for engineering the electronic properties of GNRs through nanopore incorporation and provides valuable insights for the rational design of porous graphene nanostructures for applications in optoelectronic devices, with potential extensions to thermal management, ion transport, and DNA sequencing.
Conflicts of Interest
The authors declare no conflicts of interest.
Supporting information
Supporting File 1: anie71508‐sup‐0001‐SuppMat.pdf.
The reference list from the paper itself. Each links out to its DOI / PubMed record.
- 1X. Li , X. Wang , L. Zhang , S. Lee , and H. C. D. Dai , “Chemically Derived, Ultrasmooth Graphene Nanoribbon Semiconductors,” Science 319, no. 5867 (2008): 1229–1232, 10.1126/science.1150878.18218865 · doi ↗ · pubmed ↗
- 2L. Jiao , L. Zhang , X. Wang , G. Diankov , and H. Dai , “Narrow Graphene Nanoribbons From Carbon Nanotubes,” Nature 458, no. 7240 (2009): 877–880, 10.1038/nature 07919.19370031 · doi ↗ · pubmed ↗
- 3J. Cai , P. Ruffieux , R. Jaafar , et al., “Atomically Precise Bottom‐up Fabrication of Graphene Nanoribbons,” Nature 466, no. 7240 (2010): 470–473, 10.1038/nature 09211.20651687 · doi ↗ · pubmed ↗
- 4A. Narita , X.‐Y. Wang , X. Feng , and K. Müllen , “New Advances in Nanographene Chemistry,” Chemical Society Reviews 44 (2015): 6616–6643, 10.1039/C 5CS 00183 H.26186682 · doi ↗ · pubmed ↗
- 5G. Z. Magda , X. Jin , I. Hagymási , et al., “Room‐Temperature Magnetic Order on Zigzag Edges of Narrow Graphene Nanoribbons,” Nature 514, no. 7524 (2014): 608–611, 10.1038/nature 13831.25355361 · doi ↗ · pubmed ↗
- 6K. Nakada , M. Fujita , G. Dresselhaus , and M. S. Dresselhaus , “Edge State in Graphene Ribbons: Nanometer Size Effect and Edge Shape Dependence,” Physical Review B 54 (1996): 17954–17961, 10.1103/Phys Rev B.54.17954.9985930 · doi ↗ · pubmed ↗
- 7R. S. K. Houtsma , J. De La Rie , and M. Stöhr , “Atomically Precise Graphene Nanoribbons: Interplay of Structural and Electronic Properties,” Chemical Society Reviews 50, no. 11 (2021): 6541–6568, 10.1039/D 0CS 01541 E.34100034 PMC 8185524 · doi ↗ · pubmed ↗
- 8X. Yang , X. Dou , A. Rouhanipour , L. Zhi , H. J. Räder , and K. Müllen , “Two‐Dimensional Graphene Nanoribbons,” Journal of the American Chemical Society 130, no. 13 (2008): 4216–4217, 10.1021/ja 710234 t.18324813 · doi ↗ · pubmed ↗