Does Vegetation Recovery Limit the Habitat Use of Herbivore? Decadal Evidence of a Potential Ecological Mismatch
Zhiwei Liu, Zhangfeng Cheng, Rui Guo, Qian Lei, Liulin Guan, Xiao Song, Shanshan Zhao, Aichun Xu

TL;DR
Vegetation recovery in a reserve did not improve habitat for sika deer and may have caused an ecological mismatch over ten years.
Contribution
Shows that forest restoration may not benefit herbivores due to ecological mismatch between vegetation and habitat use.
Findings
Sika deer activity intensity increased significantly from 2015 to 2024.
Vegetation indices had weak, negative effects on deer activity, while topographic and anthropogenic factors were significant.
NDVI showed a significant increase before 2021 followed by a decline, indicating ecological mismatch.
Abstract
In the context of large-scale forest ecological restoration, we examined the relationship between decadal (2015–2024) activity intensity of sika deer and vegetation (leaf area index and normalized difference vegetation index), together with topographic and anthropogenic factors. We found that activity intensity of sika deer had a sustained increase over time. Vegetation indices had weak, periodical effects on sika deer activity, whereas topographic and anthropogenic variables exhibited significant effects. Our findings demonstrate that vegetation recovery within the reserve does not automatically improve habitats for forest-dependent herbivores, and could lead to a potential ecological mismatch. Large-scale forest ecological restoration is commonly expected to improve habitat quality and promote population growth of forest-dependent herbivores. Yet, whether vegetation recovery…
Genes, proteins, chemicals, diseases, species, mutations and cell lines named across the full text — each resolved to its canonical identifier and authoritative record.
Click any figure to enlarge with its caption.
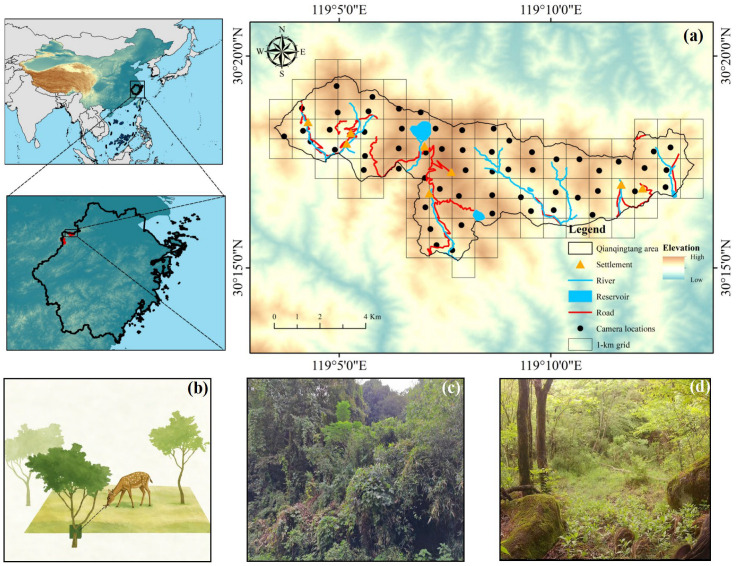 Figure 1
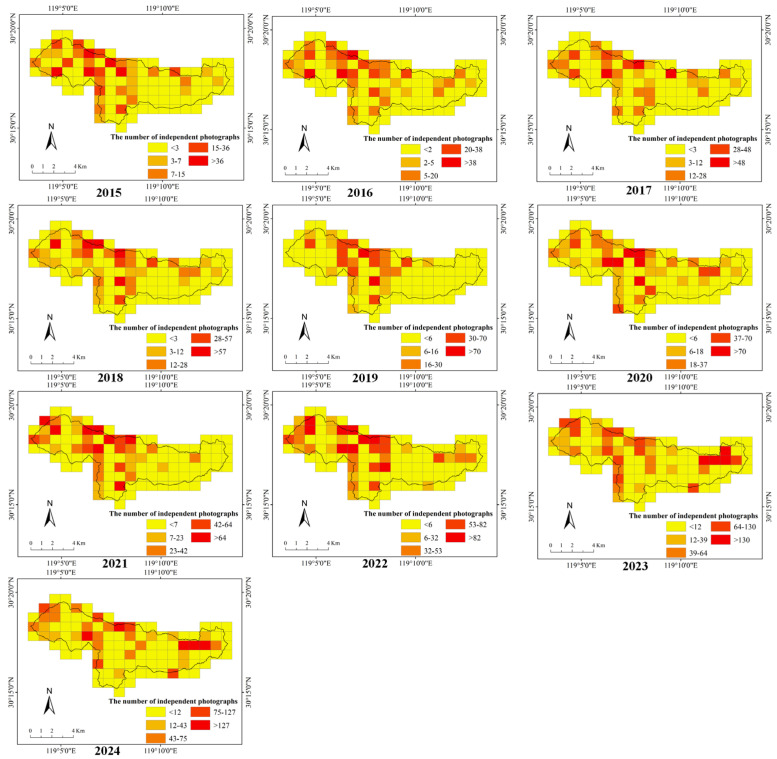 Figure 2
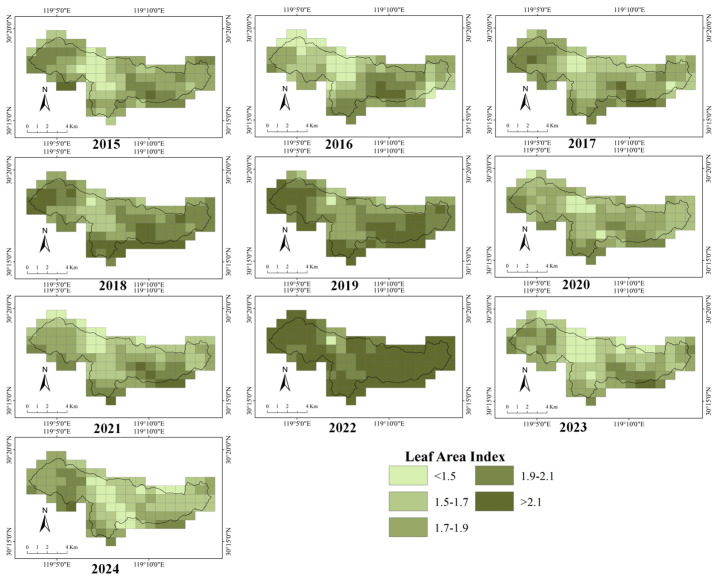 Figure 3
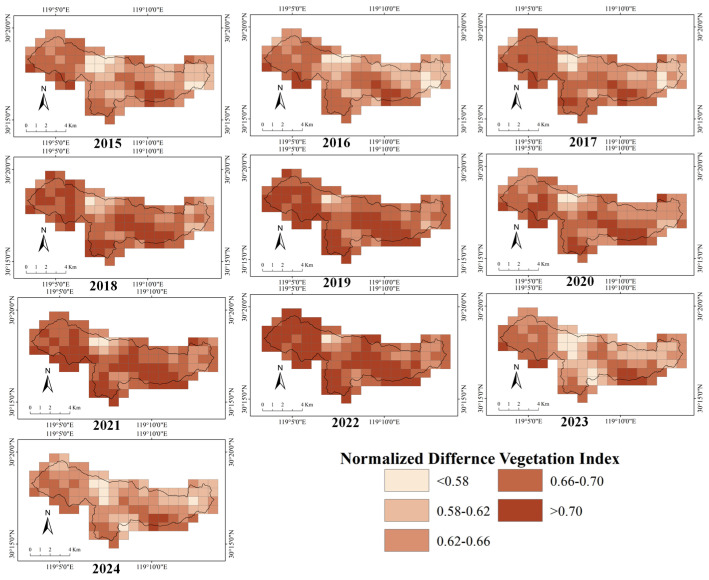 Figure 4
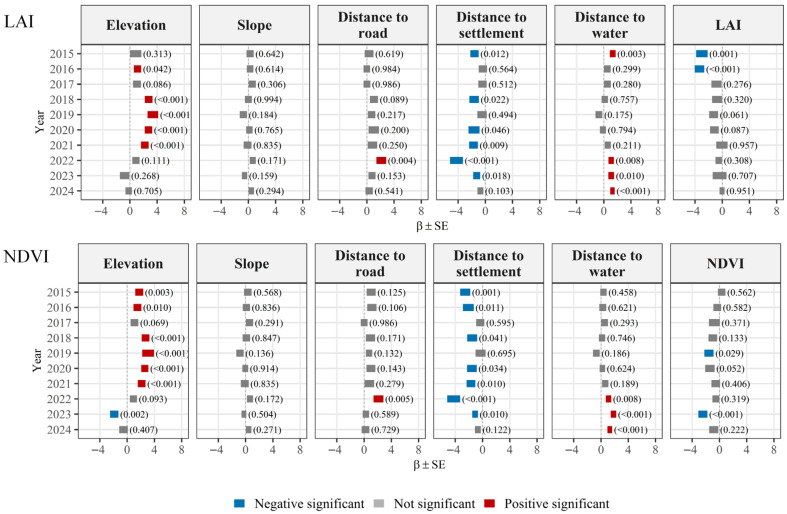 Figure 5
- —Research on the Distribution and Ecology of Sympatric Species of South China Sika Deer
- —Natural Science Foundation of China
- —Research Initiative on Agriculture and Social Development in Hangzhou Lin’an
Peer Reviews
No public reviews on file for this paper yet. If you reviewed it on a platform where reviews are public (OpenReview, ICLR, NeurIPS, ICML), you can paste yours below so the community can read it here.
Videos
No videos yet. Explain this paper in a talk, walkthrough, or lecture? Add one.
Taxonomy
TopicsWildlife Ecology and Conservation · Wildlife-Road Interactions and Conservation · Ecology and Vegetation Dynamics Studies
1. Introduction
Large-scale ecological restoration and conservation initiatives have accelerated forest recovery globally over recent decades [1]. In China, the Natural Forest Protection Program (NFPP) and the expansion of the protected-area network have markedly improved forest ecosystem conditions. By 2018, the NFPP had increased national forest cover from 12.7% in 1973 to 22.96%, while total forest growing stock rose from 8.7 billion m^3^ to 17.6 billion m^3^ [2]. As one of the world’s largest restoration programs, the Natural Forest Protection Program has substantially reduced large-scale logging in natural forests [3]. These policy interventions have created favorable conditions for the recovery and expansion of large herbivore populations.
However, vegetation recovery does not necessarily lead to parallel improvements in local habitat quality for large herbivores [4]. Increases in ecological mismatches between vegetation recovery and large herbivores might occur. In the early stage of vegetation recovery, the increase in food resources promotes the growth of herbivore populations and allows them to reach a peak. In the middle and late stages of vegetation recovery, progressive canopy closure reduces understory light availability, thereby suppressing the growth and regeneration of herbaceous and shrub layers [5]. These changes may limit understory foraging and constrain herbivores that depend on understory vegetation [6]. In addition, as vegetation recovery and succession progress, plant communities in some shrub-dominated habitats may become excessively dense, forming closed shrub thickets that restrict the movement space of large herbivores [7]. Therefore, it is vital to identify the mismatch progress and conduct measures to moderate the paradox for regional sustainable development.
Gaining a deeper understanding of herbivore responses to vegetation recovery requires decadal empirical studies and the explicit evaluation of different vegetation metrics [6,8,9]. Previous research assessing vegetation effects on wildlife has largely relied on short-term monitoring data or single vegetation indices, most commonly the normalized difference vegetation index (NDVI) [10,11,12,13]. NDVI often saturates under closed-canopy and high-biomass conditions [14], limiting its ability to characterize forest canopy structure [15]. In contrast, the leaf area index (LAI) more directly characterizes canopy structural attributes and is widely regarded as an important indicator of forest structural succession [16]. Integrating NDVI and LAI with decadal wildlife activity data offers a more comprehensive approach for characterizing large herbivore responses to vegetation structural change.
Sika deer exhibit a fragmented distribution across East Asia [17]. The South China sika deer (Cervus nippon kopschi), an endemic and regionally endangered species in China, is listed as a Class I national protected species and is classified as endangered in the China Biodiversity Red List [18]. At present, this endangered species occurs only in fragmented forest habitats within hilly and mountainous areas of the Zhejiang, Jiangxi, and Anhui provinces [19]. Owing to agricultural, pastoral expansion, forest degradation, and historical poaching pressure, its population remained at extremely low levels for decades, with estimates of approximately 300 individuals by the late 20th century [19,20]. In recent years, strengthened conservation measures and reduced anthropogenic disturbance have facilitated a gradual population recovery. As a typical herbivore, the South China sika deer primarily feeds on shrubs or shrub-grass mosaics, and uses the forests for sheltering [21,22]. It is a kind of wildlife that favors landscapes with low canopy density forests and low-density shrubbery, and avoids the dense cover of forest and shrub [21,22]. A stable population is currently found in the Qingliangfeng Biosphere Reserve. Within this typical subtropical montane forest ecosystem, under intensified conservation management and gradually denser forest and shrub, the South China sika deer provides an opportunity to examine activity intensity in relation to vegetation metrics, as well as topographic and anthropogenic disturbance variables under decadal forest recovery. Therefore, it is a favorable case to illustrate the responses of a large herbivore to vegetation across decadal spatiotemporal scales [23].
Based on camera-trapping monitoring data collected over a decade (2015–2024) and extracted vegetation and other environmental variables from the Qingliangfeng Biosphere Reserve, this study systematically examined the spatiotemporal dynamics of sika deer activity intensity in relation to vegetation succession. Specifically, we aimed to: (1) quantify decadal spatiotemporal trends in sika deer activity intensity; (2) characterize interannual spatiotemporal variation in key vegetation indices; and (3) evaluate the combined effects of vegetation indices and other environmental factors, including topography, hydrology, and anthropogenic disturbance on sika deer habitat use. We hypothesized that: (1) sika deer’s activity intensity and vegetation feature would tend to be dynamic; (2) vegetation and other environmental factors contribute to its habitat use, and ecological mismatch between the activity of deer and vegetation recovery would appear. Our study provides new empirical evidence for understanding vegetation–habitat interactions and habitat use mechanisms in sika deer under ongoing forest succession.
2. Materials and Methods
2.1. Study Area
Globally, a total of 785 biosphere reserves have been designated, among which 14 biosphere reserves are distributed in subtropical regions. The Qingliangfeng Biosphere Reserve (30°01′–30°18′ N, 118°50′–119°12′ E) is one of the old reserves in this network and represents a typical subtropical montane forest ecosystem. It is situated in Northwest of Zhejiang, China, and spans an elevation range of 399–1787.4 m [24,25]. The reserve lies at the northern margin of the mid-subtropical zone and has a subtropical monsoon climate [24]. The Qingliangfeng Biosphere Reserve comprises three geographically isolated areas, including Longtangshan, Shunxiwu, and Qianqingtang, among which, the Qianqingtang area constitutes the primary distribution area of the South China sika deer (Figure 1). This area covers approximately 56.9 km^2^ and is characterized by mountainous terrain at elevations of around 1000 m, with relatively gentle slopes and broad, shallow valleys. The mean annual precipitation is approximately 1862 mm, exhibiting strong seasonality, with rainfall concentrated in summer and autumn and comparatively lower precipitation during winter and spring. The mean annual temperature is 11.7 °C, and the accumulated annual temperature ranges from approximately 2200 to 4800 °C, with pronounced variation along elevational gradients and across seasons [26]. Vegetation is dominated by deciduous broad-leaved forests, coniferous forests, and mixed conifer–broad-leaved forests, with localized patches of evergreen broad-leaved forest and meadow habitats, forming a complex mosaic of forest structures and habitat types [27]. The Qingliangfeng Biosphere Reserve supports high biodiversity, with records of 2452 vascular plant species, 355 vertebrate species, and 2567 insect species [25]. This diversity of forest types and topographic conditions provides a highly heterogeneous habitat for forest-dependent herbivores.
2.2. Camera-Trapping Survey
Firstly, we divided the study area into 107 square survey grid cells (1 km × 1 km) based on ArcGIS 10.8 (ESRI, Redlands, CA, USA) (Figure 1) [28]. We deployed infrared cameras (Ltl Acorn 6210, Zhuhai Ltl Acorn Electronics Co., Ltd., Zhuhai, China) across the grid system. Cameras were not installed in a small number of grid cells where the protected area was extremely limited. Some camera locations and identification numbers were adjusted during the survey period due to equipment malfunction or inadequate image quality (further details are provided in Table S1). For each grid cell, the geographic center was located in the field using a handheld GPS unit and used as the predefined camera placement point. Cameras were installed within a 50 m × 50 m area centered on this point, preferentially at locations with sparse understory vegetation, along animal trails, or near water sources [29]. Camera placement took local terrain conditions into account, including slope, aspect, and topography. To minimize interference from direct sunlight during sunrise and sunset, cameras were oriented toward the northeast or southwest and mounted on tree trunks at heights of 40–90 cm above ground level. Surrounding environmental conditions at each camera location were also recorded [30]. Prior to deployment, all cameras were configured using standardized settings, including time synchronization, two consecutive photographs per trigger, a minimum trigger interval of 5 s, and medium sensitivity. Cameras were inspected every 4–6 months, during which SD memory cards (32 GB) and batteries were replaced to ensure continuous operation. A total of 58 infrared cameras were deployed in the Qingliangfeng Biosphere Reserve.
We examined retrieved photographs for species identification and recorded associated metadata, including capture time and the number of consecutive images [29,31]. Over the 10-year monitoring period (2015–2024), we accumulated 170,962 camera-trapping days and recorded 15,614 independent photographs. We defined independent photographs as consecutive images of the same species at the same camera location in each 30 min [31]. And pictures of the same species within 30 min were recorded as 1 independent photograph.
2.3. Explanatory Variables
Previous studies have demonstrated that topographic features, vegetation indices, and distance to water sources significantly influence habitat use by sika deer [21,22,32]. Accordingly, we considered four categories of explanatory variables, including topography, vegetation, hydrology, and anthropogenic disturbance (Table 1). Elevation and slope were derived from a digital elevation model (GDEMV3, 30 m resolution) using spatial analysis in ArcGIS 10.8. Vector data for the road network, settlements, and hydrological features were initially obtained from the National Geomatics Center of China (www.webmap.cn). To improve spatial accuracy, we manually corrected and supplemented these vector datasets in ArcGIS 10.8 using high-resolution satellite imagery, allowing a more realistic representation of current patterns of human activity and hydrological distribution within the study area. We then used Euclidean distance tools to calculate the distance from each sampling unit to the nearest water body and settlement.
We used the LAI to represent total leaf area per unit ground surface area as an indicator of canopy structural characteristics [33] and the NDVI to characterize vegetation greenness and reflect vegetation growth activity [34]. LAI data were obtained from the MODIS MCD15A3H product (4-day composite, 500 m spatial resolution), and annual mean values were calculated using Google Earth Engine. NDVI data were derived from the MODIS MOD13Q1 product (16-day composite, 250 m spatial resolution) and were similarly processed to obtain annual mean values [35]. We calculated annual averages of both indices for each year from 2015 to 2023.
2.4. Statistical Analyses
We analyzed spatiotemporal pattern dynamics of sika deer in the Qingliangfeng Biosphere Reserve. To examine temporal trends in sika deer activity intensity from 2015 to 2024, we fitted generalized linear mixed models (GLMMs) with year as a fixed effect, the number of independent photographs and the relative abundance index separately as response variables [36]. Camera ID was incorporated as a random effect to account for repeated measurements across sampling locations. Prior to model fitting, we evaluated the distributional properties of the response variables by examining the relationship between the mean and variance (Table S1). Because the variance exceeded the mean (Table S1), we used a negative binomial distribution to account for overdispersion. We compared the trend model (including year) with a null model (excluding year) using AICc, and likelihood ratio test (LRT) [36]. Spatially, we applied the kernel density estimation to visualize the spatial distribution of sika deer within the Qingliangfeng Biosphere Reserve for each year.
We analyzed spatiotemporal dynamics of vegetation indices in the Qingliangfeng Biosphere Reserve. Temporally, we used one-way ANOVA to analyze annual grid level data to test for interannual differences in the LAI and the NDVI. In this analysis, LAI and NDVI extractions were based on the 1 km × 1 km grid cells, and we have calculated annual LAI and NDVI for each of the 107 grid cells across the full study period (2015–2024). In addition, to further examine decadal temporal trends in vegetation indices overall in the study area, we applied segmented linear regression to analyze decadal changes in vegetation indices [37,38]. Spatially, we fitted ordinary least squares regressions to grid-level LAI and NDVI time series (2015–2024) and extracted the interannual trend slope for each of the 107 grid cells. We used these slopes to quantify spatial variation in both the direction and magnitude of vegetation change across the study area. We then applied kernel density estimation to visualize the annual spatial patterns of vegetation change within the Qingliangfeng Biosphere Reserve.
To examine the effects of vegetation and other environmental factors on habitat use by the South China sika deer, we employed GLMMs and generalized linear models (GLMs) [39,40]. We conducted the all-year analysis and specific-year analysis. The response variable was the number of independent photographs of sika deer. Because the data were count-based and exhibited overdispersion (Table S1), we fitted all models using a negative binomial distribution implemented via the glm.nb function in the MASS package (version 7.3-65) in R (version 4.5.2) [41]. During all-year analysis, explanatory variables included elevation, slope, NDVI (or LAI), and distances to settlements, water sources, roads, and year. Due to potential collinearity between NDVI and LAI [42,43], two suits of models involving NDVI or LAI were created. Camera ID was served as random effect [44]. During specific-year analysis, we excluded the year and conducted GLMs. We also applied the negative binomial distribution because the overdispersion parameters (ĉ) lied 0.950–1.642 based on the assumed models with negative binomial distribution (Table S2). In addition, we generated candidate models and performed model selection based on Akaike’s information criterion in all-year and specific-year analysis. Models with ΔAICc < 4 were treated as the optimal models, and retained for model averaging because this threshold captured most of the cumulative Akaike weight [45,46]. Parameter estimates were then obtained using model-averaged coefficients across the optimal models [47]. In addition, nested models within optimal models were further compared with the best model using LRT to assess whether inclusion or exclusion environmental variables significantly could improve the model fit.
3. Results
3.1. Spatiotemporal Patterns of Sika Deer
From 2015 to 2024, we accumulated 170,962 camera-trapping days and recorded 15,614 independent photographs. Time-series analyses based on camera-trapping monitoring data revealed a consistent and statistically significant increase over time in both the number of independent photographs and the relative activity index of sika deer (Figure 2 and Figure S1, Tables S3 and S4). The LRT results showed that the model including the year significantly improved model fit (χ^2^ = 176.28, p < 0.001) (Table S3). Year had a significant positive effect (Estimate = 0.18 ± 0.012 SE, z = 14.69, p < 0.001) on the number of independent photographs of sika deer (Figure S1, Table S3). A similar increasing trend was detected for the relative abundance index of South China sika deer (Table S4 and Figure S1).
3.2. Spatiotemporal Patterns of Vegetation Recovery
The interannual variations in LAI and NDVI at the grid scale within the study area are shown in Figure 3 and Figure 4. One-way ANOVA showed that both LAI and NDVI differed significantly among years within the study area (Tables S5 and S6) (p < 0.001), indicating pronounced interannual variation in vegetation indices from 2015 to 2024. Interannual variation in NDVI was relatively small, whereas LAI exhibited greater variability. The temporal changes in the mean values of NDVI and LAI across the study area are shown in Figure S2 and Table S7. Segmented regression analysis indicated that the temporal trend of mean annual NDVI in the study area exhibited a significant breakpoint around 2021.82 (SE = 0.430) (Table S8). Prior to this breakpoint, NDVI increased significantly with year (slope = 0.0067 ± 0.0023, t = 2.88, p = 0.028). In contrast, NDVI declined significantly after the breakpoint (slope = −0.0301 ± 0.009, t = −3.510, p < 0.010). The segmented model showed a good fit, explaining a substantial proportion of the interannual variation in NDVI (adjusted R^2^ = 0.679). By contrast, segmented regression analysis did not identify a significant temporal breakpoint in mean annual LAI over the study period (Table S9). Although the estimated breakpoint occurred in 2018.73, its associated standard error was large (SE = 3.710). The slopes before and after the breakpoint were both non-significant (before breakpoint: slope = 0.050 ± 0.097, t = 0.52, p = 0.624; after breakpoint: slope = −0.030 ± 0.052, t = −0.57, p = 0.097). Overall, the segmented model exhibited poor explanatory power (adjusted R^2^ = −0.356).
Spatially, the multi-year distributions of LAI and NDVI at the decadal scale across the study area are shown in Figure S3. Both vegetation indices exhibited clear spatial gradients, with higher LAI and NDVI values primarily distributed along the peripheral areas of the reserve. Overall, the spatial pattern was characterized by higher values in the south than in the north, and in the west than in the east, whereas no clear pattern was observed in the central part of the study area. With respect to interannual trends (Figure S3), the directions of change in LAI and NDVI were spatially inconsistent. Some areas exhibited persistent increases (slope > 0), whereas others showed weak changes or a mixture of positive and negative trends, resulting in an overall patchy spatial pattern.
3.3. Vegetation and Other Environmental Variables’ Contribution
Model ranking showed that LAI (or NDVI) fell into the candidate optimal models (Tables S10–S12). LRT results showed that models including LAI or NDVI could not significantly improve model fit compared with the best model (LAI: χ^2^ = 0.744, p = 0.388; NDVI: χ^2^ = 0.151, p = 0.697) (Tables S11–S13). And model-averaged estimates indicated no significant effects of LAI (Estimate = −0.010 ± 0.027 SE, p = 0.721) or NDVI (Estimate = −0.004 ± 0.025 SE, p = 0.860) (Table 2). Distance to settlement had a significant and negative effect, whereas distance to road, elevation, and year had significant and positive effects (Table 2). Model including or excluding variables could not improve the model fit significantly (Tables S11–S13).
LAI (or NDVI) also fell into the candidate optimal models in specific analysis (Tables S14 and S15). Model-averaged results showed that the effects of topographic, hydrological, and anthropogenic variables on sika deer activity intensity exhibited pronounced interannual heterogeneity (Figure 5; Table S16). LAI had a significant and negative effect on deer occurrence in 2015 and 2016 (Figure 5). NDVI showed negative associations with sika deer occurrence in most years except 2015, with a significant negative effect detected in 2019 and 2023.
4. Discussion
In the context of vegetation recovery, clarifying the response patterns of herbivores to vegetation characteristics is essential for the conservation of endangered wildlife and for effective habitat management. This study was conducted in the Qingliangfeng Biosphere Reserve and focused on the sika deer as the focal species. By examining the effects of vegetation change on sika deer, this study provides a case example of herbivore responses to vegetation recovery. Vegetation recovery is a key process for alleviating habitat degradation and restoring ecosystem functions. For instance, natural succession and rewilding following farmland abandonment in Europe have facilitated the return and expansion of deer and other large herbivores [48]. In tropical secondary forests, landscapes with higher forest cover have been shown to support greater abundances of ungulates, such as white-tailed deer and collared peccaries [49]. In temperate secondary forests, structural restoration of forest stands can substantially increase deer foraging opportunities and habitat use [50]. These studies indicate that improved habitat conditions constitute a critical ecological basis for the persistence and potential growth of large herbivore populations [48,49,50].
Sika deer activity intensity and vegetation features exhibited interannual heterogeneity, which supports our first hypothesis (both the vegetation and deer’s activity intensity tend to be dynamic over time). At the grid level, vegetation trends within the reserve produced a highly heterogeneous, patchy spatial pattern. Meanwhile, the number of independent photographs of sika deer increased markedly from 2015 to 2024 in the reserve. These patterns contribute to decadal conservation management and reduced anthropogenic disturbance of the reserve. Under the broader framework of the Natural Forest Protection Program, the forests were restricted on logging, and conserved [3]. However, vegetation within the reserve showed pronounced interannual heterogeneity, with no clear overall temporal trend and spatially heterogeneous rates of change (Figure S3). This pattern might be due to the relatively short study period in relation to forest recovery processes, which tends to be insufficient for capturing long-term vegetation trends. Since the establishment of reserve in 1985 [20], the accessibility of residents was restricted, and farming and livestock grazing have decreased [51]. These rules reduced anthropogenic disturbance and contributed to the recovery of vegetation and sika deer’s population.
Vegetation and other environmental factors contributed to deer habitat use in both the all-year and specific-year analyses, partly supporting our second hypothesis (that deer’s habitat use was influenced by environmental factors and a potential ecological mismatch with vegetation recovery emerged). Neither LAI nor NDVI was significantly associated with sika deer activity intensity in all-year analysis. But in specific-year analysis, LAI had a significantly negative effect in early periods whereas NDVI became significantly negative in mid and late periods. The combined results showed an unclear pattern, which suggested obscure deer–forest relations. But negative effects of vegetation indices (NDVI/LAI), although not significant, appeared in most models, which might be the potential ecological mismatch and lie in the primary stage. In addition, due to the small population of sika deer, the abundance of this species is in a rapid growth stage in this region without large carnivorous wildlife. The limitation effects of vegetation have not yet appeared and may exhibit a lag effect [52]. A similar pattern has been reported in other deer studies [53], which proves that density dependence can obscure the relationships between remotely sensed environmental variables and demographic rates. Future research should incorporate the field microhabitat data and seasonal variation associated with vegetation structure to clarify its relationship. And it is necessary to conduct long-term monitoring, identifying the mismatch, and anticipating timely adaptive management.
Elevation, distance to settlement and distance to roads were the key factors influencing the habitat use of sika deer in our study. In all-year analysis and most specific-year analyses, deer tended to inhabit higher elevations in the reserve, and selected the lower elevation habitat in the recent year from 2023 and 2024. This pattern might be due to the density-dependent habitat expansion. In former years, the abundance of deer was small, and the deer prioritized the optimal habitat located in the higher elevation [32]. As the population grew, sika deer shifted to inhabit in the low elevation region [20,22]. Sika deer selected the near settlement regions, which could be explained by the special spatial distribution of settlements. The settlements in the reserve are protection stations [20,54], which could not produce threats for deer. Sika deer avoided roads, consistent with widespread evidence that roads function as high-risk landscape features that constrain ungulate movement and habitat use through persistent anthropogenic disturbance [55,56,57]. Overall, it is necessary to partition the conservation zone in relation to elevation, settlements and roads, and conduct specific measures for sustainable development.
5. Limitations
Some limitations occurred in current study. We focused on the independent photographs of sika deer and explored its relationships with the vegetation. However, other aspects, such as group size, the use and dynamics of trails, interspecific relationships among herbivores, and browsing impacts of herbivores on the forest, were not included, which were directly related to vegetation structure and should be investigated in the future.
6. Conclusions
Using camera-trapping data collected over a decade (2015–2024) and associated with vegetation and environmental factors extracted for the Qingliangfeng Biosphere Reserve, this study systematically examined the spatiotemporal dynamics of sika deer activity intensity in relation to vegetation succession. We found that both the number of independent photographs and the relative abundance index of sika deer show a sustained increase over time. Vegetation indices showed weak, period-dependent effects on sika deer activity, whereas anthropogenic variables exhibited clearer effects. We recommend that long-term monitoring of sika deer and investigation of its habitat and microhabitat should be enhanced. Our findings provide new empirical evidence for understanding the habitat use of large herbivores under forest recovery and offer a scientific basis for forest structural regulation, habitat management, and adaptive management of population dispersal.
The reference list from the paper itself. Each links out to its DOI / PubMed record.
- 1Benayas J.M.R. Newton A.C. Diaz A. Bullock J.M. Enhancement of Biodiversity and Ecosystem Services by Ecological Restoration: A Meta-Analysis Science 20093251121112410.1126/science.117246019644076 · doi ↗ · pubmed ↗
- 2Wang H. He M. Ran N. Xie D. Wang Q. Teng M. Wang P. China’s Key Forestry Ecological Development Programs: Implementation, Environmental Impact and Challenges Forests 20211210110.3390/f 12010101 · doi ↗
- 3Gutiérrez Rodríguez L. Hogarth N.J. Zhou W. Xie C. Zhang K. Putzel L. China’s Conversion of Cropland to Forest Program: A Systematic Review of the Environmental and Socioeconomic Effects Environ. Evid.201652110.1186/s 13750-016-0071-x · doi ↗
- 4Hale R. Blumstein D.T. Mac Nally R. Swearer S.E. Harnessing Knowledge of Animal Behavior to Improve Habitat Restoration Outcomes Ecosphere 202011 e 0310410.1002/ecs 2.3104 · doi ↗
- 5Su X. Wang M. Huang Z. Fu S. Chen H.Y.H. Forest Understorey Vegetation: Colonization and the Availability and Heterogeneity of Resources Forests 20191094410.3390/f 10110944 · doi ↗
- 6Long E.S. Tham E.J. Ferrer R.P. Succession and Climatic Stochasticity Induce Long-Term Decline of a Forest Browser P Lo S ONE 202419 e 029823110.1371/journal.pone.029823138412173 PMC 10898743 · doi ↗ · pubmed ↗
- 7Cuéllar-Soto E. Johnson P.J. Macdonald D.W. Barrett G.A. Segundo J. Woody Plant Encroachment Drives Habitat Loss for a Relict Population of a Large Mammalian Herbivore in South America Therya 20201148449410.12933/therya-20-1071 · doi ↗
- 8Hobbs R.J. Cramer V.A. Restoration Ecology: Interventionist Approaches for Restoring and Maintaining Ecosystem Function in the Face of Rapid Environmental Change Annu. Rev. Environ. Resour.200833396110.1146/annurev.environ.33.020107.113631 · doi ↗