Novel Roman domination-based graph energies for QSPR analysis of neuroprotective herbal compounds in Alzheimer’s disease treatment
A. Salini Jancy Rani, B. J. Balamurugan

TL;DR
This paper introduces a new graph-based method for analyzing herbal compounds that may help treat Alzheimer's disease, showing better accuracy than traditional methods.
Contribution
The paper introduces novel Roman domination-based graph energies for QSPR analysis of herbal compounds.
Findings
Roman domination-based graph energies outperformed classical approaches in QSPR modeling.
Quadratic regression showed the strongest correlations and lowest standard error.
Validation on Kaempferol demonstrated high predictive reliability (r=0.993).
Abstract
Alzheimer’s disease (AD) is a progressive neurodegenerative disorder for which U.S. Food and Drug Administration (FDA)-approved drugs provide only temporary symptomatic relief and often cause adverse effects. Plant-derived bioactive phytochemicals are emerging as promising alternatives due to their multi-targeted neuroprotective properties and reduced toxicity. In this article, herbal anti-Alzheimer’s compounds are analyzed using a novel graph molecular modeling. In chemical graph theory, molecular structures are represented as isomorphic molecular graphs GV,E , where V and E denote the set of vertices (atoms) and edges (chemical bonds) respectively. Classical graph matrices such as adjacency and Laplacian matrices capture the molecular connectivity but fail to account for hierarchical differences in atomic influence. To address this limitation, Roman domination is employed to…
Genes, proteins, chemicals, diseases, species, mutations and cell lines named across the full text — each resolved to its canonical identifier and authoritative record.
Click any figure to enlarge with its caption.
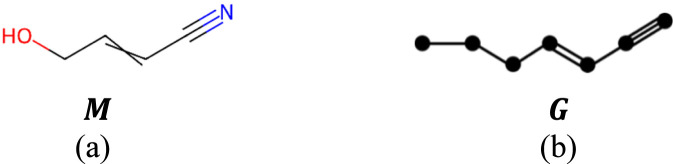 FIGURE 1
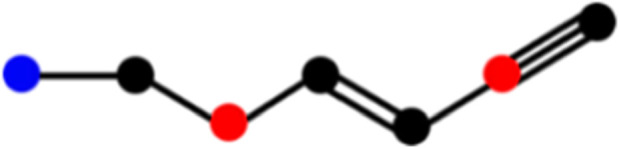 FIGURE 2
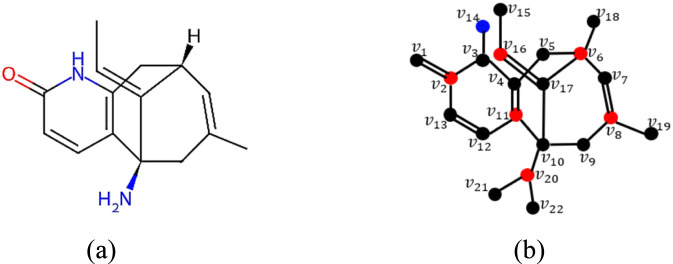 FIGURE 3
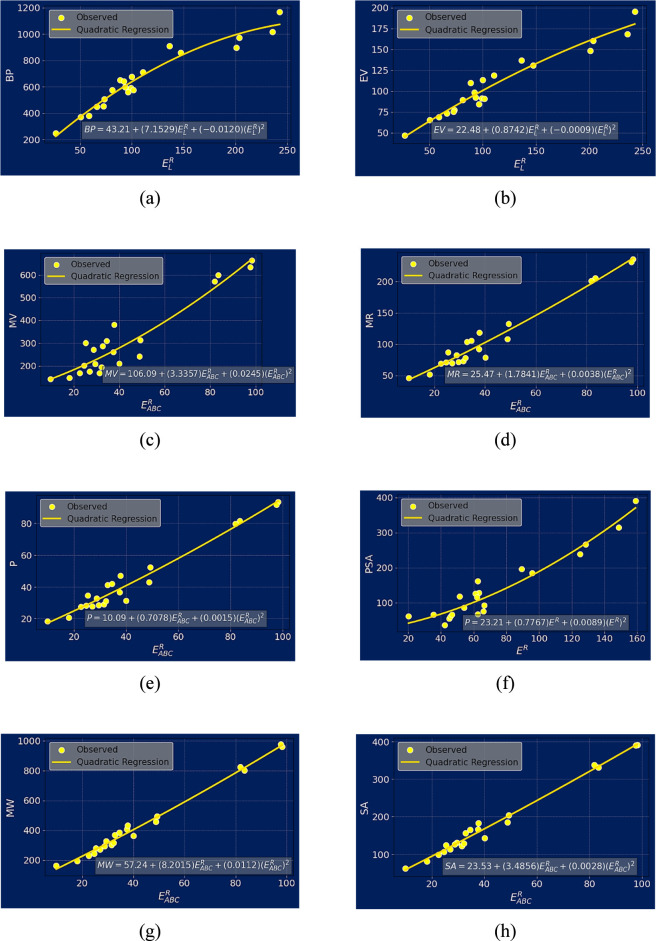 FIGURE 4
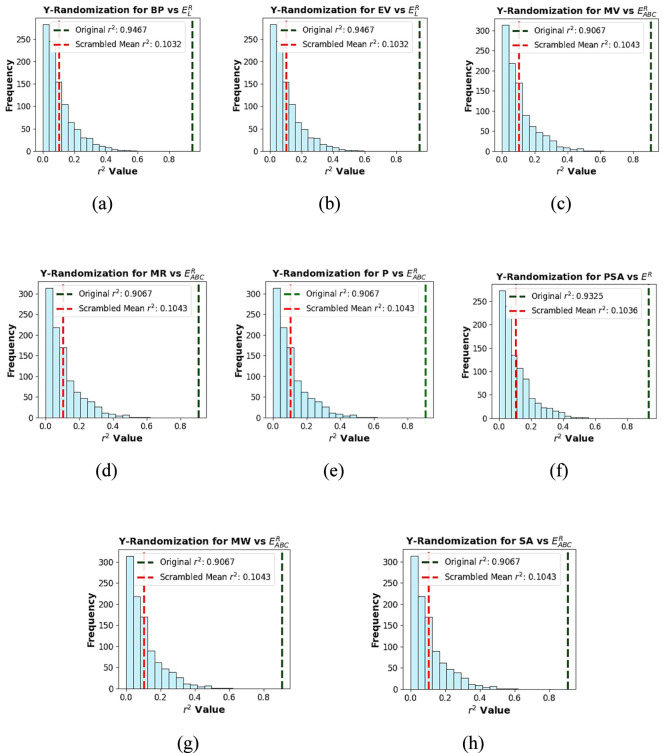 FIGURE 5
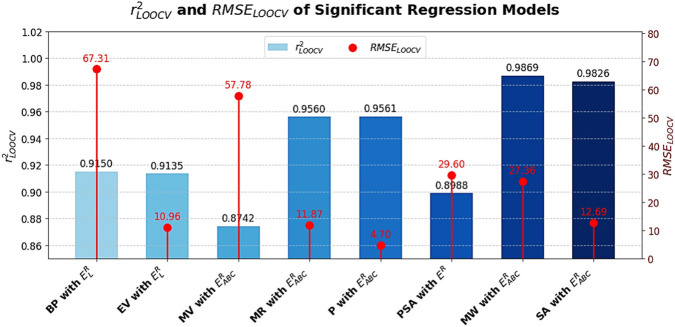 FIGURE 6
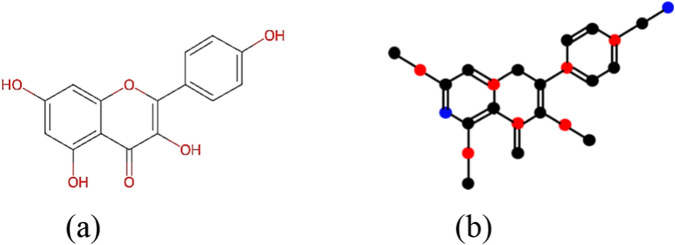 FIGURE 7
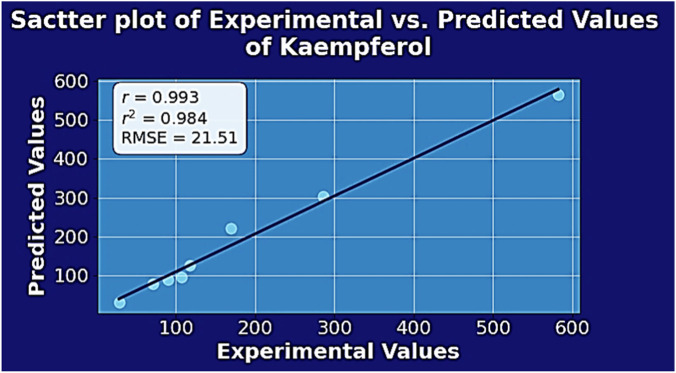 FIGURE 8
| S. no | Active compound | Source herb(s) | Biological activity |
|---|---|---|---|
| 1 | Huperzine A |
| Natural inhibitor of acetylcholinesterase |
| 2 | Curcumin |
| Anti-inflammatory, antioxidant, antitumor, antibacterial activities |
| 3 | Ginkgolide |
| Neuroprotection, reduces oxidative stress, improves cognition |
| 4 | Bilobalide |
| Enhances neuroplasticity, protects mitochondria |
| 5 | Ginsenoside Rg1 |
| Neuroprotective, physical stress reliever and stamina enhancer |
| 6 | Resveratrol |
| Antioxidant, anti-neuroinflammatory and mitigating memory-related impairments |
| 7 | Epigallocatechin-3-gallate |
| Antioxidant activity |
| 8 | Quercetin |
| Improves cognitive behavior |
| 9 | Baicalein |
| Prevents neuronal death and promotes neurotrophic support |
| 10 | Asiaticoside |
| Reduce oxidative stress levels and improves memory and learning |
| 11 | Catalpol |
| Anti-oxidation, anti-inflammatory and anti-apoptotic |
| 12 | Ferulic acid |
| Anti-amyloid, antioxidant, protects against memory loss |
| 13 | Salvianolic acid |
| Anti-oxidative and anti-apoptotic |
| 14 | Schisandrin |
| Enhances mitochondrial function and protects against neurotoxicity |
| 15 | Rhynchophylline |
| Prevents lipid peroxidation and reduce microglial activation |
| 16 | Glycyrrhizin |
| Improves spatial learning and memory-enhancing activities |
| 17 | γ-linolenic acid |
| Anti-inflammatory, reduces cellular toxicity |
| 18 | Crocin |
| Neuroprotective activity targeting tau protein and memory enhancement |
| 19 | Isorhamnetin |
| Reduces the neurotoxic effects |
| 20 | Allicin |
| Decreases psychological stress through regulation of stress hormones and the brain’s oxidative stress response |
| 21 | Gingerol |
| Neuroprotective and anti-inflammatory |
| Herbal compound |
|
|
|
|---|---|---|---|
| Huperzine A | 22 | 29 | 13 |
| Curcumin | 29 | 40 | 18 |
| Ginkgolide | 34 | 42 | 19 |
| Bilobalide | 27 | 33 | 16 |
| Ginsenoside Rg1 | 70 | 76 | 46 |
| Resveratrol | 20 | 28 | 12 |
| Epigallocatechin-3-gallate | 41 | 54 | 28 |
| Quercetin | 27 | 37 | 18 |
| Baicalein | 23 | 33 | 15 |
| Asiaticoside | 82 | 91 | 54 |
| Catalpol | 34 | 38 | 22 |
| Ferulic acid | 16 | 21 | 10 |
| Salvianolic acid | 43 | 59 | 28 |
| Schisandrin | 32 | 40 | 22 |
| Rhynchophylline | 29 | 40 | 20 |
| Glycyrrhizin | 69 | 80 | 44 |
| γ-linolenic acid | 21 | 24 | 14 |
| Crocin | 82 | 94 | 56 |
| Isorhamnetin | 27 | 37 | 19 |
| Allicin | 9 | 11 | 6 |
| Gingerol | 23 | 27 | 15 |
| Herbal compound |
|
|
|
|
|
|
|---|---|---|---|---|---|---|
| Huperzine A | 34.3620 | 55.3636 | 10.4966 | 9.5596 | 19.2852 | 25.2630 |
| Curcumin | 53.0028 | 77.2414 | 14.4753 | 13.9756 | 24.8656 | 35.9167 |
| Ginkgolide | 46.5167 | 81.5294 | 16.8219 | 15.3796 | 30.0210 | 38.7652 |
| Bilobalide | 37.1615 | 63.5556 | 13.1520 | 12.0350 | 23.3138 | 30.0474 |
| Ginsenoside Rg1 | 87.8368 | 149.8286 | 41.0031 | 38.0700 | 63.0826 | 81.5509 |
| Resveratrol | 37.3044 | 53.2000 | 10.2312 | 9.9217 | 17.4673 | 25.5644 |
| Epigallocatechin-3-gallate | 68.4969 | 105.3659 | 22.5321 | 21.6360 | 36.0824 | 51.6532 |
| Quercetin | 47.2727 | 71.2593 | 14.2992 | 13.7406 | 23.5320 | 34.0513 |
| Baicalein | 42.5686 | 63.1304 | 11.4464 | 11.0766 | 20.1446 | 29.4721 |
| Asiaticoside | 106.8511 | 179.7805 | 48.6417 | 45.7908 | 74.2672 | 98.9473 |
| Catalpol | 44.4298 | 73.7647 | 19.9855 | 18.8917 | 30.3737 | 40.9799 |
| Ferulic acid | 28.3786 | 39.3750 | 8.5181 | 8.1955 | 13.6748 | 19.6166 |
| Salvianolic acid | 74.4780 | 115.2558 | 22.0338 | 21.0245 | 36.9210 | 52.5710 |
| Schisandrin | 49.3070 | 77.5000 | 18.3323 | 17.3121 | 28.0568 | 39.0014 |
| Rhynchophylline | 49.4599 | 77.2414 | 14.1963 | 13.4832 | 26.2338 | 36.5573 |
| Glycyrrhizin | 95.7952 | 157.6812 | 39.0162 | 36.3389 | 62.7377 | 82.2327 |
| γ-linolenic acid | 31.9342 | 45.7143 | 11.8707 | 11.5934 | 18.1137 | 25.2894 |
| Crocin | 116.5436 | 185.7073 | 47.5990 | 45.5355 | 72.3650 | 99.6338 |
| Isorhamnetin | 47.2092 | 71.2593 | 14.2992 | 13.7405 | 23.5320 | 34.0513 |
| Allicin | 15.5348 | 19.5556 | 4.2109 | 4.1003 | 7.3426 | 10.0843 |
| Gingerol | 35.0696 | 51.6522 | 13.2455 | 12.7965 | 19.9166 | 27.9585 |
| Herbal compound |
|
|
|
|
|
|
|---|---|---|---|---|---|---|
| Huperzine A | 45.1296 | 73.3636 | 17.9872 | 17.4217 | 24.6301 | 29.7845 |
| Curcumin | 66.5497 | 99.2414 | 25.3791 | 25.0589 | 32.8265 | 41.7363 |
| Ginkgolide | 63.1427 | 110.5294 | 27.0789 | 26.2104 | 37.5207 | 45.2507 |
| Bilobalide | 51.4368 | 88.5556 | 21.6781 | 21.0097 | 29.4531 | 35.2526 |
| Ginsenoside Rg1 | 124.9425 | 200.8286 | 66.1705 | 64.4381 | 83.4936 | 99.4874 |
| Resveratrol | 45.7874 | 66.2000 | 17.4145 | 17.2161 | 22.6181 | 29.3747 |
| Epigallocatechin-3-gallate | 89.4491 | 136.3659 | 39.1147 | 38.4836 | 48.8531 | 61.3853 |
| Quercetin | 60.9440 | 92.2593 | 24.7818 | 24.4071 | 31.4479 | 40.0196 |
| Baicalein | 54.2303 | 81.1304 | 20.7828 | 20.5382 | 26.9751 | 34.4137 |
| Asiaticoside | 148.5861 | 235.7805 | 78.3375 | 76.6201 | 98.2212 | 119.4579 |
| Catalpol | 62.6139 | 99.7647 | 31.9158 | 31.2474 | 40.0326 | 48.9767 |
| Ferulic acid | 35.3938 | 50.3750 | 14.3872 | 14.1667 | 18.0653 | 22.8620 |
| Salvianolic acid | 95.6913 | 147.2558 | 38.2904 | 37.6784 | 49.2907 | 62.3634 |
| Schisandrin | 65.9585 | 101.5000 | 30.6399 | 30.0145 | 37.8126 | 46.8755 |
| Rhynchophylline | 62.4522 | 96.2414 | 25.4212 | 25.0059 | 34.5461 | 43.3004 |
| Glycyrrhizin | 128.4360 | 203.6812 | 63.4952 | 61.9284 | 81.8867 | 98.8384 |
| γ-linolenic acid | 42.2565 | 58.7143 | 20.9834 | 20.7757 | 25.3555 | 30.9798 |
| Crocin | 158.8990 | 242.7073 | 79.1212 | 77.8324 | 97.6712 | 120.1361 |
| Isorhamnetin | 61.9874 | 93.2593 | 25.6695 | 25.3129 | 32.2697 | 40.6842 |
| Allicin | 20.2234 | 26.5556 | 7.8267 | 7.7753 | 9.8808 | 12.0996 |
| Gingerol | 46.8662 | 72.6521 | 24.3623 | 24.0791 | 28.7168 | 34.9153 |
| Herbal compound |
|
|
|
|
|
|
|
|
|---|---|---|---|---|---|---|---|---|
| Huperzine A | 505.0 | 77.5 | 201.8 | 71.5 | 28.3 | 55 | 242.322 | 106.411 |
| Curcumin | 591.4 | 91.5 | 287.9 | 104.0 | 41.2 | 93 | 368.385 | 156.532 |
| Ginkgolide | 710.1 | 118.7 | 260.2 | 92.7 | 36.7 | 129 | 408.403 | 166.165 |
| Bilobalide | 651.7 | 110.0 | 208.6 |
| 28.5 | 119 | 326.301 | 131.239 |
| Ginsenoside Rg1 | 898.5 | 148.3 | 600.4 | 205.9 | 81.6 | 239 | 801.024 | 331.374 |
| Resveratrol | 449.1 | 73.5 | 167.9 | 69.3 | 27.5 | 61 | 228.247 | 98.911 |
| Epigallocatechin-3-gallate | 909.1 | 136.7 | 241.2 | 108.4 | 43.0 | 197 | 458.375 | 184.742 |
| Quercetin | 642.4 | 98.3 | 168.0 | 73.3 | 29.1 | 127 | 302.238 | 122.108 |
| Baicalein | 575.9 | 89.5 | 174.6 | 69.9 | 27.7 | 87 | 270.24 | 112.519 |
| Asiaticoside | 1017.5 | 168.3 | 664.2 | 236.2 | 93.6 | 315 | 959.133 | 391.529 |
| Catalpol | 675.6 | 113.5 | 209.8 | 79.2 | 31.4 | 162 | 362.331 | 142.355 |
| Ferulic acid | 372.3 | 65.3 | 147.5 | 52.3 | 20.7 | 67 | 194.186 | 81.065 |
| Salvianolic acid | 858.7 | 130.7 | 312.9 | 132.5 | 52.5 | 185 | 494.452 | 204.082 |
| Schisandrin | 576.7 | 90.8 | 381.0 | 118.6 | 47.0 | 76 | 432.513 | 183.337 |
| Rhynchophylline | 560.8 | 84.3 | 310.2 | 105.6 | 41.9 | 68 | 384.476 | 165.423 |
| Glycyrrhizin | 971.4 | 160.4 | 572.6 | 201.4 | 79.8 | 267 | 822.942 | 337.426 |
| γ-linolenic acid | 379.5 | 68.9 | 301.1 | 87.2 | 34.6 | 37 | 278.436 | 123.830 |
| Crocin | 1169.0 | 195.2 | 634.3 | 231.3 | 91.7 | 391 | 976.972 | 389.932 |
| Isorhamnetin | 599.4 | 92.5 | 193.5 | 78.1 | 31.0 | 116 | 316.265 | 128.792 |
| Allicin | 248.6 | 46.6 | 141.2 | 46.2 | 18.3 | 62 | 162.279 | 62.082 |
| Gingerol | 453.0 | 75.1 | 271.7 | 82.9 | 32.9 | 67 | 294.391 | 126.309 |
| Energy | Regression |
|
|
|
|
|
|
|
|
|---|---|---|---|---|---|---|---|---|---|
|
| Linear | 0.950 | 0.953 | 0.900 | 0.962 | 0.962 | 0.946 | 0.973 | 0.971 |
| Quadratic | 0.960 | 0.953 | 0.912 | 0.967 | 0.967 | 0.960 | 0.979 | 0.975 | |
| Cubic | 0.962 | 0.955 | 0.914 | 0.970 | 0.970 | 0.960 | 0.980 | 0.976 | |
|
| Linear | 0.950 | 0.959 | 0.915 | 0.971 | 0.971 | 0.954 | 0.984 | 0.981 |
| Quadratic | 0.966 | 0.962 | 0.925 | 0.975 | 0.975 | 0.962 | 0.988 | 0.984 | |
| Cubic | 0.968 | 0.963 | 0.927 | 0.976 | 0.976 | 0.962 | 0.988 | 0.984 | |
|
| Linear | 0.956 | 0.963 | 0.913 | 0.969 | 0.969 | 0.949 | 0.984 | 0.981 |
| Quadratic | 0.970 | 0.965 | 0.930 | 0.977 | 0.977 | 0.960 | 0.990 | 0.987 | |
| Cubic | 0.971 | 0.966 | 0.930 | 0.977 | 0.977 | 0.960 | 0.991 | 0.987 | |
|
| Linear | 0.957 | 0.967 | 0.916 | 0.969 | 0.969 | 0.952 | 0.986 | 0.983 |
| Quadratic | 0.973 | 0.971 | 0.933 | 0.977 | 0.977 | 0.961 | 0.992 | 0.989 | |
| Cubic | 0.974 | 0.971 | 0.933 | 0.977 | 0.977 | 0.961 | 0.993 | 0.989 | |
|
| Linear | 0.907 | 0.935 | 0.945 | 0.978 | 0.978 | 0.945 | 0.992 | 0.990 |
| Quadratic | 0.941 | 0.949 | 0.947 | 0.978 | 0.978 | 0.945 | 0.992 | 0.990 | |
| Cubic | 0.944 | 0.951 | 0.948 | 0.978 | 0.978 | 0.945 | 0.992 | 0.990 | |
|
| Linear | 0.913 | 0.937 | 0.945 | 0.980 | 0.980 | 0.947 | 0.992 | 0.990 |
| Quadratic | 0.941 | 0.949 | 0.947 | 0.980 | 0.981 | 0.948 | 0.993 | 0.990 | |
| Cubic | 0.944 | 0.951 | 0.948 | 0.981 | 0.981 | 0.948 | 0.993 | 0.990 | |
|
| Linear | 0.907 | 0.935 | 0.944 | 0.978 | 0.978 | 0.948 | 0.992 | 0.989 |
| Quadratic | 0.939 | 0.948 | 0.946 | 0.978 | 0.978 | 0.948 | 0.992 | 0.989 | |
| Cubic | 0.943 | 0.950 | 0.947 | 0.978 | 0.978 | 0.948 | 0.992 | 0.989 | |
|
| Linear | 0.913 | 0.937 | 0.945 | 0.980 | 0.980 | 0.948 | 0.992 | 0.990 |
| Quadratic | 0.940 | 0.948 | 0.946 | 0.980 | 0.980 | 0.949 | 0.992 | 0.990 | |
| Cubic | 0.943 | 0.950 | 0.947 | 0.981 | 0.981 | 0.949 | 0.992 | 0.990 | |
|
| Linear | 0.921 | 0.944 | 0.942 | 0.979 | 0.979 | 0.945 | 0.994 | 0.992 |
| Quadratic | 0.952 | 0.958 | 0.947 | 0.981 | 0.981 | 0.946 | 0.995 | 0.993 | |
| Cubic | 0.954 | 0.959 | 0.948 | 0.981 | 0.981 | 0.946 | 0.995 | 0.993 | |
|
| Linear | 0.921 | 0.944 | 0.945 | 0.981 | 0.981 | 0.947 | 0.995 | 0.993 |
| Quadratic | 0.952 | 0.958 | 0.948 | 0.982 | 0.982 | 0.948 | 0.995 | 0.993 | |
| Cubic | 0.954 | 0.959 | 0.948 | 0.982 | 0.982 | 0.948 | 0.995 | 0.993 | |
|
| Linear | 0.927 | 0.947 | 0.935 | 0.979 | 0.979 | 0.950 | 0.993 | 0.991 |
| Quadratic | 0.955 | 0.958 | 0.940 | 0.980 | 0.980 | 0.952 | 0.994 | 0.991 | |
| Cubic | 0.956 | 0.959 | 0.941 | 0.981 | 0.981 | 0.952 | 0.994 | 0.991 | |
|
| Linear | 0.927 | 0.947 | 0.939 | 0.980 | 0.980 | 0.950 | 0.994 | 0.992 |
| Quadratic | 0.955 | 0.958 | 0.944 | 0.981 | 0.981 | 0.952 | 0.994 | 0.992 | |
| Cubic | 0.956 | 0.959 | 0.944 | 0.982 | 0.982 | 0.952 | 0.995 | 0.992 |
| Property | Quadratic regression equation |
|
|
|
|
|---|---|---|---|---|---|
|
|
| 0.973 | 0.947 | 57.568 | 0.000 |
|
|
| 0.971 | 0.943 | 9.651 | 0.000 |
|
|
| 0.948 | 0.899 | 55.934 | 0.000 |
|
|
| 0.982 | 0.964 | 11.555 | 0.000 |
|
|
| 0.982 | 0.964 | 4.576 | 0.000 |
|
|
| 0.962 | 0.926 | 27.258 | 0.000 |
|
|
| 0.995 | 0.990 | 25.491 | 0.000 |
|
|
| 0.993 | 0.986 | 12.369 | 0.000 |
Peer Reviews
No public reviews on file for this paper yet. If you reviewed it on a platform where reviews are public (OpenReview, ICLR, NeurIPS, ICML), you can paste yours below so the community can read it here.
Videos
No videos yet. Explain this paper in a talk, walkthrough, or lecture? Add one.
Taxonomy
TopicsComputational Drug Discovery Methods · Cholinesterase and Neurodegenerative Diseases · Graph theory and applications
Introduction
1
Alzheimer’s disease (AD) is a progressive neurodegenerative disorder. It is the most common form of dementia in aged people and is characterized by the accumulation of abnormal protein deposits in the brain, particularly beta-amyloid plaques and misfolded tau (Bruno et al., 2023). These pathological changes lead to the degeneration of brain cells, disrupting communication between neurons and causing cognitive decline. This severe brain ailment disrupts memory, thinking and daily functioning, resembling a puzzle where pieces of one’s memory and abilities slowly go missing over time. Although there is no cure for Alzheimer’s, scientists have developed some U.S. Food and Drug Administration (FDA)-approved drugs to assist in managing its symptoms. These medications (Alhazmi and Albratty, 2022; Grossberg et al., 2019), including atypical antipsychotic (Brexpiprazole), acetylcholinesterase inhibitors (Donepezil, Galantamine and Rivastigmine) and Glutamate inhibitor (Memantine) are designed to provide temporary relief from the cognitive issues associated with Alzheimer’s, such as memory loss and confusion.
Motivated by the limitations of these synthetic drugs, which provide only temporary symptomatic relief and are often associated with adverse effects (D'Souza et al., 2024), plant-derived bioactive phytochemicals are considered as promising alternatives due to their multi-targeted neuroprotective properties and reduced toxicity. Such natural compounds are believed to modulate key pathological pathways in AD with comparatively fewer side effects, making them valuable candidates for safer, long-term interventions (Yuan et al., 2019). In this context, a total of 21 plant-derived bioactive phytochemicals (Alhazmi and Albratty, 2022; Alsenani, 2024; Soni et al., 2024) has been examined for their therapeutic potential against Alzheimer’s disease. These include Huperzine A, Curcumin, Ginkgolide, Bilobalide, Ginsenoside Rg1, Resveratrol, Epigallocatechin-3-gallate, Quercetin, Baicalein, Asiaticoside, Catalpol, Ferulic acid, Salvianolic acid, Schisandrin, Rhynchophylline, Glycyrrhizin, γ-Linolenic acid, Crocin, Isorhamnetin, Allicin and Gingerol. These compounds, extracted from diverse herbal sources, exhibits one or more neuroprotective activities such as acetylcholinesterase inhibition, antioxidant, anti-inflammatory action, mitochondrial protection and amyloid-β modulation. A detailed summary of each phytochemical compound’s chemical formula, source herb, and anti-Alzheimer’s biological activity is provided in Table 1. These phytoconstituents form the basis for further Quantitative Structure-Property Relationship (QSPR) analysis using graph-theoretic descriptors, aimed at modeling and predicting their anti-Alzheimer’s potential with high reliability. The QSPR analysis based on various graph descriptors has been extensively discussed in the literature (Kalaimathi and Balamurugan, 2023; Kara et al., 2025a; Kara et al., 2025b; Kirana et al., 2024; Parveen et al., 2024; Rani and Balamurugan, 2025; Rauf et al., 2024; Raza and Munir, 2024; Tamilarasi and Balamurugan, 2025; Wazzan and Ozalan, 2023; Yogalakshmi and Balamurugan, 2025). Several studies have specifically addressed Alzheimer’s disease-related QSPR modeling. In this context, Ahmed et al. has developed QSPR regression models using degree-based (Ahmed et al., 2024) and eccentricity-based (Ahmed et al., 2025a) topological descriptors to find the physicochemical properties of anti-Alzheimer’s drugs. Moreover, they applied Artificial Neural Network and Random Forest approaches to further enhance predictive performance (Ahmed et al., 2025b).
The field of chemical graph theory offers a powerful approach for understanding molecular structures and their implications in drug development. In this context, molecular graph serves as visual blueprint, where represents the set of atoms (vertices) and represents the set of chemical bonds (edges), respectively (Gutman and Polansky, 2012; Trinajstic, 1992). Two atoms are said to be adjacent if they share a bond, in which case each is called a neighbor of the other. For any atom , the open neighborhood consists of all atoms adjacent to , while the closed neighborhood includes itself along with its open neighborhood. The degree of an atom , written ), is the number of bonds incident to . Generally, in molecular graphs, double and triple bonds are represented as single edges, which does not affect distance-based graph theoretic metrics but does influence other metrics such as vertex degree. To address this issue, Tamilarasi and Balamurugan (2024) introduced the Isomorphic Molecular Graph, where the bond multiplicity is preserved, that is, single edge for single bond and multiple edges for double and triple bonds. Such graph representations allow molecular structures to be numerically characterized using graph energy (Gutman, 1978), a key spectral descriptor. Graph energy is the sum of the absolute values of the eigenvalues of the adjacency matrix of the graph and it serves as a spectral invariant that reflects the compound’s structural properties. Originating from Hückel molecular orbital (HMO) theory (Gutman, 1977) in quantum chemistry, where it was initially used to approximate the total π-electron energy of conjugated hydrocarbons, graph energy has evolved into a powerful tool in chemical graph theory.
Traditionally, the structural representation of molecular graphs relies on the standard adjacency matrix (Bapat, 2014), a square matrix, in which each element is 1 if there exists an edge between vertex and vertex , and 0 otherwise. For multigraphs, where multiple edges can exist between a pair of vertices as in the case of isomorphic molecular graphs, the adjacency matrix is extended such that represents the number of edges connecting vertex and vertex , denoted by . While this classical matrix captures structural connectivity, it fails to reflect dominance relationships among the atoms (vertices) in a molecular system. To incorporate this additional layer of information, a Roman domination-based adjacency matrix is proposed, integrating from the concept of Roman domination in graph theory. The concept of Roman domination was introduced by E. J. Cockayne et al. (Cockayne et al., 2004) and it models strategic resource allocation, originally inspired by the defense strategies of the Roman Empire (Henning et al., 2003; ReVelle and Rosing, 2000; Steward, 1999). Roman domination is a graph-theoretic concept that models optimal defense allocation by labeling the vertices with values 0, 1 or 2 such that every vertex labeled 0 is adjacent to at least one vertex labeled 2. A mapping that assigns such labels to the vertices is called a Roman dominating function (RDF). The weight of an RDF is defined as the sum of all vertex labels, and the minimum possible weight over all RDFs is called the Roman domination number, denoted by . Throughout this article, only the Roman dominating function that attains minimum weight is considered for all the isomorphic molecular graphs.
Building on this idea, Roman domination-based adjacency matrix is introduced in this paper, which not only retains the structural information of the isomorphic molecular graph but also embeds vertex importance based on the Roman domination function. Consequently, the Roman domination-based graph energy (simply referred to as Roman energy), computed from the eigenvalues of , serves as a novel spectral descriptor that captures both connectivity and strategic dominance within the molecular structure. Like graph energy reformulated as Roman energy, other spectral descriptors such as Laplacian energy (Gutman and Zhou, 2006), Randić energy (Bozkurt et al., 2010), Harmonic energy (Hosamani et al., 2017), Atom-Bond Connectivity energy (Prakasha et al., 2024), and Geometric-Arithmetic energy (Hosamani et al., 2017) are also redefined in this study by modifying classical matrix formulations to incorporate Roman domination function values. Roman domination-based graph matrices, namely the Roman Laplacian matrix, Roman Randić matrix, Roman Harmonic matrix, Roman ABC matrix, and Roman Geometric-Arithmetic matrix are introduced along with their corresponding Roman energies. These extended formulations offer deeper insights into molecular topology by integrating both structural and functional aspects of isomorphic molecular graphs.
Motivated by the well-recognized limitations of synthetic drugs, this work benchmarks novel Roman energy descriptors against classical graph energies to demonstrate their superior predictive performance within the herbal compound-based QSPR framework, thereby addressing an existing research gap in Alzheimer’s disease-related QSPR modeling. In this research, the Roman domination number, six classical graph energies and six newly developed Roman energies are computed for 21 anti-Alzheimer’s herbal compounds. QSPR analysis is performed using linear, quadratic and cubic regression models to investigate the relationships between the computed graph energies and physicochemical properties, namely boiling point, enthalpy of vaporization, molar volume, molar refraction, polarizability, polar surface area, molecular weight and surface area. The results demonstrate strong correlations across all metrics using the three regression models. However, the quadratic regression models based on Roman energies show particularly high correlation coefficients accompanied by minimal standard error, indicating their superior predictive performance. The robustness of these significant models is assessed through internal validation methods, including Y-randomization and leave-one-out cross-validation (LOOCV). The best performing models were externally validated by predicting the physicochemical properties of Kaempferol, a phytochemical compound derived from Corylus avellana, known to enhance cognitive function, lower anxiety, and mitigate neuroinflammatory and programmed cell death processes in the nervous system (Alsenani, 2024). The prediction yields a high correlation ( ) and minimal root mean squared error ( ) between the experimental and predicted values of Kaempferol’s physicochemical properties, confirming the model’s external reliability. These findings underscore the versatility of the proposed Roman domination-based graph energies, paving the way for their broader application in molecular property prediction, structural analysis and quantitative modeling. Future research may explore their integration into other domains such as materials informatics and complex network analysis, thereby enhancing their utility in theoretical chemistry and computational sciences.
Motivation
2
Classical graph matrices such as adjacency and Laplacian matrices, have long been used to represent molecular connectivity, providing a mathematical model for analyzing the structural features of molecules. However, these matrices fail to reflect the varying levels of influence or dominance that certain atoms exert within a molecular structure. While the domination matrices partially address this limitation by identifying the dominated atoms, they still overlook the hierarchical differences in atomic influence. In contrast, the Roman domination function captures an additional layer of information of hierarchical dominance among atoms, where the atoms with RDF value 2 strongly dominate the atoms with RDF value 0, while the atoms with RDF value 1 are self-dominating and are neither dominated by their neighbors nor required to dominate neighboring atoms. Thus, the Roman domination offers a natural way to incorporate functional importance into isomorphic molecular graphs. Motivated by this concept, the present work introduces the Roman domination-based graph energies, which extend the classical graph matrices including the adjacency, Laplacian, Randić, Harmonic, Atom-bond connectivity, and Geometric-arithmetic matrices, by integrating the Roman domination function (RDF) values. These enhanced spectral descriptors are designed to capture both connectivity and dominance-based information simultaneously, offering richer and more informative molecular representations. Ultimately, this approach provides a powerful tool for chemical graphs and molecular modeling, with potential applications in drug design, QSPR/QSAR analysis, and other pharmaceutical research areas where understanding both the structural and functional importance is critical.
Concepts and terminologies
3
This section presents the fundamental definitions essential to this research work.
Definition 3.1 (Tamilarasi and Balamurugan, 2024)
Let be the chemical structure of a molecule. An isomorphic molecular graph of is a graph in which denotes the set of atoms (vertices) which includes the backbone carbon atoms and heteroatoms, along with the polar hydrogens and hydrogen atoms responsible for stereoisomerism and denotes the set of chemical bonds (edges) with bond multiplicity preserved; that is, a single edge represents a single bond, two parallel edges represent a double bond and three parallel edges represent a triple bond.
An example of isomorphic molecular graph of 4-Hydroxy-2-butenenitrile is shown in Figure 1.
(a) Chemical structure and (b) isomorphic molecular graph of 4-Hydroxy-2-butenenitrile.
Definition 3.2 (Cockayne et al., 2004)
Let be an isomorphic molecular graph. The Roman dominating function (RDF) on a is a mapping that satisfies the condition that every atom (vertex) with has at least one neighbor such that . The weight of is defined by . The Roman domination number of , denoted by , is the minimum weight among all RDFs on . An RDF can equivalently be represented as an ordered partition of , that is, , where . In this notation, the weight of can be expressed as .
Figure 2 presents an example of Roman domination on the isomorphic molecular graph of 4-Hydroxy-2-butenenitrile , where vertices with RDF values of 2, 1 and 0 are represented by red, blue and black colors respectively.
Roman domination of isomorphic molecular graph of 4-Hydroxy-2-butenenitrile (RDF: 2 = red, 1 = blue, 0 = black).
Definition 3.3 (Gutman and Polansky, 2012)
For an isomorphic molecular graph , the adjacency matrix is a matrix, in which each element is given by
where is the total number of vertices of and is the number of bonds between the vertices and .
Definition 3.4 (Gutman, 1978)
Let be an isomorphic molecular graph with adjacency matrix of order . Let be the eigenvalues of . The graph energy of is defined as the sum of the absolute values of the eigenvalues of and it is denoted by .That is,
Definition 3.5 (Gutman and Zhou, 2006)
Let be an isomorphic molecular graph. The Laplacian matrix of , denoted by , is a matrix, where each element is given by
where is the number of bonds incident with vertex and is the -entry of the adjacency matrix.
Definition 3.6 (Gutman and Zhou, 2006)
Laplacian energy of an isomorphic molecular graph is given by
where is the number of vertices, is the number of edges and denotes the eigenvalues of the Laplacian matrix.
Definition 3.7 (Bozkurt et al., 2010)
Let be an isomorphic molecular graph. The Randić matrix of , denoted by , is a matrix defined by
Definition 3.8 (Bozkurt et al., 2010)
Randić energy of an isomorphic molecular graph is given by
where denotes the eigenvalues of the Randić matrix.
Definition 3.9 (Hosamani et al., 2017)
Let be an isomorphic molecular graph. The Harmonic matrix of , denoted by , is a matrix defined by
Definition 3.10 (Hosamani et al., 2017)
Harmonic energy of an isomorphic molecular graph is given by
where denotes the eigenvalues of the Harmonic matrix.
Definition 3.11 (Prakasha et al., 2024)
Let be an isomorphic molecular graph. The Atom-bond connectivity matrix of , denoted by , is a matrix defined by
Definition 3.12 (Prakasha et al., 2024)
Atom-bond connectivity energy of an isomorphic molecular graph is given by
where denotes the eigenvalues of the Atom-bond connectivity matrix.
Definition 3.13 (Hosamani et al., 2017)
Let be an isomorphic molecular graph. The Geometric-Arithmetic matrix of , denoted by , is a matrix defined by
Definition 3.14 (Hosamani et al., 2017)
Geometric-Arithmetic energy of an isomorphic molecular graph is given by
where denotes the eigenvalues of the Geometric-Arithmetic matrix.
Roman domination-based graph energies
4
This section introduces several novel Roman domination-based matrices and their corresponding graph energy measures.
Definition 4.1
Let be an isomorphic molecular graph. Then the roman domination-based adjacency matrix is a matrix, in which each element is defined as
where is the RDF of .
Definition 4.2
Let be an isomorphic molecular graph with Roman domination-based adjacency matrix of order . Let be the eigenvalues of . The Roman energy of is defined as the sum of the absolute values of the eigenvalues of . That is,
Definition 4.3
Let be an isomorphic molecular graph. The Roman Laplacian matrix of , denoted by , is a matrix defined as
where is the number of bonds incident with vertex and is the -entry of the Roman domination-based adjacency matrix.
Definition 4.4
Roman Laplacian energy of an isomorphic molecular graph is defined as
where denotes the eigenvalues of the Roman Laplacian matrix.
Definition 4.5
Let be an isomorphic molecular graph. The Roman Randić matrix of , denoted by , is a matrix defined as
Definition 4.6
Roman Randić energy of an isomorphic molecular graph is defined as
where denotes the eigenvalues of the Roman Randić matrix.
Definition 4.7
Let be an isomorphic molecular graph. The Roman Harmonic matrix of , denoted by , is a matrix defined as
Definition 4.8
Roman Harmonic energy of an isomorphic molecular graph is defined as
where denotes the eigenvalues of the Roman Harmonic matrix.
Definition 4.9
Let be an isomorphic molecular graph. The Roman Atom-bond connectivity matrix of , denoted by , is a matrix defined by
Definition 4.10
Roman Atom-bond connectivity energy of an isomorphic molecular graph is given by
where denotes the eigenvalues of the Roman Atom-bond connectivity matrix.
Definition 4.11
Let be an isomorphic molecular graph. The Roman Geometric-Arithmetic matrix of , denoted by , is a matrix defined as
Definition 4.12
Roman Geometric-Arithmetic energy of an isomorphic molecular graph is defined as
where denotes the eigenvalues of the Roman Geometric-Arithmetic matrix.
Methodology
5
A structured methodology was adopted to investigate the physicochemical properties of herbal anti-Alzheimer’s phytochemicals through Quantitative Structure-Property Relationship (QSPR) graph modeling, utilizing both classical and Roman graph energies derived from the isomorphic molecular graphs of the compounds. The methodology comprises the following steps:
- Data Acquisition and Construction of Isomorphic Molecular Graph
Potential anti-Alzheimer’s phytochemicals were selected based on their reported neuroprotective efficacy. The molecular structures of these compounds were retrieved from the publicly accessible PubChem database (https://pubchem.ncbi.nlm.nih.gov). Each compound was subsequently represented as an isomorphic molecular graph, where atoms and chemical bonds correspond to vertices and edges respectively.
- 2. Computation of Classical and Roman Graph Energies
Classical graph energies including, Laplacian, Randic, Harmonic, ABC, and Geometric-Arithmetic energies, and Roman graph energies including Roman Laplacian, Roman Randic, Roman Harmonic, Roman ABC, and Roman Geometric-Arithmetic energies were computed for the constructed isomorphic molecular graphs using theoretical formulations and Python programming. NumPy and SciPy were the python libraries utilized in the computations.
- 3. QSPR Analysis
QSPR analysis was conducted to examine the relationship between the computed graph energies and the physicochemical properties of the anti-Alzheimer’s compounds using linear, quadratic and cubic regression models. The models were developed with the Statistical Package for the Social Sciences (SPSS) software, enabling quantitative evaluation of model strength and statistical significance.
- 4. Statistical Evaluation and Model Validation
The predictive performance of the computed graph energies was assessed through multiple statistical measures, including:
- Correlation coefficient ( ): Indicates the degree of association between predicted and observed values.
- Significance tests ( ): Ensures the statistical validity of the correlations.
- Standard error values ( ): Evaluates model accuracy and precision.
- Y-randomization test: Verifies that the observed correlations are not due to random chance.
- Leave-One-Out Cross Validation (LOOCV): Tests the internal stability and reliability of the model.
- External validation through relative error analysis: Confirms external predictive performance on unseen data.
The Roman graph energies demonstrating the highest predictive accuracy and statistical significance were identified as key molecular descriptors, providing a reliable and interpretable model for understanding the structural and physicochemical behavior of anti-Alzheimer’s phytochemicals.
Computation of classical and Roman energies of anti-Alzheimer’s herbal compounds
6
The Roman graph energies defined in Section 4 provide a mathematical basis for quantifying both the structural connectivity and the strategic atom importance within isomorphic molecular graphs. In particular, the integration of the Roman domination function into classical and spectral matrices enables the resulting energies to capture not only bond multiplicity and degree-based relationships but also hierarchical dominance patterns among atoms. In this section, the Roman domination number ( ), classical graph energies ( and ) and Roman energies ( and ) are computed for 21 anti-Alzheimer’s herbal compounds.
Theorem 1
Let be the isomorphic molecular graph of the herbal compound Huperzine A with the atom set and bond set . Then the graph energies of are given by and .
Proof:
Let be the isomorphic molecular graph of the herbal compound Huperzine A with and . The chemical structure and its corresponding isomorphic molecular graph of Huperzine A are depicted in Figure 3. Let the atoms of be denoted as , as shown in Figure 3b.
(a) Chemical structure and (b) Roman domination of isomorphic molecular graph of Huperzine A.
The adjacency matrix of is obtained as
The characteristic equation of is , where is the unit matrix of order 22. That is,
Now, the eigenvalues of are computed as −3.22168250, 3.22168250, −2.86380483, 2.86380483, −2.42094968, −2.25231345, −1.88326844, −1.76307891, 2.42094968, 2.25231345, 1.88326844, 1.76307891, −1.31844167, −0.851087705, −0.606369954, 1.31844167, 0.851087705, 0.606369954, (−9.45023434 × 10^−18^ + 2.17207266 × 10^−17^i), (−9.45023434 × 10^−18^−2.17207266 × 10^−17^i), 1.68243416 × 10^−33^ and −1.78615903 × 10^−39^.
Hence, the graph energy of is
Similarly, the Laplacian matrix of is obtained as
The characteristic equation of is , where is the unit matrix of order 22. That is,
The eigenvalues of are 6.88478479, 6.35915857, 5.87817418, 5.75183678, 5.05688787, 4.78859112, 4.28246298, 3.39370494, 3.07416394, 2.44193559, 1.88110879, 1.77487523, 1.34213456, 1.22273060, 4.35941921 × 10^−16^, 0.895980521, 0.151978808, 0.234847803, 0.643389696, 0.589366431, 0.351886823 and 1.
The corresponding Laplacian energy is
The Randić matrix of is obtained as
The characteristic equation of is , where is the unit matrix of order 22. That is,
The eigenvalues of are −0.908485608, −0.815451090, −0.753219975, −0.664961047, −0.621203066, −0.506456697, −0.443479161, −0.312720323, −0.222332197, 0.908485608, 0.815451090, 0.753219975, 0.664961047, 0.621203066, 0.222332197, 0.312720323, 0.506456697, 0.443479161, −1.54074396 × 10^−33^, −2.19952161 × 10^−17^, 3.52858770 × 10^−19^ and 0
The corresponding Randić energy is
Similarly, the harmonic matrix of is obtained as
The characteristic equation of is , where is the unit matrix of order 22. That is,
The eigenvalues of are −0.832107140, −0.743531733, −0.690959869, −0.586425446, −0.547457484, −0.420175763, −0.476460052, −0.282647751, −0.200011284, 0.832107140, 0.743531733, 0.690959869, 0.200011284, 0.282647751, 0.586425446, 0.547457484, 0.420175763, 0.476460052, −3.08148791 × 10^−33^, −1.82891110 × 10^−17^, 2.16449571 × 10^−18^ and 5.34552942 × 10^−51^.
Hence, the harmonic energy is
Atom-bond connectivity matrix of is obtained as
The characteristic equation of is , where is the unit matrix of order 22. That is,
The eigenvalues of are −1.77925631, 1.77925631, −1.47585081, −1.39622420, −1.22175204, −1.02184588, −0.955125701, −0.871067683, −0.557427565, −0.364029180, 1.47585081, 1.39622420, 1.22175204, 1.02184588, 0.955125701, 0.871067683, 0.557427565, 0.364029180, 7.81189684 × 10^−19^, 7.81189684 × 10^−19^, −9.94883540 × 10^−35^ and 0.
Thus, the Atom-bond connectivity energy is
Geometric-Arithmetic matrix is obtained as
The characteristic equation of is , where is the unit matrix of order 22. That is,
The eigenvalues of are −2.57896966, 2.57896966, −2.09810363, 2.09810363, −1.79736577, −1.50651896, −1.35457707, −1.23112119, −1.06060488, 1.79736577, −0.620997295, −0.383241265, 1.50651896, 1.35457707, 1.23112119, 1.06060488, 0.620997295, 0.383241265, 6.16297582 × 10^−33^, −8.09568750 × 10^−17^, 3.63638806 × 10^−17^ and 0.
The corresponding Geometric-Arithmetic energy is
Hence the proof.
Theorem 2
Let be the isomorphic molecular graph of the compound Huperzine A with the atom set and bond set . Then the Roman domination number and the Roman energies of are given by and .
Proof:
Consider the isomorphic molecular graph of the compound Huperzine A, where the atoms are labelled as depicted in Figure 3b. In the same figure, the atoms are colored red, blue and black to indicate Roman domination function (RDF) values of 2, 1 and 0 respectively.
Since the maximum degree in is 4, an RDF value of 2 is first assigned to the atoms with degree 4. Assigning dominates and . Furthermore, assigning ensures domination of all the remaining undominated vertices except , which is assigned . Hence, the vertices in receive the RDF value 0.
Thus, the weight of is
Therefore, .
Now, the Roman domination-based adjacency matrix is obtained as
The characteristic equation of is , where is the unit matrix of order 22. That is,
Now, the eigenvalues of are 5.00197952, 4.65503255, 4.24336745, 4.11235793, 3.54682450, 3.12725603, −3.33264201, 1.92083543, 1.38241044, −2.89119702, 0.903825166, −2.27140484, −2.02129249, −1.64560765, −1.85525292, −1.10685842, −0.641833443, −0.298729731, 0.170929512, −4.98562614 × 10^−17^, −1.43437281 × 10^−16^ and 7.70371978 × 10^−34^.
Hence, the Roman energy is
Similarly, the Roman Laplacian matrix is obtained as
The characteristic equation of is , where is the unit matrix of order 22. That is,
The eigenvalues of are 8.71188669, 7.90287273, 7.46619932, 7.00646362, 6.47066545, 5.78247993, 5.08008995, −1.66284304 × 10^−15^, 0.179634985, 0.312968381, 0.526054399, 0.816748345, 0.929690725, 1.16174888, 4.17886192, 3.82914814, 3.49859993, 2.90766712, 2.69306926, 2.20458601, 2.34056421 and 2.00000000.
Hence, the Roman Laplacian energy is
The Roman Randić matrix is obtained as
The characteristic equation of is , where is the unit matrix of order 22. That is,
The eigenvalues of are 2.32896489, 2.26621949, 2.09484018, 2.14641802, 2.16685294, 2.19908915, 1.25973871, 0.395646561, 0.359895558, 0.275951838, −0.567070822, −0.509522386, −0.368296016, −0.050779806, −0.285816933, −0.242892081, −0.117375768, −0.156443512, −0.195420025, 1.00643910 × 10^−16^, −3.65220210 × 10^−17^ and −1.33684158 × 10^−48^
Thus, the Roman Randić energy is
Similarly, the Roman Harmonic matrix is obtained as
The characteristic equation of is , where is the unit matrix of order 22. That is,
The eigenvalues of are 2.26621801, 2.22317239, 2.09184158, 2.13731344, 2.12511292, 2.15826628, 1.20486131, 0.381006799, 0.350094262, 0.272946948, −0.534739512, −0.480749173, −0.365871874, −0.0423106343, −0.225119620, −0.196839452, −0.0852716745, −0.123089003, −0.156843002, −6.54760926 × 10^−17^, 7.03301636 × 10^−17^ and 0.
Hence, the Roman Harmonic energy is
The Roman Atom-bond connectivity matrix is obtained as
The characteristic equation of is , where is the unit matrix of order 22. That is,
The eigenvalues of are 2.90381715, 2.71556661, 2.60127176, 2.57429276, 2.39331410, 2.38708605, 1.45335523, −1.33310272, 0.761775276, 0.658711836, 0.365875884, −1.13409826, −0.832854551, −0.133135441, −0.274429204, −0.389579658, −0.480360620, −0.573261747, −0.664244460, −1.20728736 × 10^−16^, −1.78638199 × 10^−16^, and−5.16394048 × 10^−33^.
The Roman Atom-bond connectivity energy is
Likewise, the Roman Geometric-Arithmetic matrix is obtained as
The characteristic equation of is , where is the unit matrix of order 22. That is,
The eigenvalues of are −2.08575025, 3.54501997, 3.18769045, 3.00624527, 2.79641682, 2.64943222, 2.47700180, 1.57539588, −1.67925677, 0.958350468, 0.862354795, −1.26885654, 0.334323419, −0.95761194, −0.794245516, −0.640351481, −0.528102676, −0.298429079, −0.139626840, 3.94563773 × 10^−17^, 3.94563773 × 10^−17^ and −1.54074396 × 10^−33^.
Thus, the Roman Geometric-Arithmetic energy is
Hence the proof.
The Roman domination number ( ), classical graph energies ( and ) and Roman energies ( and ) of the remaining 20 anti-Alzheimer’s herbal compounds are computed using python programming and the results are presented in Tables 2–4. The calculated Roman domination numbers, classical graph energies and Roman graph energies will serve as the foundation for the subsequent QSPR analysis, providing deeper insights into the relationship between molecular structure and biological activity. The chemical structures and Roman domination representations of the corresponding isomorphic molecular graphs for the remaining 20 anti-Alzheimer’s herbal compounds are provided in the Supplementary Material.
QSPR analysis of physicochemical properties of Anti-Alzheimer’s herbal compounds
7
In this section, Quantitative Structure-Property Relationship (QSPR) analysis is conducted to examine the association between the calculated graph energies and physicochemical properties of anti-Alzheimer’s herbal compounds. The experimental values of boiling point (BP), enthalpy of vaporization (EV), molar volume (MV), molar refractivity (MR), polarizability (P), polar surface area (PSA), molecular weight (MW) and surface area (SA) are gathered from the ChemSpider database and are summarized in Table 5. To investigate the relationship between graph energies and physicochemical properties, three regression models, specifically linear, quadratic and cubic are employed in QSPR analysis. The general forms of these regression equations are given below:
where is the physicochemical property, is the graph energy and and are constants. The QSPR regression equations derived from classical and Roman energies are constructed using SPSS (Statistical Package for Social Sciences) software.
Results and discussion
8
The QSPR modeling results indicate that both classical and Roman energies exhibit strong correlations with the physicochemical properties of anti-Alzheimer’s herbal compounds, as shown in Table 6. The detailed comparative analysis presented in Table 6 indicates that the correlation coefficients associated with Roman energy descriptors are consistently greater than or equal to those of the classical graph energy descriptors across all three regression models. This consistent superiority of Roman energies underscores the significance of Roman domination functions as an advancement over classical graph energies, providing enhanced predictive power in QSPR analysis. Furthermore, among the three regression analysis, the quadratic regression provides the best fit, showing a higher correlation coefficient and a lower standard error than the linear and cubic regression models. Table 7 presents the most significant quadratic regression equations for all properties along with their statistical parameters (correlation coefficient , coefficient of determination standard error , significance value ), while Figure 4 illustrates the corresponding scatter plots. These scatter plots further support the findings by exhibiting a strong agreement between the observed and predicted physicochemical property values, with data points closely distributed around the quadratic regression curve, thereby confirming the stability, consistency, and predictive robustness of the developed QSPR models. The most prominent Roman energies for exploring the physicochemical properties of anti-Alzheimer’s herbal compounds using the quadratic QSPR regression equations are given below.
- exhibits excellent correlations with molar volume (0.948), molar refractivity (0.982), polarizability (0.982), molecular weight (0.995), and surface area (0.993).
- shows the strongest correlations with boiling point (0.973) and enthalpy of vaporization (0.971).
- yields a good correlation with polar surface area (0.962).
*Scatter plots of the most significant quadratic QSPR regression equations (a)
ELR with BP , (b)
ELR with EV , (c)
EABCR with MV , (d)
EABCR with MR , (e)
EABCR with P , (f)
ER with PSA , (g)
EABCR with MW and (h)
EABCR with SA .*
Thus, the results indicate the suitability of Roman energy descriptors for exploring the targeted physicochemical properties. In particular, emerges as a highly effective descriptor for predicting the size-related and shape-related properties, including molar volume, molar refractivity, molecular weight and surface area. Similarly, is identified as a reliable predictor for the thermodynamic properties such as boiling point and enthalpy of vaporization, while shows particular relevance for modeling the polar surface area. These findings suggest that the developed quadratic QSPR models can be selectively employed depending on the physicochemical property of interest, thereby enabling an efficient prediction of key properties of anti-Alzheimer’s herbal compounds. Consequently, the Roman energy descriptors provide a rational and robust basis for QSPR modeling.
Validation of QSPR models
9
This section presents the internal and external validation of the developed QSPR models to assess their reliability and predictive accuracy.
Internal validation using Y-randomnization
9.1
To ensure that the observed correlations are not due to chance, a Y-randomization test is performed. In this procedure, the dependent variable (Y, experimental value of the physicochemical property) is randomly permuted while keeping the independent variables (X, Roman energies) are kept fixed. For each randomized dataset, a quadratic regression model is constructed under the same conditions as the original model and the corresponding scrambled values are recorded. This process is repeated 1000 times, generating a distribution of scrambled scores that is then compared with the original regression performance. Figure 5 illustrates the difference between the original and scrambled scores over 1000 iterations.
*Y-randomization r2 distribution plot showing the difference between the original r2 and scrambled mean r2 for (a)
ELR with BP , (b)
ELR with EV , (c)
EABCR with MV , (d)
EABCR with MR , (e)
EABCR with P , (f)
ER with PSA , (g)
EABCR with MW and (h)
EABCR with SA .*
The results revealed that the original values are consistently and substantially higher than the scrambled mean , with an average difference of about 0.8. Furthermore, the randomized models satisfy the accepted threshold scrambled , confirming that the predictive performance is not due to chance. Overall, the Y-randomization test demonstrates that the quadratic regression models are statistically valid, robust and capture genuine relationships between Roman energies and physicochemical properties.
Internal validation using leave-one-out cross validation (LOOCV)
9.2
The Leave-One-Out Cross-Validation (LOOCV) method is employed to evaluate the internal predictive performance of the quadratic regression models. In this approach, each sample is left out once, the model is trained on the remaining samples and the excluded point is predicted.
The predictive squared correlation coefficient and root mean squared error are calculated as: and , where is the actual observed value for sample , is the predicted value for sample from a model trained without sample and is the mean of all observed values. The LOOCV analysis confirms the strong internal predictive ability of the developed models with values ranging from 0.8742 to 0.9869 and consistently low values, as shown in Figure 6. These results highlight the accuracy, stability and generalizability of the proposed Roman domination-based energies for QSPR modeling.
rLOOCV2 and RMSELOOCV values of significant regression models.
External validation using relative error (RE)
9.3
The developed predictive models are externally validated by using the phytochemical compound Kaempferol as the test compound. The chemical structure and the Roman domination of the isomorphic molecular graph of Kaempferol are shown in Figure 7.
(a) Chemical structure and (b) Roman domination of the isomorphic molecular graph of Kaempferol.
Using the most prominent Roman energies ( and ), the predicted physicochemical property values are calculated and compared with the experimental (observed) values. For external validation using Relative Error ( ), the interpretation depends on the magnitude of the error, indicating how far the predicted values deviate from the observed values. Mathematically, it is expressed as: , where is the predicted value and is the observed value. Predictive accuracy is evaluated using relative error analysis, with the following criteria: <5% (excellent), 5%–10% (very good), 10%–15% (good), 15%–20% (moderate), 20%–35% (acceptable), and >35% (poor). Based on this classification, the boiling point (BP, 2.85%) and enthalpy of vaporization (EV, 0.14%) exhibits excellent predictive accuracy. The molar volume (MV, 31.44%) fell within the acceptable range. The molar refractivity (MR, 12.24%) and polarizability (P, 12.26%) are classified as good predictions. The polar surface area (PSA, 10.41%), molecular weight (MW, 5.96%) and surface area (SA, 7.81%) demonstrated very good predictive performance. Figure 8 illustrates the scatter plot between the experimental and predicted values of physicochemical properties of Kaempferol. Overall, the validation confirms the robustness of the model with strong correlation between predicted and experimental values, highlighting its reliability for QSPR analysis.
Scatter plot between the experimental vs. predicted values of physicochemical properties of Kaempferol.
Conclusion
10
In this work, a novel graph molecular modeling based on Roman domination was proposed for the quantitative structure-property relationship (QSPR) analysis of anti-Alzheimer’s phytochemicals. Unlike classical graph energies such as adjacency and Laplacian energies, which capture only connectivity patterns, the newly introduced Roman domination-based energies encode hierarchical dominance among atoms, thereby offering a deeper structural perspective of molecular graphs.
The QSPR models were developed using these Roman energies through linear, quadratic and cubic regression equations. The results demonstrated superior performance compared to classical approaches, with quadratic regression showing the strongest correlations and the lowest standard error. Internal validation through Y-randomization and LOOCV confirmed the stability of the models, while external validation on Kaempferol ( ) further supported their predictive reliability. These findings underscore the robustness and generalizability of Roman domination-based energies.
Overall, this research establishes Roman energies as powerful molecular descriptors that significantly enhance the accuracy of QSPR modeling. Beyond Alzheimer’s related phytochemicals, the methodology has potential for broader applications in drug discovery, materials informatics and computational chemistry, paving the way for the integration of graph-theoretic principles with predictive modeling in cheminformatics.
The reference list from the paper itself. Each links out to its DOI / PubMed record.
- 1Ahmed W. Ali K. Zaman S. Raza A. (2024). Molecular insights into anti-alzheimer’s drugs through predictive modeling using linear regression and QSPR analysis. Mod. Phys. Lett. B 38 (27), 2450260. 10.1142/S 0217984924502609 · doi ↗
- 2Ahmed W. Ali K. Zaman S. Ahmad F. Ashebo M. A. (2025 a). Molecular insights into anti-alzheimer’s drugs through eccentricity-based predictive mathematical modeling using regression and QSPR analysis. J. Mol. Eng. Mat. 13 (02), 2450016. 10.1142/S 2251237324500163 · doi ↗
- 3Ahmed W. Hanif M. F. Alzahrani E. Fiidow O. A. Ashraf T. Ali K. (2025 b). Harnessing topological descriptors: a comparative analysis of artificial neural networks and random forest for predicting anti-alzheimer drug properties. Nano, 2550085. 10.1142/s 1793292025500857 · doi ↗
- 4Alhazmi H. A. Albratty M. (2022). An update on the novel and approved drugs for alzheimer disease. Saudi Pharm. J. 30, 1755–1764. 10.1016/j.jsps.2022.10.004 36601504 PMC 9805975 · doi ↗ · pubmed ↗
- 5Alsenani F. (2024). Unraveling potential neuroprotective mechanisms of herbal medicine for alzheimer’s diseases through comprehensive molecular docking analyses. Saudi J. Biol. Sci. 31, 103998. 10.1016/j.sjbs.2024.103998 38681227 PMC 11053229 · doi ↗ · pubmed ↗
- 6Bapat R. B. (2014). Graphs and matrices. Springer-Verlag London. 10.1007/978-1-4471-6569-9 · doi ↗
- 7Bozkurt S. B. Gungor A. D. Gutman I. Cevik A. S. (2010). Randic matrix and randic energy. MATCH Commun. Math. Comput. Chem. 64, 239–250.
- 8Bruno F. Abondio P. Bruno R. Ceraudo L. Paparazzo E. Citrigno L. (2023). Alzheimer’s disease as a viral disease: revisiting the infectious hypothesis. Ageing Res. Rev. 91, 102068. 10.1016/j.arr.2023.102068 37704050 · doi ↗ · pubmed ↗