A nomogram for predicting in‐hospital death in a multinational cohort of patients with takotsubo syndrome
Yuyi Chen, Amanda Chang, Fangyuan Cheng, Davide Di Vece, Michael Würdinger, Philipp Theil, Tou Kun Chong, Christian Templin, Jian Chen, Xiaodong Wu, Kan Liu

TL;DR
This paper develops a tool to predict in-hospital death in patients with takotsubo syndrome using clinical factors like BMI and blood pressure.
Contribution
A novel nomogram is developed for predicting in-hospital death in takotsubo syndrome patients using multinational data.
Findings
The nomogram achieved high accuracy (AUC of 0.854 in training and 0.836 in test cohorts).
The model showed good calibration and better net benefit than alternative strategies in predicting death.
External validation confirmed the nomogram's effectiveness with an AUC of 0.838.
Abstract
An effective risk stratification model on hospitalized patients with takotsubo syndrome (TTS) helps guide treatment to mitigate adverse events and improve prognosis. We aimed to develop a nomogram for predicting in‐hospital death in a multinational cohort of TTS patients. We enrolled 829 TTS patients from AmSC Research Network, InterTAK registry and ChiTTS registry, classified into the training (n = 578), test (n = 145) and external validation (n = 106) cohorts. Body mass index (BMI), chronic kidney disease (CKD), neurologic disorders, cardiogenic shock, low systolic blood pressure (SBP, <122 mmHg) and abnormal white blood cell (WBC, ≥11.3 × 10⁹/L) were independent positive predictors, while chest pain was an independent negative predictor of in‐hospital death. A nomogram was constructed to predict in‐hospital death in TTS patients based on these seven independent variables, which…
Genes, proteins, chemicals, diseases, species, mutations and cell lines named across the full text — each resolved to its canonical identifier and authoritative record.
Click any figure to enlarge with its caption.
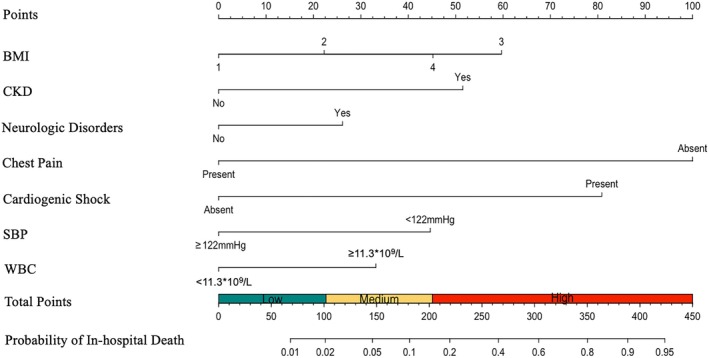 FIGURE 1
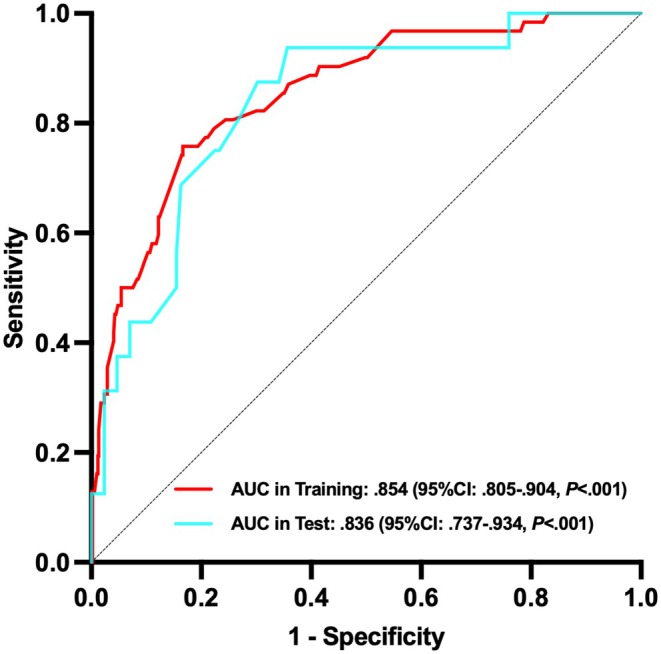 FIGURE 2
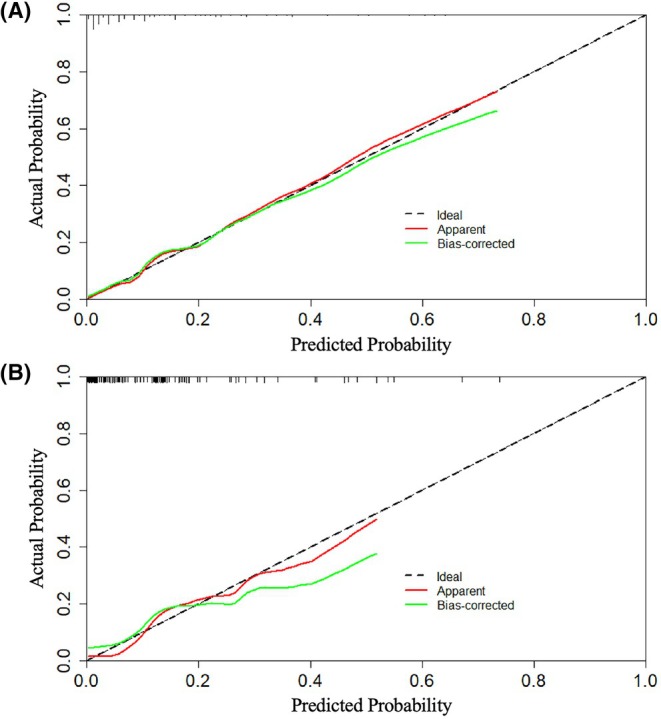 FIGURE 3
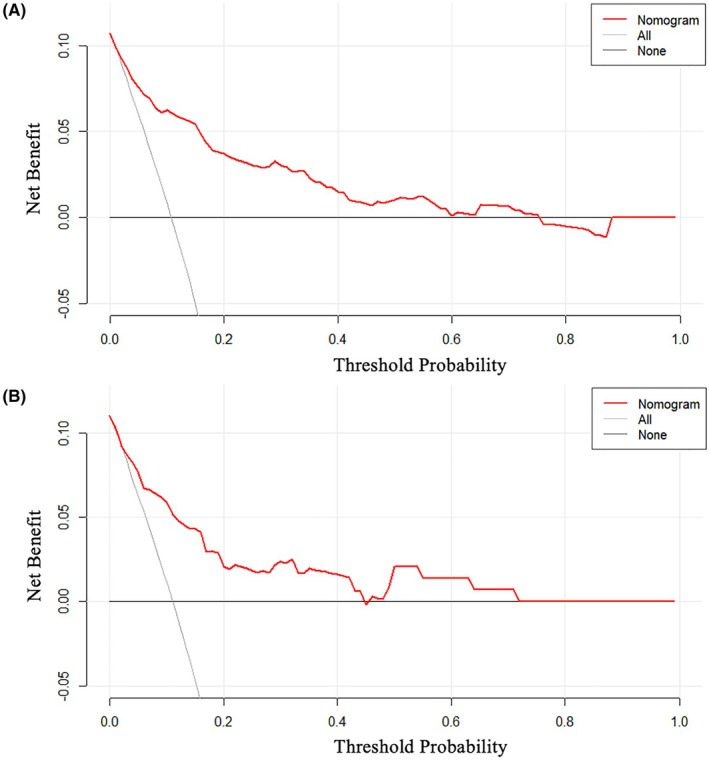 FIGURE 4
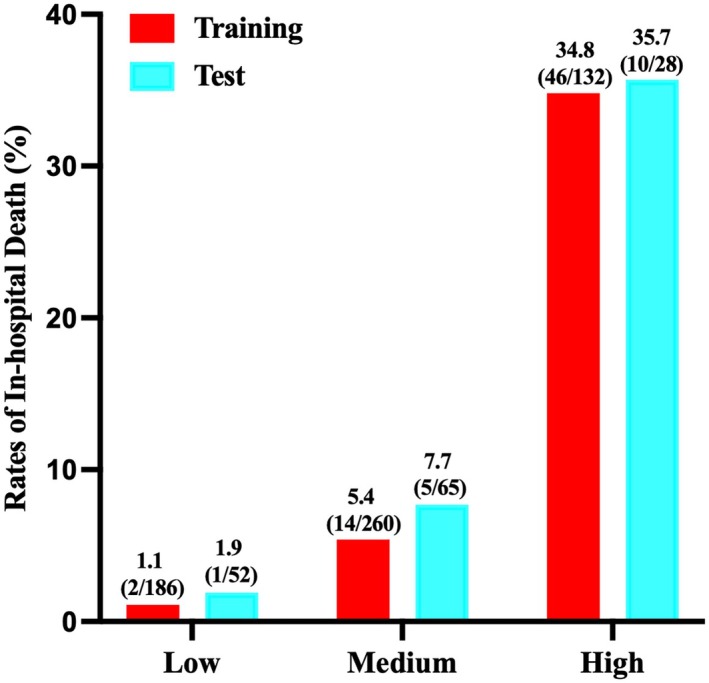 FIGURE 5
| Training ( | Test ( |
| |
|---|---|---|---|
| Age, years | 64.2 ± 15.3 | 65.1 ± 14.4 | .522 |
| Male, | 115 (19.9) | 29 (20.0) | .978 |
| Race, | |||
| White | 419 (72.5) | 121 (83.4) | .044 |
| Black | 63 (10.9) | 8 (5.5) | |
| Asian | 69 (11.9) | 13 (9.0) | |
| Unknown | 27 (4.7) | 3 (2.1) | |
| BMI, kg/m2 | 26.4 ± 6.9 | 26.3 ± 6.3 | .876 |
| BMI, | |||
| Underweight | 46 (8.0) | 15 (10.3) | .431 |
| Normal weight | 226 (39.1) | 46 (31.7) | |
| Overweight | 175 (30.3) | 50 (34.5) | |
| Mild obesity | 69 (11.9) | 21 (14.5) | |
| Moderate obesity | 34 (5.9) | 9 (6.2) | |
| Severe obesity | 28 (4.8) | 4 (2.8) | |
| Current smoker, | 126 (21.8) | 37 (25.5) | .338 |
| Hypertension, | 353 (61.1) | 82 (56.6) | .320 |
| Diabetes mellitus, | 136 (23.5) | 30 (20.7) | .467 |
| Hyperlipidemia, | 267 (46.2) | 62 (42.8) | .458 |
| Atrial fibrillation, | 85 (14.7) | 21 (14.5) | .946 |
| Coronary artery disease, | 115 (19.9) | 31 (21.4) | .691 |
| COPD, | 86 (14.9) | 16 (11.0) | .234 |
| Asthma, | 36 (6.2) | 13 (9.0) | .241 |
| CKD, | 93 (16.1) | 21 (14.5) | .635 |
| Malignancy, | 138 (23.9) | 46 (31.7) | .052 |
| Psychiatric disorders, | 219 (37.9) | 52 (35.9) | .652 |
| Neurologic disorders, | 218 (37.7) | 49 (33.8) | .381 |
| Acute neurologic disorders, | 107 (18.5) | 27 (18.6) | .976 |
| Physical trigger, | 401 (69.4) | 103 (71.0) | .698 |
| Chest pain, | 196 (33.9) | 61 (42.1) | .066 |
| Shortness of breath, | 279 (48.3) | 78 (53.8) | .234 |
| Cardiogenic shock, | 83 (14.4) | 19 (13.1) | .698 |
| Heart rate, bpm | 95.8 ± 23.2 | 91.7 ± 20.5 | .053 |
| SBP, mmHg | 123.9 ± 26.3 | 121.5 ± 23.2 | .317 |
| DBP, mmHg | 75.5 ± 17.6 | 73.8 ± 15.5 | .292 |
| Troponin, ng/mL | .46 (.11, 1.98) | .60 (.13, 3.17) | .192 |
| WBC, ×109/L | 12.4 ± 6.8 | 12.1 ± 6.9 | .609 |
| Creatinine, mg/dL | .9 (.7, 1.2) | .9 (.7, 1.2) | .471 |
| ST‐segment elevation, | 126 (21.8) | 31 (21.4) | .913 |
| ST‐segment depression, | 92 (15.9) | 25 (17.2) | .699 |
| T‐wave inversion, | 308 (53.3) | 80 (55.2) | .684 |
| QTc prolongation, | 390 (67.5) | 83 (57.2) | .021 |
| Type of TTS, | |||
| Apical | 411 (72.6) | 107 (75.4) | .762 |
| Mid‐ventricular | 42 (7.4) | 13 (9.2) | |
| Basal | 35 (6.2) | 6 (4.2) | |
| Focal | 38 (6.7) | 8 (5.6) | |
| Global | 40 (7.1) | 8 (5.6) | |
| LVEF, % | 37.9 ± 12.0 | 37.9 ± 11.9 | .996 |
| RV involvement, | 108 (20.3) | 20 (14.6) | .133 |
| In‐hospital death, | 62 (10.7) | 16 (11.0) | .915 |
| In‐hospital death ( | No in‐hospital death ( |
| |
|---|---|---|---|
| Age, years | 63.7 ± 16.6 | 64.2 ± 15.2 | .777 |
| Male, | 18 (29.0) | 97 (18.8) | .057 |
| Race, | |||
| White | 47 (75.8) | 372 (72.1) | .886 |
| Black | 5 (8.1) | 58 (11.2) | |
| Asian | 7 (11.3) | 62 (12.0) | |
| Unknown | 3 (4.8) | 24 (4.7) | |
| BMI, kg/m2 | 27.8 ± 9.5 | 26.2 ± 6.5 | .215 |
| BMI, | |||
| Underweight | 9 (14.5) | 37 (7.2) | .001 |
| Normal weight | 20 (32.3) | 206 (39.9) | |
| Overweight | 11 (17.7) | 164 (31.8) | |
| Mild obesity | 9 (14.5) | 60 (11.6) | |
| Moderate obesity | 4 (6.5) | 30 (5.8) | |
| Severe obesity | 9 (14.5) | 19 (3.7) | |
| Current smoker, | 10 (16.1) | 116 (22.5) | .252 |
| Hypertension, | 39 (62.9) | 314 (60.9) | .754 |
| Diabetes mellitus, | 20 (32.3) | 116 (22.5) | .086 |
| Hyperlipidemia, | 24 (38.7) | 243 (47.1) | .211 |
| Atrial fibrillation, | 13 (21.0) | 72 (14.0) | .141 |
| Coronary artery disease, | 11 (17.7) | 104 (20.2) | .653 |
| COPD, | 9 (14.5) | 77 (14.9) | .932 |
| Asthma, | 1 (1.6) | 35 (6.8) | .189 |
| CKD, | 19 (30.6) | 74 (14.3) | .001 |
| Malignancy, | 20 (32.3) | 118 (22.9) | .101 |
| Psychiatric disorders, | 21 (33.9) | 198 (38.4) | .490 |
| Neurologic disorders, | 29 (46.8) | 189 (36.6) | .119 |
| Acute neurologic disorders, | 17 (27.4) | 90 (17.4) | .056 |
| Physical trigger, | 55 (88.7) | 346 (67.1) | <.001 |
| Chest pain, | 4 (6.5) | 192 (37.2) | <.001 |
| Shortness of breath, | 33 (53.2) | 246 (47.7) | .409 |
| Cardiogenic shock, | 28 (45.2) | 55 (10.7) | <.001 |
| Heart rate, bpm | 99.6 ± 22.6 | 95.3 ± 23.2 | .167 |
| SBP, mmHg | 110.6 ± 22.6 | 125.4 ± 26.3 | <.001 |
| DBP, mmHg | 68.1 ± 16.8 | 76.3 ± 17.5 | <.001 |
| Troponin, ng/mL | .38 (.05, 1.61) | .46 (.12, 2.04) | .334 |
| WBC, ×109/L | 15.6 ± 9.4 | 12.0 ± 6.3 | .005 |
| Creatinine, mg/dL | 1.1 (.8, 1.6) | .9 (.7, 1.1) | .004 |
| ST‐segment elevation, | 12 (19.4) | 114 (22.1) | .622 |
| ST‐segment depression, | 15 (24.2) | 77 (14.9) | .059 |
| T‐wave inversion, | 29 (46.8) | 279 (54.1) | .277 |
| QTc prolongation, | 37 (59.7) | 353 (68.4) | .165 |
| Type of TTS, | |||
| Apical | 49 (79.0) | 370 (71.7) | .358 |
| Mid‐ventricular | 2 (3.2) | 41 (7.9) | |
| Basal | 3 (4.8) | 34 (6.6) | |
| Focal | 2 (3.2) | 37 (7.2) | |
| Global | 6 (9.7) | 34 (6.6) | |
| LVEF, % | 34.6 ± 11.5 | 38.3 ± 12.0 | .019 |
| RV involvement, | 19 (30.6) | 102 (19.8) | .047 |
| Unadjusted OR (95% CI) |
| Adjusted OR (95% CI) |
| |
|---|---|---|---|---|
| Age ≥65 years | .71 (.42, 1.20) | .199 | – | – |
| Male | 1.77 (.98, 3.19) | .059 | – | – |
| Race | ||||
| White | Reference | – | – | |
| Black | .68 (.26, 1.79) | .436 | ||
| Asian | .89 (.39, 2.07) | .793 | ||
| Unknown | .99 (.29, 3.41) | .986 | ||
| BMI | ||||
| Normal weight/overweight | Reference | Reference | ||
| Mild‐to‐moderate obesity | 1.72 (.87, 3.43) | .120 | 2.18 (.90, 5.29) | .085 |
| Severe obesity | 5.65 (2.36, 13.54) | <.001 | 3.66 (1.13, 11.88) | .031 |
| Underweight | 2.90 (1.29, 6.56) | .010 | 3.57 (1.27, 10.05) | .016 |
| Diabetes mellitus | 1.64 (.93, 2.91) | .089 | – | – |
| Atrial fibrillation | 1.64 (.85, 3.17) | .144 | – | – |
| Asthma | .23 (.03, 1.67) | .145 | – | – |
| CKD | 2.64 (1.46, 4.78) | .001 | 2.73 (1.26, 5.87) | .011 |
| Neurologic disorders | 1.52 (.90, 2.58) | .121 | 2.01 (1.01, 3.99) | .046 |
| Malignancy | 1.61 (.91, 2.84) | .104 | – | – |
| Physical trigger | 3.86 (1.72, 8.66) | .001 | – | – |
| Chest pain | .12 (.04, .33) | <.001 | .19 (.06, .60) | .005 |
| Cardiogenic shock | 6.90 (3.89, 12.24) | <.001 | 5.63 (2.76, 11.48) | <.001 |
| Heart rate ≥95 bpm | 1.43 (.84, 2.44) | .183 | – | – |
| SBP <122 mmHg | 3.60 (1.99, 6.53) | <.001 | 2.96 (1.46, 6.02) | .003 |
| WBC ≥11.3 × 10⁹/L | 2.58 (1.47, 4.55) | .001 | 2.06 (1.01, 4.19) | .047 |
| ST‐segment elevation | .85 (.44, 1.64) | .622 | – | – |
| ST‐segment depression | 1.82 (.97, 3.42) | .062 | – | – |
| QTc prolongation | .68 (.40, 1.17) | .167 | – | – |
| LVEF ≤35% | 2.19 (1.27, 3.79) | .005 | – | – |
| RV involvement | 1.79 (1.00, 3.21) | .049 | – | – |
| Models | C‐index (95% CI) |
| NRI (95% CI) |
| IDI (95% CI) |
|
|---|---|---|---|---|---|---|
| Training | ||||||
| Nomogram | .854 (.805, .904) | Reference | Reference | Reference | ||
| InterTAK Prognostic Score | .753 (.697, .809) | .002 | −.413 (−.576, −.249) | <.001 | −.156 (−.216, −.096) | <.001 |
| GEIST Prognostic Score | .655 (.584, .726) | <.001 | −.786 (−.967, −.605) | <.001 | −.211 (−.272, −.150) | <.001 |
| Test | ||||||
| Nomogram | .836 (.737, .934) | Reference | Reference | Reference | ||
| InterTAK Prognostic Score | .778 (.649, .906) | .530 | −.248 (−.617, .120) | .187 | −.039 (−.203, .126) | .647 |
| GEIST Prognostic Score | .744 (.608, .881) | .334 | −.466 (−.849, −.082) | .017 | −.113 (−.230, .005) | .061 |
- —University of Iowa10.13039/100008893
Peer Reviews
No public reviews on file for this paper yet. If you reviewed it on a platform where reviews are public (OpenReview, ICLR, NeurIPS, ICML), you can paste yours below so the community can read it here.
Videos
No videos yet. Explain this paper in a talk, walkthrough, or lecture? Add one.
Taxonomy
TopicsTakotsubo Cardiomyopathy and Associated Phenomena · Cardiovascular Syncope and Autonomic Disorders · Pericarditis and Cardiac Tamponade
INTRODUCTION
1
Takotsubo syndrome (TTS) is an increasingly recognized cardiovascular disorder in hospitalized patients, characterized by left ventricular dysfunction without obstructive coronary artery disease.1, 2, 3, 4 Although initially considered a benign and fully reversible condition, TTS has been found to have heterogeneous phenotypes and courses. Evidence is accumulating that TTS patients have poor short‐ and long‐term outcomes.5, 6, 7 Of concern, a recent study indicated that TTS associated in‐hospital complications and mortality is on the rise.8 Risk stratification is particularly important for guiding decision‐making and treatment to mitigate adverse events and improve prognosis in hospitalized TTS patients. Although the major TTS registries have previously formed vital prognostic scores to predict short‐ and long‐term outcomes in TTS patients,9, 10 a nomogram model on a cohort of TTS patients with greater diversity and ethnicity has yet to be established. To build a widely applicable clinical prediction tool, we aimed to develop a nomogram for predicting in‐hospital death based on admission clinical data in TTS patients from three major national/international TTS registries and research network.
METHODS
2
Study population
2.1
A total of 829 TTS patients were enrolled from AmSC (American Stress Cardiomyopathy) Research Network (n = 527), InterTAK registry11 (n = 122) and ChiTTS registry12 (n = 180), diagnosed between November 2004 and July 2024. The AmSC Research Network is an observational and retrospective research study established among 10 university‐affiliated or regional referral medical centers inside the USA (Washington University in St. Louis, University of Iowa, State University of New York, University of North Carolina, Weill Cornell Medical College, Kansas University, Lankenau Medical Center, Northwest Health Medical Center, Providence Regional Medical Center and Saint Louis University). The AmSC Research Network was established to augment the machine learning algorithms using large‐scale multi‐institution and multi‐vendor echocardiographic datasets, as well as clinical data metrics to increase the robustness, generalizability and interpretability of prediction models in clinical and imaging diagnosis and prognosis of TTS patients.13, 14 In order to maintain consistency and completeness of clinical data collection and analysis in the present study, we only enrolled the patient data of AmSC Research Network in two major tertiary cardiovascular centers (Washington University in St. Louis and University of Iowa). TTS diagnosis was based on the InterTAK diagnostic criteria.1 This study complied with the principles contained in the Declaration of Helsinki and was approved by the institutional review board of Washington University in St. Louis. Data reporting follows the principles put forth by the STROBE initiative.
Data collection and primary endpoint event
2.2
Baseline clinical characteristics were recorded for every patient, including demographics (age, sex and race), medical history (based on prior diagnosis, including smoking, hypertension, diabetes mellitus, hyperlipidemia, atrial fibrillation, coronary artery disease, chronic obstructive pulmonary disease [COPD], asthma, chronic kidney disease [CKD], malignancy, psychiatric disorders, neurologic disorders [including ischemic stroke, intracerebral haemorrhage, migraine, epilepsy, seizures and so on] and acute neurologic disorders), triggering factor, symptoms (pre‐admission/admission, including chest pain and shortness of breath), presence of cardiogenic shock (pre‐admission/admission, based on ICD code/clinical diagnosis), vital signs (on admission, including body mass index [BMI], heart rate and systolic blood pressure [SBP]/diastolic blood pressure [DBP]), laboratory biomarkers (on admission, including troponin, white blood cell [WBC] and creatinine), electrocardiographic parameters (on admission, including ST‐segment elevation, ST‐segment depression, T‐wave inversion and QTc prolongation) and echocardiographic parameters (on admission, including type of TTS, left ventricular ejection fraction [LVEF] and right ventricular [RV] involvement). The primary endpoint event was in‐hospital all‐cause death. Seven hundred and twenty‐three TTS patients had raw echocardiographic imaging data and were randomly classified into the training (80%, n = 578) and test (20%, n = 145) cohorts based on in‐hospital death. Meanwhile, we enrolled 106 TTS patients between June 2012 and June 2024 from the ChiTTS registry as the external validation cohort, who did not have raw echocardiographic imaging data.
Statistical analysis
2.3
Data were presented with mean and standard deviation or median and interquartile range (IQR) for continuous variables and with number and percentage for categorical variables. Independent sample t‐test was used for comparisons of normal distributed data. Comparisons were performed with Mann Whitney U test for non‐normal distributed data. Categorical data were compared using Chi‐Square test. Restricted cubic spline curves were used to assess the relationship between several continuous variables (including BMI, heart rate, SBP and WBC) and the risk of primary endpoint event with 5 knots at the 5th, 35th, 50th, 65th and 95th percentiles of these variables. Multivariate logistic regression analysis was performed to select independent predictors of the primary endpoint event, and adjusted variables included those with p < .2 in univariate analyses and clinical meaning based on previous studies.5, 9, 10, 15, 16, 17 The new prognostic score model was presented with the nomogram, and the probability of in‐hospital death was estimated using the nomogram. Receiver operating characteristic (ROC) curves were performed to evaluate the discriminative performance of the nomogram. Calibration curves were used to assess the consistent ability between the predicted and actual probability of in‐hospital death. Decision curve analyses were performed to evaluate the clinical benefit and utility of the nomogram. To assess whether the nomogram would improve the discrimination when compared to previous prognostic scores, C‐index, net reclassification improvement (NRI) and integrated discrimination improvement (IDI) were calculated and compared. Missing values of all variables were <10% (Tables S1 and S2). Mean or median was used when a missing value was a continuous variable and mode was used when a missing value was a categorical variable. All analyses were performed with SPSS version 27 and R version 4.4.1. p Values <.05 were considered statistically significant.
RESULTS
3
A total of 829 TTS patients were enrolled, among which 578 were allocated to the training cohort, 145 to the test cohort and 106 to the external validation cohort. Except for race and QTc prolongation, all other features were comparable between the training and test cohorts (Table 1).
Independent predictors of in‐hospital death in TTS patients in the training cohort
3.1
Compared to patients who survived hospitalization, those who experienced in‐hospital death were more frequently to have underweight, obesity, CKD, physical trigger, cardiogenic shock and RV involvement, and less likely to present with chest pain. Additionally, they had lower SBP, DBP and LVEF, and higher WBC and creatinine (Table 2).
Univariate logistic regression analysis showed that patients with severe obesity or underweight had a higher risk of in‐hospital death compared to those with normal weight. The risk of in‐hospital death was similar between mild and moderate obesity. The risk of in‐hospital death in patients with overweight was slightly lower than those with normal weight, but it did not reach statistical significance (Table S3). Furthermore, restricted cubic spline curve showed that the risk of in‐hospital death was similar between normal weight and overweight (Figure S1A). Therefore, patients were categorized into four groups for multivariate analysis: normal weight/overweight, mild‐to‐moderate obesity, severe obesity and underweight. Additionally, restricted cubic spline curves revealed that the risk of in‐hospital death increased when heart rate was >95 bpm (Figure S1B), the risk of in‐hospital death increased with the decrease of SBP levels when SBP was <122 mmHg (Figure S1C), and the risk of in‐hospital death increased with the increase of WBC counts when WBC was ≥11.3 × 10^9^/L (Figure S1D).
Adjusted for age ≥65 years, sex, race, BMI, diabetes mellitus, atrial fibrillation, asthma, CKD, neurologic disorders, malignancy, physical trigger, chest pain, cardiogenic shock, heart rate ≥95 bpm, SBP <122 mmHg, WBC ≥11.3 × 10^9^/L, ST‐segment elevation, ST‐segment depression, QTc prolongation, LVEF ≤35%, and RV involvement, multivariate logistic regression analysis showed that BMI (mild‐to‐moderate obesity vs. normal weight/overweight: adjusted OR 2.18, 95% CI: .90–5.29, p = .085; severe obesity vs. normal weight/overweight: adjusted OR 3.66, 95% CI: 1.13–11.88, p = .031; underweight vs. normal weight/overweight: adjusted OR 3.57, 95% CI: 1.27–10.05, p = .016), CKD (adjusted OR 2.73, 95% CI: 1.26–5.87, p = .011), neurologic disorders (adjusted OR 2.01, 95% CI: 1.01–3.99, p = .046), cardiogenic shock (adjusted OR 5.63, 95% CI: 2.76–11.48, p < .001), SBP <122 mmHg (adjusted OR 2.96, 95% CI: 1.46–6.02, p = .003) and WBC ≥11.3 × 10^9^/L (adjusted OR 2.06, 95% CI: 1.01–4.19, p = .047) were independent positive predictors, while chest pain was an independent negative predictor of in‐hospital death (adjusted OR .19, 95% CI: .06–.60, p = .005) (Table 3).
Nomogram construction and validation
3.2
A nomogram was constructed to predict in‐hospital death in TTS patients based on these seven independent variables (Figure 1). Total points were determined based on the sum of the points assigned to each variable in the nomogram, with higher total points corresponding to a higher risk of in‐hospital death. As an illustration, a TTS patient with mild obesity (22 points), history of CKD (51.5 points) and neurologic disorders (26 points), absence of chest pain (100 points), presence of cardiogenic shock (80.5 points), SBP 100 mmHg on admission (44.5 points) and WBC 16.5 × 10^9^/L on admission (33.5 points) would have a total of 358 points. This corresponds to a predicted probability of in‐hospital death of 82.1%.
Nomogram for predicting in‐hospital death in patients with takotsubo syndrome. The total points were determined based on the sum of the points assigned to each variable in the nomogram. Patients were divided into three risk groups: Low‐risk (total points <102), medium‐risk (total points 102–203) and high‐risk (total points ≥203). For BMI, ‘1’ represented ‘normal weight/overweight’; ‘2’ represented ‘mild‐to‐moderate obesity’; ‘3’ represented ‘severe obesity’; ‘4’ represented ‘underweight’. BMI, body mass index; CKD, chronic kidney disease; SBP, systolic blood pressure; WBC, white blood cell.
The nomogram demonstrated good predictive power, with AUCs of .854 (95% CI: .805–.904, p < .001) in the training cohort and .836 (95% CI: .737–.934, p < .001) in the test cohort (Figure 2). The calibration curves showed good consistency between the prediction of the nomogram and the actual observation in both the training and test cohorts (Hosmer‐Lemeshow P: .110 and .341, respectively) (Figure 3). Decision curve analyses indicated that the use of the nomogram to predict in‐hospital death in TTS patients could provide better net benefit compared to the ‘treat all’ or ‘treat none’ strategies when the threshold probability ranged from 2% to 75% in the training cohort and from 2% to 72% in the test cohort (Figure 4).
Receiver operating characteristic curves of the nomogram in the training and test cohorts. AUC, area under the curve; CI, confidence interval.
Calibration curves of the nomogram in the training (A) and test (B) cohorts. The red line represented the performance of the nomogram, the green line corrected the bias in the nomogram and the black dotted line represented the ideal reference line. The closer the red or green line is to the black dotted line, the more accurate the nomogram predicts the probability of in‐hospital death.
Decision curve analyses of the nomogram in the training (A) and test (B) cohorts. The grey line represented the net benefit of the strategy that all patients were treated. The black line represented the net benefit of the strategy that none of patients were treated. The red line represented the nomogram.
Risk stratification of the nomogram
3.3
Following the previous study,15 patients were stratified into three risk groups: low‐risk (total points <102), medium‐risk (total points 102–203) and high‐risk (total points ≥203). The risk of in‐hospital death significantly increased with the increase of the risk class (medium vs. low: OR 5.24, 95% CI: 1.18–23.32, p = .030; high vs. medium: OR 9.40, 95% CI: 4.92–17.94, p < .001). The rates of in‐hospital death in low‐, medium‐ and high‐risk were 1.1% (2/186), 5.4% (14/260) and 34.8% (46/132), respectively, in the training cohort, and 1.9% (1/52), 7.7% (5/65) and 35.7% (10/28), respectively, in the test cohort (Figure 5).
Rates of in‐hospital death in three different risk groups in the training and test cohorts.
Predictive value of the nomogram compared with other prognostic scores for in‐hospital death in TTS patients in the training and test cohorts
3.4
Compared to the InterTAK Prognostic Score,9 the nomogram improved the prognostic performance for predicting in‐hospital death in TTS patients, but the improvement was not statistically significant in the test cohort (C‐index: .854 vs. .753, p = .002 [Training]; .836 vs. .778, p = .530 [Test]). It also improved the NRI (.413, p < .001 [Training]; .248, p = .187 [Test]) and IDI (.156, p < .001 [Training]; .039, p = .647 [Test]) for the prognostic value of in‐hospital death, but these improvements were not statistically significant in the test cohort.
Compared to the GEIST Prognostic Score,10 the nomogram improved the prognostic performance for predicting in‐hospital death in TTS patients, but the improvement did not reach statistical significance in the test cohort (C‐index: .854 vs. .655, p < .001 [Training]; .836 vs. .744, p = .334 [Test]). It also improved the IDI for the prognostic value of in‐hospital death, but it did not reach statistical significance in the test cohort (.211, p < .001 [Training]; .113, p = .061 [Test]). Importantly, it significantly improved the NRI for the prognostic value of in‐hospital death in both cohorts (.786, p < .001 [Training]; .466, p = .017 [Test]) (Table 4).
External validation
3.5
In‐hospital death was 6.6% in the external validation cohort. The nomogram demonstrated good predictive power, with AUC of .838 (95% CI: .663–1.000, p = .003) in the external validation cohort (Figure S2). The calibration curves showed good consistency between the prediction of the nomogram and the actual observation in the external validation cohort (Hosmer‐Lemeshow P: .233) (Figure S3).
DISCUSSION
4
The main findings of our study are as follows: (1) BMI, CKD, neurologic disorders, cardiogenic shock, low SBP and abnormal WBC were independent positive predictors, while chest pain was an independent negative predictor of in‐hospital death in a multinational cohort of TTS patients. (2) A new nomogram was developed for predicting in‐hospital death in TTS patients based on these seven independent variables and showed good discriminative and calibration abilities. (3) The risk of in‐hospital death significantly increased with the increase of established risk class in a multinational cohort of TTS patients.
Consistent with previous findings,10, 17, 18, 19, 20 our study showed that CKD and neurologic disorders significantly increased the risk of in‐hospital death in a multinational cohort of TTS patients. Although our study also confirmed previous findings15, 21, 22, 23 that presence of cardiogenic shock on admission significantly increased the risk of in‐hospital death, SBP itself became an independent predictor of in‐hospital death in TTS patients. Particularly, the risk of in‐hospital death increased with the decrease of SBP levels when SBP was <122 mmHg. Therefore, low SBP in TTS patients on admission raises a red flag and warrants close clinical monitoring and timely interventions. Consistent with previous studies,15, 24 WBC was an independent predictor of in‐hospital death in our study as well. Especially, the risk of in‐hospital death increased with the increase of WBC counts when WBC was ≥11.3 × 10^9^/L. The activation of systemic inflammatory response may become a potential clinical marker for adverse outcomes in TTS patients.25, 26
The correlation between BMI and outcomes in TTS patients is interesting. A previous Japanese retrospective study showed that underweight was significantly associated with higher in‐hospital mortality compared with normal weight (18.5–22.9 kg/m^2^), while no significant association was noted between obesity (≥27.5 kg/m^2^) and normal weight.27 Meanwhile, other studies also suggested that low BMI was associated with in‐hospital death,4 and the rate of in‐hospital death was similar between obesity and nonobesity.28 Of note, in our study, although underweight still posed a higher risk of in‐hospital death, severe obesity was significantly associated with higher in‐hospital death compared to normal weight/overweight, which may be associated with more cardiogenic shock events (31.3% vs. 12.5%, p = .006) and WBC ≥11.3 × 10^9^/L (68.8% vs. 49.1%, p = .031) (Table S4). In our study dataset, 96% of patients with moderate or severe obesity were from the USA patients (AmSC Research Network data), which may become an essential contributor to help explore the factual relationship between BMI and outcomes in TTS patients.
Of note, our study showed that TTS patients with chest pain had a lower risk of in‐hospital death. Compared to patients without chest pain, those with chest pain were more frequently female and less likely to have atrial fibrillation, malignancy, neurologic disorders, physical trigger, SBP <122 mmHg and WBC ≥11.3 × 10^9^/L. Additionally, they had lower heart rate and better LV and RV function in echocardiograms (Table S5). Previous studies showed that the patients who were chest pain‐free had higher in‐hospital death during acute myocardial infarction or acute pulmonary embolism, which was attributed to worse baseline characteristics, delayed presentation to the hospital and decreased likelihood to receive standard therapies.29, 30, 31, 32 As one of the most common TTS associated symptoms,1 chest pain appears to be associated with a lower risk of in‐hospital complications/death in TTS patients as well. The underlying pathophysiology and clinical significance likely become important research targets down the road.
In addition, the clinical and laboratory features in this nomogram can be obtained rapidly and conveniently during routine clinical practice, making it clinically practical and broadly applicable. This may provide a streamlined and interpretable tool tailored for bedside use, highlighting individualized risk assessment in hospitalized TTS patients and supporting personalized treatment strategies to reduce adverse events.
There are several limitations in our study. First of all, we only requested and obtained the clinical data of TTS patients whose raw echocardiographic imaging data were available from two international/national registries as the training/test cohorts, and those without raw echocardiographic imaging data from the ChiTTS registry as the external validation cohort, which may lead to a relatively small study size and selection bias in the present clinical study. Secondly, the rate of in‐hospital death was 10.3% in our study, which appeared to be higher than previous investigations.4, 10, 15, 16, 33 Since most TTS patients were from two major tertiary medical centers in the USA (Washington University in St. Louis and University of Iowa), those patients may have more severe clinical manifestations and physical triggers compared to other TTS patients from regional and rural hospitals. Thirdly, data in this study spanned from 2004 to 2024 (Figure S4), and there is possible heterogeneity across the three registries/research network, especially regarding inclusion criteria, case mix, and data completeness. Finally, as a retrospective study, the established nomogram needs to be tested with large‐scale prospective trials, and we are collaborating with more international TTS registries for this research purpose.
CONCLUSIONS
5
The nomogram, composed of BMI, CKD, neurologic disorders, chest pain, cardiogenic shock, low SBP and abnormal WBC, helps predict in‐hospital death in TTS patients.
AUTHOR CONTRIBUTIONS
Study design: YC, AC, FC, XW, JC and KL; Data collection: YC, AC, FC, DDV, MW, PT, TKC and JC; Data analysis: YC; Writing‐original draft: YC and AC; Writing‐review and editing: YC, AC, FC, DDV, CT, XW, JC and KL; Project administration and supervision: XW, JC and KL. All authors have revised and approved the submitted manuscript.
FUNDING INFORMATION
This work was supported by National Institutes of Health Award to KL and XW (R01HL171624‐01).
CONFLICT OF INTEREST STATEMENT
All authors have no competing interests to declare.
Supporting information
Appendix S1.
The reference list from the paper itself. Each links out to its DOI / PubMed record.
- 1Ghadri JR , Wittstein IS , Prasad A , et al. International expert consensus document on Takotsubo syndrome (part I): clinical characteristics, diagnostic criteria, and pathophysiology. Eur Heart J. 2018;39:2032‐2046. doi:10.1093/eurheartj/ehy 076 29850871 PMC 5991216 · doi ↗ · pubmed ↗
- 2Citro R , Radano I , Bellino M , et al. Epidemiology, pathogenesis, and clinical course of Takotsubo syndrome. Heart Fail Clin. 2022;18:125‐137. doi:10.1016/j.hfc.2021.08.001 34776074 · doi ↗ · pubmed ↗
- 3Singh T , Khan H , Gamble DT , Scally C , Newby DE , Dawson D . Takotsubo syndrome: pathophysiology, emerging concepts, and clinical implications. Circulation. 2022;145:1002‐1019. doi:10.1161/CIRCULATIONAHA.121.055854 35344411 PMC 7612566 · doi ↗ · pubmed ↗
- 4Arao K , Yoshikawa T , Isogai T , et al. A study of takotsubo syndrome over 9 years at the Tokyo cardiovascular care unit network registry. J Cardiol. 2023;82:93‐99. doi:10.1016/j.jjcc.2022.12.011 36640906 · doi ↗ · pubmed ↗
- 5Ghadri JR , Wittstein IS , Prasad A , et al. International expert consensus document on Takotsubo syndrome (part II): diagnostic workup, outcome, and management. Eur Heart J. 2018;39:2047‐2062. doi:10.1093/eurheartj/ehy 077 29850820 PMC 5991205 · doi ↗ · pubmed ↗
- 6Templin C , Ghadri JR , Diekmann J , et al. Clinical features and outcomes of Takotsubo (stress) cardiomyopathy. N Engl J Med. 2015;373:929‐938. doi:10.1056/NEJ Moa 1406761 26332547 · doi ↗ · pubmed ↗
- 7Ghadri JR , Kato K , Cammann VL , et al. Long‐term prognosis of patients with Takotsubo syndrome. J Am Coll Cardiol. 2018;72:874‐882. doi:10.1016/j.jacc.2018.06.016 30115226 · doi ↗ · pubmed ↗
- 8Schweiger V , Cammann VL , Crisci G , et al. Temporal trends in Takotsubo syndrome: Results from the international Takotsubo registry. J Am Coll Cardiol. 2024;84:1178‐1189. doi:10.1016/j.jacc.2024.05.076 39217551 · doi ↗ · pubmed ↗