Analyzing the Attitudes of Teachers in Spain Toward Stuttering
Marta Modrego‐Alarcón, María Cruz Pérez‐Yus, Mayte Navarro‐Gil, Héctor Morillo‐Sarto, Alicia Monreal‐Bartolomé, Kenneth O. St. Louis

TL;DR
This study examines Spanish teachers' attitudes toward stuttering, finding generally positive views but some harmful beliefs that suggest a need for more training.
Contribution
The study is the first to investigate attitudes toward stuttering among Spanish teachers and identifies specific sociodemographic and professional factors influencing these attitudes.
Findings
Teachers in Spain generally have positive attitudes toward stuttering, but their knowledge about its causes is limited.
Specialized teachers, such as speech-language pathologists, show more positive attitudes than general teachers.
Training and direct experience with students who stutter are strongly linked to more supportive attitudes.
Abstract
Teachers play a crucial role in fostering supportive environments for all students. However, research indicates that their knowledge and attitudes toward stuttering are often similar to those of the general population. The primary aim of this study is to examine the attitudes of teachers at different educational levels in Spain toward stuttering and to explore how these attitudes relate to specific sociodemographic variables. A cross‐sectional, self‐report design was employed with a sample of 250 teachers from various educational levels and teaching roles across Spain. Participants completed the Public Opinion Survey on Human Attributes‐Stuttering (POSHA–S). Overall, the attitudes of teachers in Spain toward stuttering were generally positive and exceeded those observed in other comparison groups, except for the Knowledge Source component. Positive attitudes toward stuttering were…
Genes, proteins, chemicals, diseases, species, mutations and cell lines named across the full text — each resolved to its canonical identifier and authoritative record.
Click any figure to enlarge with its caption.
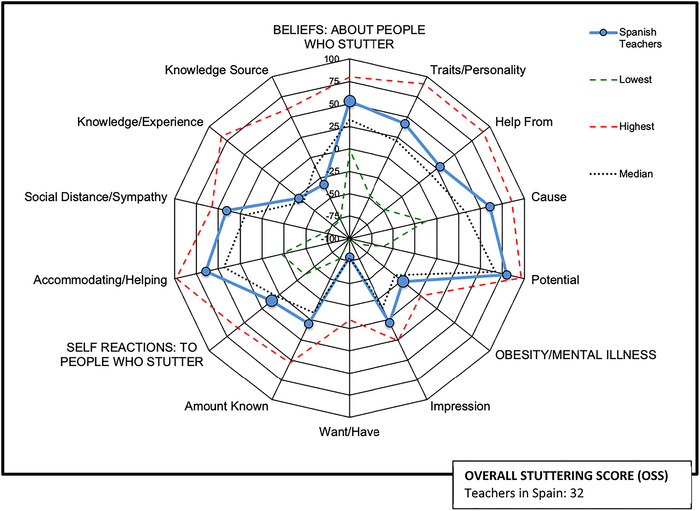 FIGURE 1
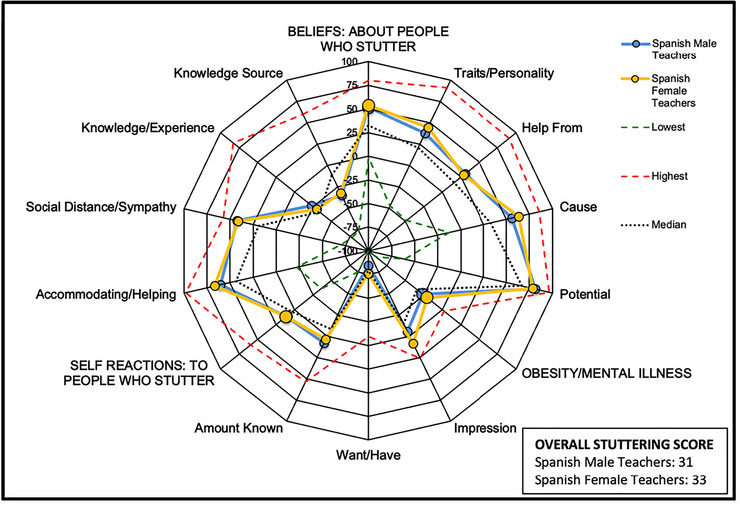 FIGURE 2
| Sociodemographic variables | Spanish sample data |
| Spanish sample percentile |
|---|---|---|---|
| Sample size | 250 | 60 | 92 |
| Completion time: mean (min) | 10.12 | 11 | 38 |
| Age: mean (yr) (SD) | 46.3 (11.04) | 36.9 | 92 |
| Born in Spain (% of total) | 95.6 | ‐ | ‐ |
| Years of completed studies: mean (yr) (SD) | 17.8 (2.26) | 14.3 | 92 |
| Sex: females (% of total) | 63.6 | 63.3 | 62.2 |
| Married (% of total) | 71.6 | 53 | 73 |
| Parent (% of total) | 60.8 | 49 | 68 |
| Teaching experience: mean (yr) (SD) | 16.55 (10,94) | ‐ | ‐ |
|
| Spanish sample mean rating |
| Spanish sample percentile |
|---|---|---|---|
| Number | 250 | 60 | 92 |
| Overall stuttering score (OSS) | 32 | 18 | 81 |
| Beliefs | 53 | 33 | 85 |
| Traits/Personality | 42 | 21 | 84 |
| Prone to self‐blame | 90 | 84 | 63 |
| Nervous or excitable | 31 | −3 | 78 |
| Shy or fearful | 6 | −17 | 76 |
| Who should help stuttering | 29 | 16 | 66 |
| Speech‐language pathologist | 97 | 95 | 69 |
| Others who stutter | 21 | −4 | 67 |
| Medical doctor | −31 | −39 | 51 |
| What causes stuttering | 61 | 33 | 90 |
| Genetic | −6 | 18 | 13 |
| Learning or habit | 50 | 26 | 88 |
| Emotionally traumatic experience | 61 | −2 | 95 |
| Act of god | 98 | 62 | 92 |
| Virus/Disease | 68 | 39 | 81 |
| Ghost/Demon/Spirit | 94 | 90 | 65 |
| Potential social professional success | 80 | 67 | 78 |
| Can make friends | 100 | 93 | 74 |
| Lead a normal life | 96 | 89 | 67 |
| Do any job they want | 80 | 54 | 85 |
| Should have a good judgement job | 44 | 42 | 47 |
| Self‐reactions | 11 | 3 | 66 |
| Accommodating/Helping | 64 | 44 | 83 |
| Try to act normally | 89 | 84 | 66 |
| I should help | 2 | −29 | 72 |
| Fill words | 66 | 35 | 77 |
| Say ‘slow down’ or ‘relax’ | 52 | 13 | 71 |
| Make a joke | 90 | 90 | 45 |
| Should hide stuttering | 87 | 76 | 70 |
| Social distance/Sympathy | 41 | 19 | 92 |
| Feel comfortable or relaxed | 38 | 37 | 51 |
| Feel pity for the person who stutters | 59 | 16 | 91 |
| Feel impatient | 66 | 63 | 50 |
| Concern if doctor stuttered | 86 | 46 | 94 |
| Concern if neighbour stuttered | 96 | 77 | 81 |
| Concern if sibling stuttered | 55 | 7 | 78 |
| Concern if I stuttered | 0 | −32 | 76 |
| Overall impression person who stutters | 23 | 2 | 82 |
| Want to be a person who stutters | −60 | −65 | 71 |
| Knowledge/Experience | −27 | −34 | 59 |
| Amount known | −23 | −31 | 53 |
| Persons known who stutter | −81 | −86 | 72 |
| Source: personal experience | 22 | 18 | 60 |
| Knowledge source | −33 | −11 | 9 |
| TV/Radio | −29 | 12 | 14 |
| −28 | −14 | 29 | |
| Internet | −49 | −27 | 16 |
| School | −4 | −8 | 42 |
| Specialists | −55 | −31 | 17 |
| Obesity/Mental illness | −23 | −35 | 83 |
| Impression | 4 | −15 | 84 |
| Obesity | 3 | −19 | 85 |
| Mental illness | 5 | −15 | 76 |
| Want/Have | −79 | −79 | 61 |
| Obesity | −78 | −78 | 63 |
| Mental illness | −81 | −80 | 55 |
| Amount known | 5 | −9 | 72 |
| Obesity | 9 | −1 | 62 |
| Mental illness | 2 | −21 | 77 |
| Significant variables |
| B |
|
| Tolerance | VIF | F |
|---|---|---|---|---|---|---|---|
| OSS | |||||||
| Received training | 0.126 | 9.415 | 0.261 | 4.266 | 0.940 | 1.064 | 12.990 |
| Teaching experience with students who stutter | 5.121 | 0.161 | 2.643 | 0.943 | 1.061 | ||
| Self‐identifying as people who stutter | 10.885 | 0.136 | 2.300 | 0.997 | 1.003 | ||
Peer Reviews
No public reviews on file for this paper yet. If you reviewed it on a platform where reviews are public (OpenReview, ICLR, NeurIPS, ICML), you can paste yours below so the community can read it here.
Videos
No videos yet. Explain this paper in a talk, walkthrough, or lecture? Add one.
Taxonomy
TopicsStuttering Research and Treatment · Phonetics and Phonology Research · Reading and Literacy Development
Introduction
1
Stuttering affects not only the fluency of speech, but also the quality of life of people who stutter, especially in the vitality, social functioning, emotional functioning and mental health status domains (Craig et al. 2009). Compared to nonstuttering peers, children and adolescents who stutter experience increased anxiety and depressive symptoms (Bernard et al. 2022; Briley et al. 2021), as well as increased rejection and bullying by classmates (Berchiatti et al. 2020; Langevin et al. 2009; Plexico et al. 2013). Relationships with teachers and peers, as well as academic performance at school, may be affected by stuttering (Klompas and Ross 2004). University students who stutter also report stories of dissatisfaction and lost opportunities in terms of social interactions, classroom engagement and performance (Meredith and Packman 2015).
The public view of stuttering is generally unfavourable. This fact has been widely documented across multiple age groups (Al‐Khaledi et al. 2009; Ezrati‐Vinacour et al. 2001; Flynn and St. Louis 2011), different professions (e.g., Abdalla and St. Louis 2012; Maviş et al. 2013) or diverse geographic locations (e.g., Arafa et al. 2021; Ip et al. 2012; St. Louis and Roberts 2013; St. Louis et al. 2016).
Widespread awareness of public attitudes toward people who stutter is imperative to develop strategies to reduce the impact that stereotypes have on their quality of life and overall health (Lefort et al. 2021). Teachers have the potential to mitigate negative experiences and create more comfortable and understanding environments (Arnold et al. 2015; Hearne et al. 2021; Plexico et al. 2013; Schwab and Rossmann 2020; Werle and Byrd 2021). Although teachers are often assumed to have satisfactory knowledge and encouraging attitudes toward their students with special needs, including those who stutter, previous literature indicates that teachers hold unsubstantiated beliefs about the causes of stuttering and pervasive negative stuttering stereotypes that could place students who stutter at an obvious disadvantage (Crowe and Walton 1981; Woods and Williams 1976; Yeakle and Cooper 1986).
Much of the latest literature that assesses teachers' public attitudes toward stuttering has used a standardized instrument known as the Public Opinion Survey on Human Attributes‐Stuttering (POSHA–S) 2011). The POSHA–S has been shown to have satisfactory internal consistency and is reliable, valid, and translatable, facilitating the comparison of its results across different studies (e.g., St. Louis 2012, 2014). Abdalla and St. Louis (2012) found that 471 Arab public‐school teachers, despite recognizing common stuttering traits and knowing people who stutter, were largely misinformed about its causes, held personality stereotypes and reported unsupported coping strategies. Abrahams et al. (2016) found that 469 African primary school teachers had knowledge gaps and held personality stereotypes about stuttering, but showed more positive attitudes regarding the potential of people who stutter and their reactions to it. Other studies using POSHA–S have not found large or significant differences in attitudes toward stuttering between the teaching and non‐teaching population (Arnold et al. 2015; Junuzović‐Žunić et al. 2023; Li and Arnold 2015). A recent study that analyzed nearly all the potential predictors of the POSHA–S from a database of more than 22 000 respondents found that summary scores for samples of teachers were only very slightly more positive than for the general public (St. Louis 2024a).
The literature referring to university professors is more limited and uses other assessment instruments. A study conducted by Dorsey and Guenther (2000) found that professors and university students perceive students who stutter as being more negative on most personality traits, compared to how they perceive non‐stuttering university students. Surprisingly, the professors turn out to be even more negative in their attitudes. The university student´s own experience appears to be consistent with this idea (Werle and Byrd 2021).
The landscape offered by the factors that contribute to teachers’ attitudes towards stuttering is heterogeneous, with some factors unstudied. These heterogeneous results can be the result of the diverse sample compositions with regard to regional and cultural variations as well as the specific teaching sample characteristics. Our goal is to enrich the field's state by clarifying the role of these relevant factors. That is the case for the role of sex favouring better attitudes in the case of women, with studies showing partial or no relationship (Arnold et al. 2015; Fichman et al. 2025; Li and Arnold 2015; Veerabhadrappa et al. 2025). This uncertainty holds also true for age and years of teaching experience, with studies showing positive (Almudhi 2022; Arnold et al. 2015; Li and Arnold 2015) or no relationship (Fichman et al. 2025; Valente et al. 2017; Veerabhadrappa et al. 2025). However, years of education do seem to exert a positive effect on teachers’ attitudes towards stuttering (Almudhi 2022; Arnold et al. 2015; Fichman et al. 2025; Li and Arnold 2015; Veerabhadrappa et al. 2025).
Experience with students who stutter usually exerts a positive influence (Abdalla and St. Louis 2012; Irani et al. 2012; Yeakle and Cooper 1986), although a recent study has not found this relationship (Veerabhadrappa et al. 2025). Consensus is more unambiguous in the case of the positive impact of training on stuttering (Arnold and Li 2016; Crowe and Walton 1981; Hearne et al. 2021; Panico et al. 2017; Yeakle and Cooper 1986). However, the scarcity of studies that have included specialist teachers (e.g., School Counsellors, School‐Based Speech‐Language Pathologists (SLPs) and Special Education Teachers), in addition to other traditionally included teaching roles (e.g., Early Childhood Education, Primary and High School Education) have not shown better attitudes towards stuttering (Lee 2014; Maviş et al. 2013).
The results of studies of teacher attitudes toward stuttering underscores the need to offer stuttering training and resources for teachers in order to dispel misconceptions about stuttering and, thereby, to enable greater support for students who stutter, both in schools (Abdalla and St. Louis 2012; Hearne et al. 2021; Jenkins 2010) and universities (Azios et al. 2022; Daniels et al. 2011; Werle and Byrd 2021).
St. Louis (2024b) found that different countries of the world were the strongest predictor of differences in stuttering attitudes, which were closely related to different languages and regions (e.g., North America or South Asia). To date, there are no published POSHA–S studies of teacher attitudes from Spain, indicating an important gap in the literature. Even though Western European summary attitudes, on average, were found to be among the most positive attitudes observed so far on the POSHA–S (St. Louis 2024b), wide differences have been found within various countries (St. Louis et al. 2016).
To address the need to sample teacher attitudes at various education levels, the main objective of this study was to examine the attitudes of teachers across different educational levels in Spain toward stuttering and to compare these attitudes with public attitudes documented in the POSHA–S database. Additionally, we aimed to explore whether various sociodemographic factors, including demographic characteristics and education and experience related to stuttering, are associated with the attitudes of teachers in Spain toward this condition, as well as the explanatory power of these variables.
Methods
2
Design
2.1
A cross‐sectional self‐report design was used, with a sample of teachers from various educational levels throughout Spain. Purposive sampling was used to identify potential study participants.
Participants
2.2
Data were collected across all regions of Spain. Teachers were eligible to participate in the research if they met the following inclusion criteria: (a) be teachers of any official educational centre regardless of teaching role or educational level, including early childhood, primary/elementary, high school, vocational training, official language school, conservatory or arts education, adult education centres, universities or school counsellors; (b) be actively working; (c) be between 18 and 70 years of age; (d) be fluent in Spanish and (e) consent voluntarily to participate in the study.
It was calculated that a minimum sample of 235 teachers (with a significance level of 0.05 and a statistical power of 90%) would be needed to analyze attitudes toward stuttering and knowledge and self‐reactions toward stuttering, respectively. The minimum calculated sample size was reached, obtaining a total of 250 participants.
Procedure
2.3
Potential participants were reached through multiple channels. An email was sent to numerous and diverse educational centres throughout Spain in which teachers were asked to participate. In addition, it was advertised on social networks, and respondents were encouraged to forward it to other participants following a snowball sample collection method. Data was registered between May and June 2023.
Instruments
2.4
Two instruments were utilized in the study:
Sociodemographic Variables Questionnaire
2.4.1
The instrument gathered information on participants’ demographics (age, sex, birthplace, years of completed studies [total number of formal academic years completed], marital status) and professional background (teaching experience, type of school and current teaching role). Finally, participants were asked about their teaching experience with students who stutter, any training they had received on stuttering, and whether they believed such training should be provided, using a 5‐point Likert scale.
The Public Opinion Survey of Human Attributes‐Stuttering (POSHA–S)
2.4.2
As noted, the POSHA–S is a standardized instrument that measures public attitudes toward stuttering (St. Louis 2011). This study used a Spanish version of the POSHA–S. Following a process similar to other studies (e.g., Przepiorka et al. 2013) the first and corresponding authors, both native Spanish speakers, independently translated the survey and refined it collaboratively. A native translator back‐translated it into English to compare with the original, revealing no significant differences in meaning. The final Spanish version was tested with ten teachers, who reported no issues with item comprehension or the survey procedure. The POSHA–S is composed of three sections: (1) a demographic section; (2) a general section comparing stuttering with four other attributes (intelligent, left‐handed, mentally ill and obese) and (3) a detailed section on stuttering. All scale ratings are converted to a range of –100 to +100 scale. Lower scores reflect less accurate, sensitive or worse informed attitudes and higher scores reflect more accurate, sensitive or well‐informed attitudes. The POSHA–S is evaluated by calculating means for each item, means of groups of items that represent different components, which are then averaged into three subscores. Two subscores focus on stuttering, and one is dedicated to obesity and mental illness. The Overall Stuttering Score (OSS) is obtained by averaging the two subscores related to stuttering, Beliefs and Self‐Reactions (St. Louis 2011). A POSHA–S database of samples around the world permits comparison of individual samples to what can be regarded as a worldwide average (St. Louis 2024a). Typically, an investigator's sample means are compared to the database average (i.e., median of all the sample means to reduce the effect of outlier samples) and the percentile ranking of the investigator's means relative to all the database sample means. At the time of this study, 230 samples representing 20 941 respondents from 48 countries and 30 languages comprised the comparison average.
Data Analysis
2.5
Data was analyzed with the Statistical Package for Social Sciences (SPSS 25.0).
Descriptive statistics were calculated for sociodemographic variables, including means and standard deviations for continuous variables and frequencies and percentages for categorical variables. To examine differences in POSHA‐S scores, univariate analyses were conducted. For comparisons between two groups, Student's t‐tests were used when data met normality assumptions, and Mann‐Whitney U tests when they did not. For comparisons among three or more groups, one‐way ANOVAs were used, with Kruskal–Wallis tests as the non‐parametric alternative when assumptions of normality or homogeneity of variance were violated. Pearson correlations were used to assess linear associations between continuous variables, and Spearman correlations were applied when variables did not meet parametric assumptions.
Three multiple linear regression models were tested, including as explanatory variables the sociodemographic variables and as criterion variable (dependent variable) the OSS, Beliefs and Self‐Reactions, respectively, in each model. The sociodemographic variables included: self‐identification as a person who stutters, having received training in stuttering, having teaching experience with students who stutter, teaching experience (years), current teaching role, age, sex, years of completed studies and familiarity with people who stutter (categorized according to Arnold et al. 2015). Current teaching role was grouped for analysis based on professional training and likely exposure to communication disorders, which were considered most relevant to attitudes toward stuttering (i.e., (1) Other types of teaching, (2) School Counselors, and (3) School‐Based Speech‐Language Pathologists [SLPs] and Special Education Teachers).
Significant explanatory variables were entered into stepwise multiple regression models to identify the best combination of predictors for OSS, Beliefs and Self‐Reactions scores. Model fit was assessed using Adjusted R‐squared (Adjusted R ^2^). An ANOVA of the regression model was conducted to test if the estimation of the dependent variable was significantly improved. For each explanatory variable, the coefficients of the regression model and the t scores were calculated to ensure that the variable contributed significantly to the regression model. The variance‐inflation factor (VIF) and the tolerance were calculated in each model to assess the assumption of non‐multicollinearity.
Data Sharing
2.6
The data that support the findings of this study are available from the corresponding author upon reasonable request.
Results
3
Sociodemographic Information
3.1
Table 1 presents the sociodemographic results for the 250 teachers who participated in the study (column 2). The average age of the sample was 46.33 years (SD = 11.04), with a greater proportion of women (n = 159, 63.6%). The mean number of years of teaching experience was 16.55 (SD = 10.94). There was a variety in the current teaching role (self‐reported). Most participants lacked teaching experience with people who stutter (67.6%) and had not received related training (74.8%), yet the majority agreed (61.6%) or strongly agreed (24.8%) that such training should be provided.
Table 1 also compares these results to data from the 230 different samples that comprise the POSHA–S database (St. Louis 2024a). Column 3 presents the median, or middle sample mean, from the database, while column 4 shows percentiles for the Spanish sample generated from the POSHA–S database.
Teachers in Spain´s Attitudes Toward Stuttering
3.2
Table 2 presents the POSHA–S scores, including the items, components, subscores and Overall Stuttering Score (OSS) for teachers in Spain (column 2). It also shows the average values (median of all sample means) in the POSHA–S database (St. Louis 2011, 2024a) (column 3) and the percentiles for the teachers in Spain relative to all of the POSHA–S database samples (column 4). The teachers’ OSS of 32 (81st %ile) is well above the database average of 18. This score is calculated by averaging the Beliefs subscore (M = 53, 85th %ile) and Self‐Reactions subscore (M = 11, 66th %ile).
The Beliefs subscore stands out for demonstrating higher scores in both the overall score and its four components, which reflects more accurate beliefs of participants. Most individual items within this subscore are positive, although a few exceptions are noteworthy. In the What causes stuttering component, participants are unlikely to attribute stuttering to genetic causes (M = –6, 13rd %ile).
Regarding the Self‐Reactions subscore, the Spanish sample's scores were higher in three of the four components: Accommodating/Helping, Social Distance/Sympathy and Knowledge/Experience (M = 64, 83th %ile; M = 41, 92nd %ile and M = –27, 59th %ile, respectively), not so for the Knowledge Source component (M = –33, 9th %ile); specifically, the sources of knowledge of the participants in this sample were below average in relation to school, publications, specialists, Internet and TV/radio. The Accommodating/Helping component reflects more sensitive attitudes toward people who stutter and stuttering compared to average attitudes in the database. Results indicate that, in an interaction with people who stutter, participants would be less likely to complete their words (M = 66, 77th %ile), to say phrases such as ‘slow down’ or ‘relax’ (M = 52, 71st %ile) or to consider that they should hide their stuttering (M = 87, 70th %ile). Furthermore, although the mean score is close to neutrality (M = 2), participants show a greater willingness to help people who stutter (72nd %ile). Similarly, the Social Distance/Sympathy component reflects more positive affective reactions toward people who stutter and stuttering. Participants in the Spanish sample are less likely to feel sorry or pity for the person who stutters (M = 59, 91th %ile), as well as to show concern if the person who stutters is a doctor, neighbour, sibling or oneself (M = 86, 94th %ile; M = 96, 81st %ile; M = 55, 78th %ile; M = 0, 76th %ile; respectively). Also, the overall impression of people who stutter is more positive (M = 23, 82n^d^ %ile). Finally, with regard to the Knowledge/Experience component, the item relating to known people who stutter stands out, given that, despite having a low absolute value (M = –81), it has a relatively high value compared to the database, standing at the 72nd %ile. The item relating to the amount of knowledge about stuttering shows a mean score of M = –23, standing at the 53rd %ile.
Figure 1 shows the teachers in Spain data through a radial graph, which provides a visual display of the components and subscores along with a numerical OSS. These data are compared with the maximum, minimum and average (median of all sample means) scores observed to date for the sample that constitutes the POSHA–S database (St. Louis 2011, 2024a).
Summary of POSHA‐S radial graph for the teachers in Spain sample in comparison to the lowest, average and highest scores in the POSHA‐S database (St. Louis 2024a).
Comparisons of Teachers' Attitudes in Spain Toward Stuttering According to Sociodemographic Variables
3.3
No statistically significant sex differences were found for the OSS (p = 0.545) or the Self‐Reactions subscore (p = 0.962), with men and women showing similar mean values (Figure 2). Non‐parametric analyses also indicated no differences in the Beliefs subscore (p = 0.181). However, women presented significantly more accurate or positive attitudes in the Cause (p = 0.009) and Accommodating/Helping (p = 0.040) subscores (Table S1, Supporting Information 1).
Comparison of POSHA–S scores by gender among teachers in Spain, in contrast with the lowest, average and highest scores from the POSHA–S database (St. Louis 2024a).
Regarding age, education and teaching experience, correlation analyses (Pearson and Spearman) revealed few significant associations. Age correlated negatively with the Help from component (r = −0.185; p = 0.003) and positively with Knowledge/experience (r = 0.156; p = 0.014). Years of education were negatively correlated with the Cause component (r = −0.156; p = 0.014), indicating that higher education levels were associated with lower accuracy in causal attributions. Teaching experience correlated positively with Knowledge/experience (r = 0.175; p = 0.006), suggesting greater accuracy in self‐perceived knowledge of stuttering with more years of teaching experience. All observed correlations were of low magnitude (Table S2).
Comparisons by teaching experience with students who stutter and training in stuttering (Student's t and Mann–Whitney U; Table S3) showed that teachers without experience or training obtained significantly lower OSS, Self‐Reactions and Knowledge/experience scores, among others (all p < 0.001). Participants identifying themselves as stutterers reported higher OSS (p = 0.017) and Beliefs (p = 0.003) scores.
Finally, an ANOVA by current teaching role (Other types of teaching, School Counsellors and School‐Based Speech‐Language Pathologists [SLPs] and Special Education Teachers) revealed significant group differences for OSS (F = 7.818; p = 0.001) and Self‐Reactions (F = 9.623; p < 0.001), with counsellors and specialists showing more positive attitudes. Kruskal–Wallis tests also identified significant effects for Cause (p = 0.021), Accommodating/Helping (p = 0.005) and Knowledge Source (p < 0.001), with higher scores among specialists and counsellors compared with other teachers (Table S4).
Explanatory Power of the Sociodemographic Variables on OSS, Beliefs and Self‐Reactions
3.4
Regarding the multiple regression analysis, the variable that best explained the OSS was ‘Received training in stuttering’, followed by ‘Teaching experience with students who stutter’ and ‘Self‐identifying as a person who stutters’. The remaining variables were not included in the final model because they did not significantly increase their explanatory power. For the multiple regression model tested, with three independent variables, 14% of the variance of the OSS was explained. The ANOVA of the regression model showed a significant effect (F (3, 249) = 12.990; p < 0.001). Regarding the coefficients of the regression model, t‐tests indicated that the variables included by the method contributed significantly to the regression model. The VIF, as well as the tolerance value, indicated that the assumption of non‐multicollinearity was met (Table 3).
The Beliefs subscore was explained only by ‘Self‐identifying as a person who stutters’. For the multiple regression model tested, with one independent variable, 3% of the variance of Beliefs was explained. The ANOVA of the regression model showed a significant effect (F (1, 249) = 7.366; p = 0.007). The variable that better explained the Self‐Reactions subscore was ‘Received training in stuttering’, followed by ‘Teaching experience with students who stutter’ and ‘Current teaching role’. For the multiple regression model with three independent variables, 16% of the variance of Self Reactions was explained. The ANOVA of the multiple regression model showed a significant adjustment (F = 33.18; p < 0.001). For the coefficients of the multiple regression model, the t scores indicated that the variables considered contributed significantly to explaining the variance of Self Reactions. The VIF as well as the tolerance values indicated that the assumption of non‐multicollinearity was met (see Table 3).
Discussion
4
Teachers in Spain´s Attitudes Toward Stuttering
4.1
In this study, we analyzed the attitudes toward stuttering of 250 teachers from various educational levels in Spain using POSHA–S. Overall, our sample of teachers held better attitudes toward stuttering than previous studies (Abdalla and St. Louis 2012; Abrahams et al. 2016; Junuzović‐Žunić et al. 2023; Lefort et al. 2021) for all three subscores of the POSHA–S, that is, Beliefs, Self‐Reactions and Obesity/Mental Illness, placing them in the fourth or highest quartile of the POSHA–S database. This finding seems to contradict previous literature showing that teachers' perceptions toward stuttering did not differ from the non‐teaching population (Abdalla and St. Louis 2012; Arnold et al. 2015; Junuzović‐Žunić et al. 2023; Lee 2023; Li and Arnold 2015) and could constitute further evidence of regional or cultural differences as one of the most important determinants of attitudes toward stuttering (Abdalla and St. Louis 2012; Irani et al. 2012; St. Louis and Roberts 2013). Another reason for these better attitudes could be due to the inclusion in our study, although in a small proportion, of School Counsellors and School‐Based Speech‐Language Pathologists and Special Education Teachers, in addition to other studies’ traditionally included teaching roles (e.g., Early Childhood Education, Primary and High School Education).
Compared to the POSHA–S database, our data showed that teachers in Spain were especially positive on the Beliefs subscore and better than the database average on the Self‐Reactions subscore. This finding supports studies that reported a positive relationship between the Beliefs and Self‐Reactions subscores (Arnold and Li 2016, St. Louis 2024b).
Regarding the Beliefs subscore, although our teachers’ ratings of the component of Traits/Personality and all its items, were more positive than those in the POSHA–S database, teachers still substantially shared common prejudices about students and others who stutter as being nervous or shy. These traits are usually considered by teachers as the result of their stuttering, leading teachers not to consider stuttering a problem in the case of other students who participate or ask questions regularly in the classes (Adriaensens and Struyf 2016). Our sample attributed a genetic cause to stuttering, which reflects current research consensus (Adriaensens and Struyf 2016; Hearne et al. 2021; Irani et al. 2012; Lefort et al. 2021; Panico et al. 2018; Yeakle and Cooper 1986), to a lesser extent than other causes. We submit that this may be due to a resistance related to incorrect notions about non‐modifiable genetic factors and lack of knowledge about permeable gene‐environment interactions (Condit 2010). Moreover, this misconception could have harmful effects on students who stutter, since external locus of control, such as genetic and biological causes have been related to more positive attitudes toward stuttering in terms of less likelihood that people who stutter are to be blamed for their stuttering and favouring better Accommodating/Helping Reactions (Abasi 2022; Arnold and Li 2016; Boyle 2016). Finally, although teachers in Spain disregarded in a greater proportion incorrect aetiologies of stuttering comparing to the POSHA–S database, a considerable proportion of them still thought that stuttering is learned, caused by an emotionally traumatic experience, or is a symptom of a virus or disease.
In the Helping component, although teachers in Spain were more likely to believe that professionals such as speech‐language pathologists and other people who stutter can help in the treatment of stuttering compared to the POSHA–S database participants, they still considered doctors as adequate to deal with this problem, which could be interpreted as a lack of knowledge. Finally, the scores at the Potential component are revealing. Although teachers conceived people who stutter can do any job they want, they limited a stuttering person's potential when it comes to jobs that are demanding. This finding is worrying since this component has been associated with Accommodating/Helping Reactions and Social Distance/Sympathy (Arnold and Li 2016) and is related to role‐entrapment, according to which, teachers may be acting upon paternalism by their own idea of what is best for people who stutter without consulting them (Irani et al. 2009).
Regarding the Self‐Reactions subscore, in the Accommodating/Helping component, teachers in Spain held worse attitudes on the item ‘If I was talking with a person who stutters, I would make a joke’, than other studies reporting even less positive OSSs (e.g., Abdalla and St. Louis 2012). Our Spanish sample seemed more prone to use humour, again reflecting a possible lack of knowledge. Furthermore, although the teachers had better attitudes on the remaining items, a substantial proportion would tell a person who stutters to slow down or relax. This also holds true in the Social Distance/Sympathy component, in which, although they were more positive compared with the POSHA–S database, many teachers felt uncomfortable when talking with someone who stutters. Most strikingly, our sample was among the worst in the POSHA–S database regarding the component Knowledge Source, in which teachers in Spain seemed to totally lack sources of information about stuttering. Overall, the lack of knowledge and sources of information about stuttering seems incongruent with rising prevalence rates of students who stutter (Craig and Tran 2005). On the contrary, it would be expected that as a problem becomes more important, the attention given to it in terms of the number of sources of information and knowledgeable teachers should be proportionate. This result could be indicative of the little attention paid to this human attribute, as well as being a contributor to teachers’ belief that, in the case of stuttering, it is better not to react, not to pay attention or to talk about it at all (Adriaensens and Struyf 2016). It is also congruent with SWS regard of school as less supportive than family, workers, bosses or the media (St. Louis et al. 2017).
Comparisons of Teachers' Attitudes in Spain Toward Stuttering According to Sociodemographic Variables
4.2
Apart from the description of the characteristics of our sample, the literature shows interest in considering the associative value of some variables. Up to now, there has been a discrepancy about the role of sex. Our results align with other studies, that is, partial or no relationship at all (Arnold et al. 2015; Chon 2016; Lefort et al. 2021; Li and Arnold 2015). This apparent lack of agreement toward the role of sex has been justified by the diverse occupations of the samples or differences depending on the sex of the people who stutter (St. Louis 2012).
As to the variables age, years of education and years of teaching experience, in general, the observed correlations with the different subscores and components of the POSHA–S were low. That said, significant correlations occurred in some cases. Specifically, the component Knowledge/Experience showed a positive relationship with age and teaching experience. Hence, in line with other studies (Almudhi 2022; Arnold et al. 2015; Chon 2016; Li and Arnold 2015), as teachers become older and have more years of teaching experience, they report more knowledge about stuttering and know more people who stutter and have more personal experience with them. However, age did not always exert a positive influence on attitudes toward stuttering, as could be seen from the significant relationship found with the Helping component, wherein older teachers held less accurate views about which people should help people who stutter. In the case of the Causation component, years of education were also significantly correlated with less accurate stuttering attitudes, that is, ignoring the relevance of genetic contributions, as seen in other studies (Arnold et al. 2015; Almudhi 2022; Lee 2023; Lefort et al. 2021; Li and Arnold 2015; Valente et al. 2017). This could imply a reluctance to consider constitutionally based causal factors favouring a priori (or more favourable) aetiology such as modifiable environmental factors, as mentioned above.
Regarding the variable of teaching experience with students who stutter, a large proportion of the teachers in our sample reported having no experience teaching students who stutter, which is considered a limiting factor in the development of accurate or sensitive attitudes toward students' stuttering (Abdalla and St. Louis 2012; Boyle 2016; Irani et al. 2012; Lee 2023; Yeakle and Cooper 1986). In fact, in our study, it was observed that those teachers who had no teaching experience with students with stuttering had less accurate or sensitive scores on OSS, Self‐Reactions, Knowledge/Experience and Source of Knowledge. The same pattern, including also the Causation and Accommodating/Helping components, was obtained for those teachers who had not received training in stuttering, who were most of the participants, although they valued the importance of receiving such training. According to the literature, prior knowledge and training on stuttering play an important role in teachers' perceptions of people who stutter (Arnold and Li 2016; Crowe and Walton 1981; Daniels et al. 2011; Hearne et al. 2021; Panico et al. 2018; Woods and Williams 1976; Yeakle and Cooper 1986). On the other hand, as expected, those participants who self‐identified as people with stuttering scored more accurately on OSS and Beliefs, but not on Self‐Reactions. This could reflect a pattern by which external beliefs about other people who stutter are more positive than when it comes to internal self‐reactions about own behaviours, feelings, thoughts and knowledge in front of people who stutter (St. Louis et al. 2016). Finally, if we consider the ‘Current teaching role’, specialist teachers, such as School Counsellors, School‐Based Speech‐Language Pathologists (SLPs) and Special Education Teachers, showed better attitudes toward stuttering than preschool, primary or higher education teachers. Although this finding may seem expected, this has not always been the case (Lee 2014; Maviş et al. 2013).
Explanatory Power of the Sociodemographic Variables on OSS, Beliefs and Self‐Reactions
4.3
Finally, the variables that showed the strongest correlation with more positive attitudes toward stuttering and were included in the explanatory model, were the ones that are most specifically related to experience and knowledge about stuttering, that is, ‘Received training in stuttering’, ‘Teaching experience with students who stutter’, ‘Self‐identifying as a person who stutters’ and ‘Current teaching role’. Accordingly, training in stuttering and teaching experience with stuttering have been shown to be predictors of both the OSS and the Self‐Reactions subscore. Another important predictor of Self Reactions was the above‐mentioned ‘Current teaching role’. Hence, together with extensive literature as we analyzed before, we can say that receiving training and having experience with stuttering are paramount factors in tackling stuttering by making teachers better able to help people who stutter. Self‐Identifying as a person who stutters was also present in the model of the OSS and was the only variable that remained significant in the model for the Beliefs subscore. We hypothesized that teachers who self‐identified with people who stutter were better able to resist prejudices about traits and causes of stuttering, although they still found it hard when it comes to transferring these more positive beliefs to their own Self Reactions (St. Louis et al. 2016).
Limitations, Strengths and Future Directions
4.4
Our study had some limitations as well as strengths. The unequal sample sizes for the various subsamples was a limitation; however, our overall sample size was similar to other related studies (Abdalla and St. Louis 2012; Arnold et al. 2015; Irani et al. 2009, Irani et al. 2012; Li and Arnold 2015; Panico et al. 2018) and larger than the mean in the POSHA–S database, that is, 118 (St. Louis 2024a). Another limitation concerns the mode of sampling, that is, a convenience sample rather than a probability sample (e.g., Valente et al. 2017). These and the self‐reported nature of the different measures may have affected inference and generalization. The other limitation was that a bigger proportion of teachers in our sample belonged to the higher education level, although according to other studies, this may not be relevant since they hold similar views Panico; Werle and Byrd 2021). On the other hand, our study had the strength of considering a hitherto unstudied population, namely, teachers in Spain. To our knowledge, this was the first study that aimed to analyze the explanatory power of sociodemographic variables in the attitudes toward stuttering phenomena in this population. Future research should include bigger probability sampling, as well as longitudinal and qualitative measures (Abrahams et al. 2016; Lefort et al. 2021; Li and Arnold 2015). Moreover, from our perspective, additional comparative regional samples of more modest size would be required in countries that have not yet been studied, or in those where the literature suggests potential differences. This line of research could be helpful in clarifying the rationale for the better attitudes observed in our sample of teachers in Spain.
Conclusion
5
As a conclusion, although more positive attitudes toward stuttering were found in the case of teachers in Spain, prejudices did exist, and consequently, people who stutter quality of life may be compromised. Misconceptions concerning the ignorance about the genetic causes of stuttering, the regard of people who stutter as nervous and shy, the perceived limited potential of people who stutter to implement demanding jobs, behaviours such as saying ‘slow down’ or ‘relax’ when talking with people who stutter, or the lack of sources of information, have for long been observed in the stuttering literature, as well as its damaging consequences (Plexico et al. 2013). The practical implications that emerge from our results are that training and experience are important predictors of stuttering attitudes. This finding involves the need to escalate stuttering in the agenda of SEN priorities by education authorities and to develop training programs to counteract teachers’ beliefs about stuttering that take into consideration cultural variations (Abdalla and St. Louis 2012; Abrahams et al. 2016; Adriaensens and Struyf 2016) and that should include evidence‐based knowledge about stuttering as well as sharing experience with people who stutter (Arnold and Li 2016; Junuzović‐Žunić et al. 2023).
Ethics Statement
The study was carried out in accordance with national and international ethical standards (Helsinki and Tokyo Conventions) and was approved by the Aragón Research Ethics Committee (PI23/258).
Conflicts of Interest
The authors declare that there is no conflict of interest in the terms specified by this journal.
Supporting information
Supplementary Table
- Comparisons of Spanish teachers' attitudes towards stuttering according to sex.; Supplementary Table
- Comparisons of Spanish teachers' attitudes towards stuttering according to age, years of completed studies and years of teaching experience; Supplementary Table 3. Comparisons of Spanish teachers' attitudes towards stuttering according to teaching experience with PWS, having received training, identifying themselves as stutterers; Supplementary Table 4. Comparisons of Spanish teachers' attitudes towards stuttering according to current teaching
The reference list from the paper itself. Each links out to its DOI / PubMed record.
- 1Abasi, C. 2022. “The Science Behind Stuttering: Reducing Stigma and Public Misconceptions.” Macksey Journal. 3, Article 60. https://mavmatrix.uta.edu/honors_spring 2022/56.
- 2Abdalla, F. A. , and K. O. St. Louis . 2012. “Arab School Teachers' Knowledge, Beliefs and Reactions Regarding Stuttering.” Journal of Fluency Disorders 37, no. 1: 54–69. 10.1016/j.jfludis.2011.11.007.22325922 · doi ↗ · pubmed ↗
- 3Abrahams, K. , M. Harty , K. O. St. Louis , L. Thabane , and H. Kathard . 2016. “Primary School Teachers' Opinions and Attitudes Towards Stuttering in Two South African Urban Education Districts.” South African Journal of Communication Disorders = Die Suid‐Afrikaanse Tydskrif Vir Kommunikasieafwykings 63, no. 1: e 1–e 10. 10.4102/sajcd.v 63i 1.157.PMC 584323027796099 · doi ↗ · pubmed ↗
- 4Adriaensens, S. , and E. Struyf . 2016. “Secondary School Teachers' Beliefs, Attitudes, and Reactions to Stuttering.” American Journal of Speech‐Language Pathology 25: 1–15. 10.1044/2016.27071027 · doi ↗ · pubmed ↗
- 5Al‐Khaledi, M. , M. Lincoln , P. Mc Cabe , A. Packman , and T. Alshatti . 2009. “The Attitudes, Knowledge and Beliefs of Arab Parents in Kuwait About Stuttering.” Journal of Fluency Disorders 34, no. 1: 44–59. 10.1016/j.jfludis.2009.02.003.19500714 · doi ↗ · pubmed ↗
- 6Almudhi, A. 2022. “Investigating the Beliefs and Attitudes of Teachers Towards Students Who Stutter.” South African Journal of Education 42, no. 3: 1–15. 10.15700/saje.v 42n 3a 2093. · doi ↗
- 7Arafa, A. , S. Senosy , H. A. Sheerah , and K. St. Louis . 2021. “Public Attitudes Towards People Who Stutter in South Egypt.” P Lo S ONE 16, no. 2: e 0245673. 10.1371/journal.pone.0245673.33539373 PMC 7861357 · doi ↗ · pubmed ↗
- 8Arnold, H. S. , and J. Li . 2016. “Associations Between Beliefs About and Reactions Toward People Who Stutter.” Journal of Fluency Disorders 47: 27–37. 10.1016/j.jfludis.2015.12.004.26897496 · doi ↗ · pubmed ↗