The evolution of trends and technology in wearable sensors used to detect falls in people with neurodegenerative diseases: a systematic review
Yuanzheng Chen, Tinghuai Huang, Zijie Lin, Quan Zhou

TL;DR
This review examines how wearable sensors have evolved to detect falls in people with neurodegenerative diseases, focusing on trends in sensor types and algorithms.
Contribution
The study provides a systematic review of wearable sensor technologies for fall detection in neurodegenerative disease patients, highlighting trends and gaps.
Findings
Most studies focused on Parkinson’s disease patients, with a preference for ankle-mounted sensors and machine learning algorithms.
Accelerometers and gyroscopes are commonly used, and SVM is the most popular algorithm for fall detection.
Future research should expand to other neurodegenerative diseases and adopt standardized testing environments.
Abstract
Neurodegenerative diseases (NDs) are a significant threat to human health. Numerous research demonstrated that patients with NDs might present with decreased balance, which is responsible for an increased risk of falling. As an emerging technology, wearable devices can detect falls and prevent privacy breaches. To access the evolution of trends and technology in wearable devices to detect falls among patients with NDs. We screened PubMed and Web of Science (February 2023) to summarize the pathway of fall detection with any body-worn sensor. Included articles were required to be full-text and published in English. Documents were excluded if they; (1) only used wearable devices for fall cueing, (2) did not offer sufficient information for data extraction, (3) did not use patients with NDs, (4) only used non-wearable sensors or devices. The review identified 89 articles at the end of…
Genes, proteins, chemicals, diseases, species, mutations and cell lines named across the full text — each resolved to its canonical identifier and authoritative record.
Click any figure to enlarge with its caption.
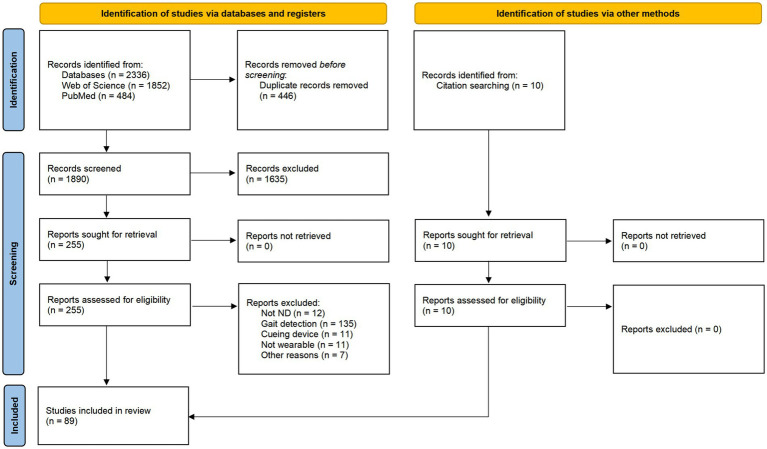 Figure 1
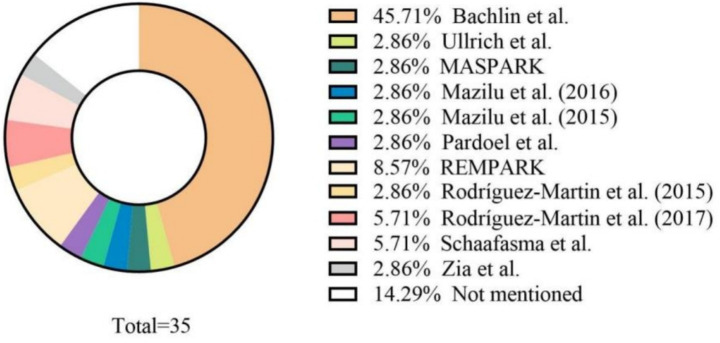 Figure 2
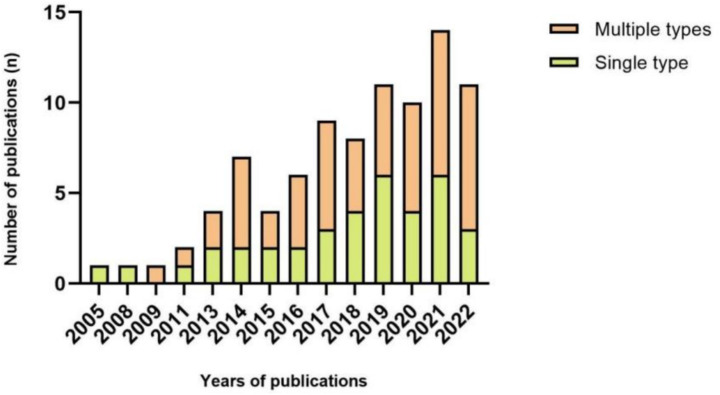 Figure 3
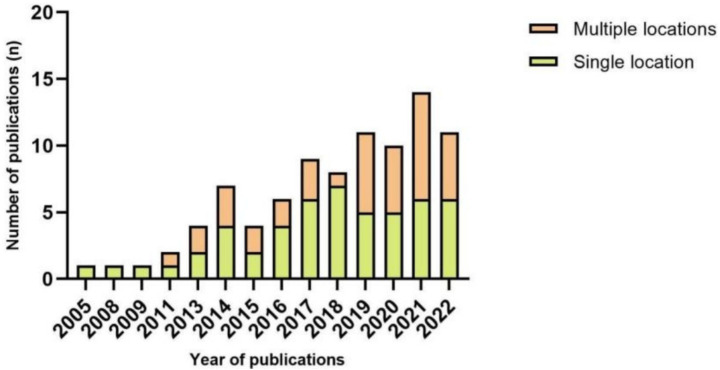 Figure 4
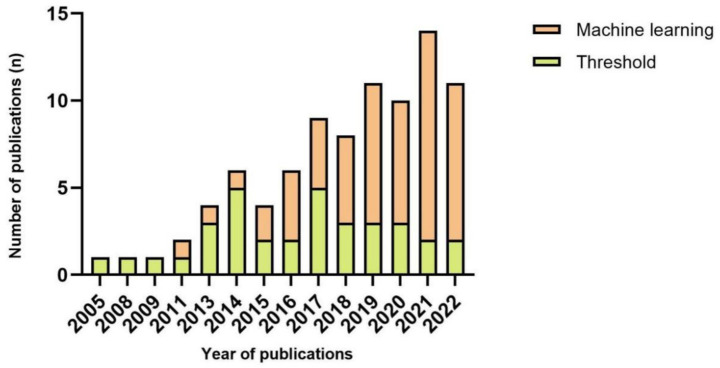 Figure 5
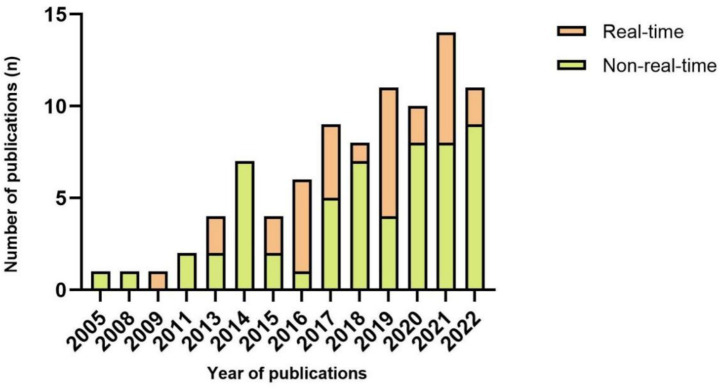 Figure 6
| Database | Search string | Records |
|---|---|---|
| Web of Science | #1:(((((((((((((((((((((TS = (Parkinson*)) OR TS = (PD)) OR TS = (Paralysis Agitans)) OR TS = (Alzheimer)) OR TS = (ATD)) OR TS = (Dementia, Senile)) OR TS = (Senile Dementia)) OR TS = (Primary Senile Degenerative Dementia)) OR TS = (Dementia, Primary Senile Degenerative)) OR TS = (Dementia, Presenile)) OR TS = (Presenile Dementia)) OR TS = (Sclerosis, Amyotrophic Lateral)) OR TS = (ALS)) OR TS = (Gehrig’s Disease)) OR TS = (Gehrig Disease)) OR TS = (Gehrigs Disease)) OR TS = (Charcot Disease)) OR TS = (Guam Disease)) OR TS = (Disease, Guam)) OR TS = (motor neuron diseases)) OR TS = (Lou-Gehrigs Disease)) OR TS = (Disease, Lou-Gehrigs) | 1,852 |
| #2: (TS = (fall*)) OR TI = (fall*) | ||
| #3: (((((TS = (sensor*)) OR TI = [13]) OR TS = (wearable*)) OR TI = (wearable*)) OR TS = (device*)) OR TI = (device*) | ||
| #1 AND #2 AND #3 | ||
| PubMed | #1: “parkinson*”[Title/Abstract] OR “PD”[Title/Abstract] OR “paralysis agitans”[Title/Abstract] OR “alzheimer*”[Title/Abstract] OR “ATD”[Title/Abstract] OR “dementia senile”[Title/Abstract] OR “senile dementia”[Title/Abstract] OR “primary senile degenerative dementia”[Title/Abstract] OR “dementia primary senile degenerative”[Title/Abstract] OR “dementia presenile”[Title/Abstract] OR “presenile dementia”[Title/Abstract] OR “amyotrophic lateral sclerosis”[Title/Abstract] OR “sclerosis amyotrophic lateral”[Title/Abstract] OR “ALS”[Title/Abstract] OR “motor neuron diseases”[Title/Abstract] OR “gehrig s disease”[Title/Abstract] OR “gehrig disease”[Title/Abstract] OR “charcot disease”[Title/Abstract] OR “guam disease”[Title/Abstract] OR “disease guam”[Title/Abstract] | 484 |
| #2: “fall*”[Title/Abstract] | ||
| #3 “wearable*”[Title/Abstract] OR “sensor*”[Title/Abstract] OR “device”[Title/Abstract] | ||
| #1 AND #2 AND #3 |
| Author | Studied population | Type of sensor | Device location ( | Walking task | Method category | Classifier/model | Performance (reported metrics) | ON | OFF | Year | Real time | Source of dataset |
|---|---|---|---|---|---|---|---|---|---|---|---|---|
|
| 20 PD | Accelerometer; Gyroscope; Magnetometer | Waist (1) | Scripted activities simulating natural behavior at the patients’ home | Machine learning | SVM | Sensitivity: 92.3%; Specificity: 100.0% | – | – | 2016 | Y |
|
|
| 10 PD | Accelerometer; Gyroscope; Magnetometer | Head (1) | TUG | Threshold | – | Accuracy: 92.86% | – | Y | 2017 | Y | – |
|
| 51 PD | Accelerometer | Knee (2) | Walking task | Machine learning | Naïve Bayes, SVM, k-NN, Decision Tree | Accuracy: 89.139%; Sensitivity: 88.524%; Specificity: 88.769% | – | – | 2018 | N | – |
|
| 10 PD | Accelerometer | Lower back (1) | Walking task | Deep learning | Probabilistic neural networks, SVM | Sensitivity: 93% (4); Specificity: 91% (6) | Y | – | 2019 | Y |
|
|
| 10 PD | Accelerometer | Shank (1) | Unscripted and unconstrained activities of daily living in an apartment-like setting | Deep learning | LSTM, CNN | Window size of 3 | – | – | 2021 | N |
|
|
| 7 PD | Accelerometer | Sole (2) | The OLST at home as part of a serious game for balance training | Threshold | – | Discriminant validity: PD vs. non-PD OLST score(significant); The proposed OLST score has significantly differed between ground types | Y | – | 2016 | Y | – |
|
| 12 PD | Accelerometer; Force sensor; Bending sensor | Sole (2) | TUG | Threshold | – | A significant difference was found for three FSR and IMU and on FSR and IMU in the elderly population ( | – | – | 2020 | N | – |
|
| 11 PD | Accelerometer; Gyroscope | Wrist (1) | A series of walking task | Machine learning | Not specified | Leave-one-subject-out | – | – | 2021 | N | – |
|
| 11 PD | Accelerometer; Gyroscope; Magnetometer | Shin (2) | TUG standardized 7-m course | Machine learning | SVM, LDA | The implemented classification algorithm in patients on | Y | Y | 2021 | Y | – |
|
| 131 PD | Accelerometer; Gyroscope; Orientation sensor | FOG: waist (1) | LA test; Unscripted and unconstrained activity of daily living | Machine learning | SVM, k-NN, neural network, decision tree, linear regression | LA test AUC: 92% | – | – | 2019 | N | – |
|
| 21 PD | Accelerometer; Gyroscope; Magnetometer | Waist (1) | Walking task and dual task | Deep learning | CNN | Accuracy: 89.0%; Sensitivity: 91.9%; Specificity: 89.5% | Y | Y | 2018 | N | REMPARK |
|
| 20 PD | Accelerometer | Hip (1) | TUG and dual task | Threshold | – | Moore-Bächlin Algorithm: | – | – | 2016 | Y | – |
|
| 2 AD | Accelerometer | Upper back (1) | Free-living setting | Threshold | – | Sensitivity: 98.33%; Specificity: 97.77% | Y | – | 2013 | Y | – |
|
| 21 PD | Accelerometer; Gyroscope | Above the patellofemoral joint line (1) | Walking task and dual task | Machine learning | – | Error rate: 0%; Sensitivity: 100%; Specificity: 100% | – | – | 2019 | Y | – |
|
| 4 PD | Accelerometer; Gyroscope; Magnetometer | Shank (1) | Walking task with dual tasking | Threshold | – | Sensitivity: 79.5%; Specificity: not reported; Only number of falls positives: 13 vs.35 true positives | – | – | 2014 | N | – |
|
| 10 PD | Accelerometer; Electromyographic | Forearm accelerometer (1) | Unscripted and unconstrained activities of daily living in an apartment-like setting | Machine learning | Dynamic neural network, linear classifier | Sensitivity: 82.9%; Specificity: 97.3% | – | – | 2011 | N | – |
|
| 10 PD | Accelerometer | Back (1) | Walking task | Machine learning | k-NN | Sensitivity: 94.1%; Specificity: 97.1% | – | – | 2020 | Y |
|
|
| 28 PD | Accelerometer; Gyroscope | Shoes (2) | A series of walking tasks | Threshold | – | Reported correlation: %TF (daily living) vs. %TF (in-home off-med testing) was mild-to-moderate; no correlation with on-med testing or self-report | Y | Y | 2022 | Y | – |
|
| 10 PD | Accelerometer | Leg (2) | Walking task and dual task | Machine learning | LDA, CART, SVM, random forest | Accuracy: 89.94%; Sensitivity: 87.8%; Specificity: 93.02% | – | – | 2021 | N |
|
|
| 12 PD | Accelerometer; Gyroscope | Shank (2) | A series of walking tasks | Threshold | – | FOG-with-tremor accuracy: 100%; FOG-with-complete motor block accuracy: 100%; Normal stride accuracy: 95%; Short stride accuracy: 78%; Very short stride accuracy: 84%; Turning stride accuracy: 88% | – | Y | 2014 | N | – |
|
| 16 PD | Accelerometer | Shoe (2) | Walking task | Machine learning | SVM, AdaBoost classifiers | Sensitivity: 88.5% (5.8); Specificity: 83.3% (17.1); AUC: 92.8% (5.9) | – | – | 2021 | Y | – |
|
| 10 PD | Accelerometer | Ankle (1) | Walking task and dual task | Machine learning | SVM, artificial neural network | SVM accuracy: 87.5%; Neural network accuracy: 93.8% | – | – | 2021 | N |
|
|
| 10 PD | Accelerometer; Gyroscope; Magnetometer | Shank (1) | Walking task | Deep learning | LSTM | Sensitivity: 92.57%; Specificity: 95.62% | – | – | 2021 | N |
|
|
| 15 PD | Accelerometer; Gyroscope | Shank (2) | The free-living setting for 6 months | Threshold | –– | Accuracy: 73.33% | – | – | 2018 | N | – |
|
| 12 PD | Electroencephalography | Waist on L5 (1) | Two TUG tasks | Deep learning | LSTM | Cross-subject setting GM: 91.0% (3.5); | – | Y | 2022 | N | – |
|
| 10 PD | Accelerometer | Ankle (1) | Walking task and dual task | Machine learning | Time-varying autoregressive moving average model | Sensitivity: 99.20%; Specificity: 94.59%; Accuracy: (Average sensitivity: 96.86%, Specificity: 96.90%) | – | Y | 2019 | N |
|
|
| 10 PD | Accelerometer | Ankle (1) | Walking task and dual task | Machine learning | k-NN | FOG precision: 95.55% (4.60); Sensitivity: 94.97% (4.86); Specificity: 99.19% (0.85); F1 score: 95.25% (4.72); Accuracy: 98.92% (1.56); Pre of post FOG precision: 92.73% (10.15); Sensitivity: 91.5% (10.34); Specificity: 99.83% (0.32); F1-score: 92.10% (10.25) | – | – | 2021 | N |
|
|
| 16 PD | Electroencephalography | Head (1) | TUG on a standardized 5-m course | Machine learning | Optimal Bayesian neural network | Sensitivity: 85.86%; Specificity: 80.25% | – | – | 2018 | N | – |
|
| 5 PD | Sphygmomanometer; Smartwatch | Wrist (2) | Walking task | Machine learning | SVM, linear regression, neural network | Linear regression | – | – | 2016 | Y | – |
|
| 1 PD | Accelerometer; Gyroscope | Knee (1) | Walking task | Threshold | – | Average detection latency: 332 ms (max 580 ms) | – | – | 2009 | Y | – |
|
| 40 PD | Accelerometer; Gyroscope | Lower back (1) | Laboratory Walking tasks designed to provoke missteps; Home Participants worn the devices for 3 days during day time | Threshold | – | Criterion validity (lab) | Y | Y | 2014 | N | – |
|
| 15 PD | Accelerometer; Gyroscope | Waist (1) | Walking task and dual (single) task | Machine learning | AdaBoost. M1 classifier | Waist sensitivity: 86.0%; Waist specificity: 91.7%; Pocket sensitivity: 84.0%; Pocket specificity: 92.5% | – | – | 2015 | N | – |
|
| 32 PD | Accelerometer; Gyroscope | In the trouser pocket (1) | A series of walking tasks | Deep learning | CNN | Sensitivity: 93.8%; Specificity: 90.1% | – | – | 2018 | N | – |
|
| 32 PD | Accelerometer; Gyroscope | Shin (2) | Walking task | Threshold | – | Specificity: 97.57%; Sensitivity: 93.41%; Precision: 89.55%; Accuracy: 97.56% | – | – | 2017 | N | – |
|
| 20 PD | Accelerometer | Shoe (1) | Walking task | Threshold | – | Sensitivity: 86%; Specificity: 86% | Y | – | 2014 | N | – |
|
| 10 PD | Accelerometer | Thigh (1) | Walking task | Deep learning | LSTM | Sensitivity: 95.1%; Specificity: 98.8% | – | – | 2020 | N |
|
|
| 10 PD | Accelerometer | Ankle (1) | Walking task | Deep learning | Random forest, XGBoost, SVM, neural network | FOG sensitivity: 72.34%; FOG specificity: 87.36%; Transition sensitivity: 91.49%; Transition specificity: 88.51%; Normal activity sensitivity: 75.00%; specificity: 93.62% | – | Y | 2020 | N |
|
|
| Study I: 45 PD | Accelerometer; Gyroscope; Magnetometer | Study I: | Walking task | Threshold | Open-source algorithm | Rater 1: accuracy: 88%; sensitivity: 89%; specificity: 88%; false positive rate: 13%; false negative rate: 11%; AUC: 93% | – | Y | 2021 | N | – |
|
| 20 PD | Accelerometer; Plantar pressure sensors | Sole (2) | A series of walking tasks | Threshold | – | Accuracy: 90%; False positive rate: 6%; False negative rate: 4% | Y | Y | 2020 | N | – |
|
| 10 PD | Accelerometer | Thigh (1) | Walking task | Deep learning | Deep recurrent neural network, LSTM | Subject-independent: AUC 93%, Sensitivity 81%, Specificity 90%; Subject-dependent: AUC 97%, Sensitivity 87%, Specificity 96% | – | – | 2019 | N |
|
|
| 9 PD | Accelerometer | Ankle (2) | Free-living setting for 3 days | Machine learning | C4.5 pruned trees | (Performance NOT reported) | Y | – | 2015 | Y | – |
|
| 18 PD | Accelerometer; Gyroscope | Wrist (2) | A series of walking task | Machine learning | Supervised machine learning | Subject-dependent accuracy: 85%; Specificity: 80%; Subject-independent accuracy: 90%; Specificity: 66% | Y | – | 2016 | Y |
|
|
| 18 PD | Electrocardiography; Skin-conductance | Chest (1) | Ziegler protocol, | Threshold | – | Predicting accuracy: 71.3% (4.2 s before episode) | Y | Y | 2015 | Y | – |
|
| 7 PD | Accelerometer; Gyroscope; Magnetometer | Tibialis anterior (1) | TUG on standardized 7-m course | Threshold | – | False negative: 2%; False positive: 5% | Y | Y | 2019 | Y | – |
|
| 12 PD | Accelerometer; Gyroscope; Electroencephalogram; Skin conductance; Electromyography; Electrocardiogram | Lateral tibia of the leg (2) | A series of walking task | Machine learning | SVM, k-NN | Subject-independent accuracy: 85%; Subject-dependent accuracy: 88% | – | Y | 2022 | N | ? |
|
| 25 PD | IMU | Ankle (2) | TUG standardized 7-m course | Machine learning | Neural network | Sensitivity: 95.9%; Specificity: 93.1% | – | – | 2019 | Y | ? |
|
| 11 PD | Accelerometer | Shank (1) | A series of walking task | Threshold | – | Accuracy: 89%; Sensitivity: 89%; False positives: 10% | Y | Y | 2008 | N | – |
|
| 25 PD | Accelerometer | Lumbar region of the back (1) | TUG tasks | Threshold | – | Lower back sensor, 10s window Sensitivity: 86.2%; Specificity: 82.4% | – | Y | 2013 | N | – |
|
| 18 PD | Accelerometer | Ankle (2) | A series of daily walking tasks | Machine learning | ADAptive SYNthetic sampling algorithm | Accuracy: 97.4%; Prediction: 66.7% | – | – | 2019 | Y |
|
|
| 10 PD | Accelerometer | Shank (1) | Two walking tasks and one dual task | Threshold | – | Accuracy: 88.8%; Sensitivity: 92.5%; Specificity: 89.0% | – | Y | 2019 | Y |
|
|
| 7 PD | Accelerometer; Gyroscope | Ankle (2) | Walking task | Deep learning | CNN, transfer learning, k-means clustering | Sensitivity: 63.0%; Specificity: 98.6%; Target models identified 87.4% of FOG events, 21.9% predicted | – | – | 2022 | Y |
|
|
| 16 PD | IMU | Chest (1) | Free-living setting | Deep learning | CNN | Lumbar and ankles AUROC: 83% | – | Y | 2022 | N | – |
|
| 1 PD | IMU | Shank (2) | Walking task | Machine learning | – | (Performance NOT reported) | – | – | 2020 | Y | – |
|
| 18 PD | Electrocardiography; Skin-conductance | Shank (2) | Walking task and dual task | Threshold | – | AUC: 76%; Sensitivity: 83%; Specificity: 67% | Y | – | 2017 | Y |
|
|
| 11 PD | Accelerometer; Plantar pressure sensors | Sole (2) | Walking task and dual task | Machine learning | Decision tree, Random undersampling boosting | Sensitivity: 77.3%; Specificity: 82.9% | – | – | 2022 | N |
|
|
| 11 PD | Accelerometer; Gyroscope | Knee (2) | Walking task along a complex pathway to provoke FOG | Threshold | – | Detection model episodes identified: 92.1% (8.2); precision: 31.8% (19.9); Prediction model episodes identified: 93.8% (6.8); precision: 30.6% (17.0) | Y | – | 2021 | N | – |
|
| 11 PD | Accelerometer; Gyroscope; Plantar pressure sensor | Sole (2) | A series of walking task | Machine learning | Decision tree ensemble model | Total-FOG sensitivity: 76.4%, Specificity: 86.2%; Transition sensitivity: 85.2%; FOG sensitivity: 93.4% | – | Y | 2021 | Y | – |
|
| 10 PD | Accelerometer | Shank (1) | Walking task | Threshold | – | Sensitivity: 96%; Specificity: 79%; Ankle only | – | Y | 2017 | N |
|
|
| 10 PD | Accelerometer; Gyroscope; Magnetometer | Chest (1) | Walking task | Threshold | – | Accuracy: 99.7% | – | – | 2019 | Y | – |
|
| 10 PD | Pressure sensor; Accelerometer; Angular velocity sensor; Euler angles sensor | Sole (2) | Zeno Walkway on a standardized 5-m course | Machine learning | Artificial neural network | Sensitivity: 96.0% (2.5); Specificity: 99.6% (0.3); Precision: 89.5% (5.9); Accuracy: 99.5% (0.4) | – | – | 2021 | Y | ? |
|
| 16 PD | Accelerometer; Gyroscope | Heel (2) | A series of walking task | Threshold | – | Accuracy: 81.03% | – | – | 2018 | N | – |
|
| 6 PD | Electroencephalography | Head (1) | A series of TUG | Deep learning | Bayesian neural network, Time-frequency Stockwell Transform | Sensitivity: 84.2%; Specificity: 88%; Accuracy: 86.2% | – | Y | 2017 | N | – |
|
| 71 PD | Accelerometer; Gyroscope; Magnetometer | Lower back (2) | A series of walking tasks and dual task | Machine learning | SVM | Sensitivity: 84.1%; Specificity: 83.4%; Accuracy: 85.0% | Y | Y | 2020 | N | ? |
|
| 12 PD | Accelerometer; Gyroscope; Plantar pressure sensor | Waist (1) | Walking task | Threshold | – | Left-shank | Y | – | 2022 | N | ? |
|
| 10 PD | Accelerometer | Shank (1) | A series of walking task | Machine learning | CWT | Skin sensitivity: 84.9%; Specificity: 81.0% | Y | Y | 2016 | N |
|
|
| 5 PD | Accelerometer; Telemeter; Goniometer | Shin (1) | Walking task | Machine learning | Gaussian neural network | Efficiency: 87% | – | – | 2017 | N | – |
|
| 35 PD | Accelerometer; Gyroscope | Shank (1) | Turning trial | – | – | Turning trial: FoG ratio correlated with N-FoGQ score (significant); Total FoG time correlated with N-FoGQ (significant) | Y | – | 2022 | N | – |
|
| 15 PD | Accelerometer | Waist (1) | Walking task and dual task | Threshold | – | Sensitivity: 91.7%; Specificity: 87.4% | Y | Y | 2018 | Y | MASPARK project |
|
| 12 PD | Accelerometer; Gyroscope | Waist (1) | Walking task, dual-task and free-living setting for 3 days | Machine learning | SVM | Sensitivity: 82.08%; Specificity: 93.75% | Y | Y | 2017 | Y | – |
|
| 21 PD | Accelerometer | Waist (1) | A set of scripted activities at patients’ home | Machine learning | SVM | Generic model | Y | Y | 2017 | Y | REMPARK project |
|
| 11 PD | Accelerometer; Plantar pressure sensors | Sole (2) | Walking task | Deep learning | LSTM | Sensitivity: 82.1% (6.2); Specificity: 89.5% (3.6) | – | – | 2021 | Y | – |
|
| 10 PD | Accelerometer | Ankle (1) | Walking task and dual task | Machine learning | Random forest, multilayer perceptron, Hidden Markov models | Sensitivity: 95%; Specificity: 75% | – | Y | 2019 | N |
|
|
| 63 PD | Accelerometer; Gyroscope; Magnetometer | Ankle (2) | TUG on standardized 7-m course and daily routine | Deep learning | CNN, CWT | GM: 90.7%; F1-score: 91.5% | – | – | 2022 | N | – |
|
| 67 PD | Accelerometer; Gyroscope; Magnetometer | Ankle (2) | TUG on standardized 7-m course | Deep learning | CNN, CWT | Accuracy: 89.2%; GM: 88.8% | – | Y | 2020 | N | – |
|
| 21 PD | Accelerometer | Waist (1) | 20 min of scripted ADL | Deep learning | Recurrent neural network | Sensitivity: 87.1%; Specificity: 87.1%; AUC: 93.9% | – | – | 2020 | N |
|
|
| 21 PD | Accelerometer | Waist (1) | Walking task and dual task | Deep learning | CNN | Sensitivity: 84.2%; Specificity: 93.9%; Precision: 61.7% | Y | Y | 2022 | N |
|
|
| 1 PD | Accelerometer | Hallux Heel (1) | Walking task | Threshold | – | (Performance NOT reported) | – | – | 2011 | N | – |
|
| 44 PD | Accelerometer; Gyroscope | Shin (2) | TUG on standardized 3-m course | Threshold | Accuracy: 98.51%; Sensitivity: 93.41%; Specificity: 98.51%; Positive predictive: 89.55%; Negative predictive: 97.31% | Y | Y | 2017 | N | – | |
|
| 12 PD | Accelerometer; Gyroscope | Waist (1) | Walking task performed | Machine learning | Neural network | Root mean square error = 0.16 | – | – | 2013 | Y | REMPARK project |
|
| 1 PD | Accelerometer | Chest (1) | Free-living setting | Threshold | – | Validity: Detected 19 of 22 falls (specificity/false positives not reported) | Y | Y | 2005 | N | – |
|
| 12 PD | Accelerometer; Gyroscope | Lower back (1) | TUG | Threshold | – | Sensitivity: 90.6% (7.71); Specificity: 94.3% (8.36) | – | – | 2020 | N | – |
|
| 11 PD | Accelerometer; Gyroscope | Wrist (2) | A series of walking tasks | Threshold | – | Sensitivity: 81.94%; Specificity: 98.74% | Y | Y | 2013 | N | – |
|
| Lab: 24 PD | Accelerometer; Gyroscope | Wrist (2) | Lab: a series of walking tasks. Home: 5 consecutive days of free living. | Machine learning | Hidden Markov Model, SVM | Lab accuracy: 79%; Home error: 79% | Y | Y | 2014 | N | – |
|
| 40 PD | IMU | Shoe (2) | Free-living setting | Machine learning | Naïve Bayes, SVM, random forest, GBoost | Accuracy: 74%; Sensitivity: 60%; Specificity: 88% | – | – | 2022 | N | FallRiskPD dataset |
|
| 107 PD | Accelerometer | Lower back (1) | Patients wore the sensor for 3 consecutive days at home | – | – | Anterior–posterior width correlated with BBS ( | Y | Y | 2014 | N | – |
|
| 10 PD | Accelerometer | Shank (1) | Walking task | Machine learning | Adaboost algorithm, Random undersampling technique | Sensitivity: 99.70%; Specificity: 99.96% | – | – | 2018 | N |
|
|
| 14 PD | Accelerometer; Gyroscope; Magnetometer | Lower back (1) | TUG on standardized 5-m course | Threshold | – | (Performance NOT reported) | – | Y | 2014 | N | – |
|
| 23 PD | Accelerometer | Waist (1) | Walking task | Threshold | – | Full rapid turns: Sensitivity: 78%, Specificity: 59%. | – | Y | 2015 | N | – |
|
| 11 neurological disorder | Accelerometer | Upper arm (1) | Free-living setting | Machine learning | Random forest, pruned decision tree, logistic model tree, Naïve Bayes, SVM | Forest stationary accuracy: 99.6%; Light ambulatory accuracy: 81.5%; Intense ambulatory accuracy: 97.2% | Y | – | 2021 | Y |
|
| Body part | Body landmark or placement | Number of articles ( | Ratio (%) | Single location ( |
|---|---|---|---|---|
| Head and neck | Head | 3 | 1.91 | 0 |
| 7th cervical vertebra | 2 | 1.27 | 0 | |
| Upper limb | Forearm | 2 | 1.27 | 2 |
| Wrist | 7 | 4.46 | 2 | |
| Finger | 1 | 0.64 | 0 | |
| Torso | Chest | 5 | 3.18 | 2 |
| Upper back | 2 | 1.27 | 1 | |
| Lower back | 17 | 10.83 | 3 | |
| Lumbar | 2 | 1.27 | 0 | |
| Trunk | 1 | 0.64 | 0 | |
| Waist | 15 | 9.55 | 10 | |
| Lower limb | Foot | 5 | 3.18 | 0 |
| Gastrocnemius | 1 | 0.64 | 0 | |
| Hallux | 1 | 0.64 | 0 | |
| Heel | 1 | 0.64 | 1 | |
| Hip | 6 | 3.82 | 1 | |
| Knee | 4 | 2.55 | 2 | |
| Lateral tibia of leg | 1 | 0.64 | 0 | |
| Leg | 1 | 0.64 | 0 | |
| Sole | 9 | 5.73 | 6 | |
| Shank | 16 | 10.19 | 5 | |
| Shin | 8 | 5.10 | 0 | |
| Shoe | 4 | 2.55 | 4 | |
| Thigh | 17 | 10.83 | 0 | |
| Tibialis anterior | 1 | 0.64 | 0 | |
| Trouser pocket | 2 | 1.27 | 1 | |
| Ankle | 19 | 12.10 | 4 | |
| Patellofemoral joint line | 1 | 0.64 | 1 | |
| Other | Skin | 3 | 1.91 | 4 |
| Algorithm | Number of articles (n) | Ratio (%) | Sensitivity (%) | Specificity (%) |
|---|---|---|---|---|
| CNN | 7 | 13.20 | 63.00–98.50 (MED = 89.00) | 93.90–98.60 (MED = 97.90) |
| Decision trees | 5 | 9.43 | 77.30–88.52 | 82.90–88.77 |
| LSTM | 6 | 11.32 | 82.10–98.50 | 89.50–97.90 |
| Naïve Bayes | 3 | 5.66 | 60.00–88.52 | 88.00–88.77 |
| Neural network | 5 | 9.43 | 72.34–95.90 | 87.36–93.10 |
| SVM | 17 | 32.07 | 60.00–93.00 (MED = 87.80) | 80.09–100.00 (MED = 80.30) |
| k-NN | 5 | 9.43 | 88.52–94.97 | 88.77–99.83 |
| Random forest | 5 | 9.43 | 60.00–95.00 | 75.00–93.02 |
| Combination | Number of articles ( | Ratio (%) | Sensitivity (%) | Specificity (%) |
|---|---|---|---|---|
| Accelerometer, gyroscope and magnetometer | 13 | 25.00 | 79.50–92.57 (MED = 89.00) | 83.40–100.00 (MED = 88.90) |
| Accelerometer, force sensor and bending sensor | 1 | 1.92 | – | – |
| Accelerometer and gyroscope | 21 | 40.38 | 63.00–100.00 (MED = 88.30) | 80.00–100.00 (MED = 97.57) |
| Accelerometer, gyroscope and orientation sensor | 1 | 1.92 | – | – |
| Accelerometer and electromyographic | 1 | 1.92 | 82.90 | 97.30 |
| Sphygmomanometer and smartwatch | 1 | 1.92 | – | – |
| Accelerometer and plantar pressure sensors | 3 | 5.77 | 82.10 | 89.50 |
| Electrocardiography and skin-conductance | 2 | 3.85 | 83.00 | 67.00 |
| Accelerometer, gyroscope, electroencephalogram, skin conductance, electromyography, electrocardiogram | 1 | 1.92 | – | – |
| IMU | 4 | 7.69 | 60.00–95.90 (MED = 77.95) | 88.00–93.10 (MED = 90.55) |
| Accelerometer, gyroscope and plantar pressure sensors | 2 | 3.85 | 78.39 | 91.66 |
| Pressure sensors, accelerometer, angular velocity sensor and Euler angles sensor | 1 | 1.92 | 96.00 | 99.60 |
| Accelerometer, telemeter and goniometer | 1 | 1.92 | – | – |
Peer Reviews
No public reviews on file for this paper yet. If you reviewed it on a platform where reviews are public (OpenReview, ICLR, NeurIPS, ICML), you can paste yours below so the community can read it here.
Videos
No videos yet. Explain this paper in a talk, walkthrough, or lecture? Add one.
Taxonomy
TopicsBalance, Gait, and Falls Prevention · Parkinson's Disease Mechanisms and Treatments · Prosthetics and Rehabilitation Robotics
Introduction
As a major threat to human health (Dommershuijsen et al., 2020; Kingwell, 2019), NDs (e.g., Parkinson’s disease, Alzheimer’s disease, motor neuron disease, and dementia) comprise a heterogeneous group of neurological conditions characterized by progressive—and often currently incurable—clinical courses. With the ongoing extension of lifespan, the prevalence and societal burden of these age-dependent disorders continue to rise (Heemels, 2016). Patients with NDs commonly exhibit motor impairments as well as cognitive and behavioral disturbances (Pender et al., 2020; Aarsland et al., 2021), which may manifest as impaired postural control, gait abnormalities (Morel et al., 2020), and consequently an elevated risk of falls (Schell et al., 2019). Falls in this population are not only associated with fractures, hospitalization, and loss of independence, but may also precipitate secondary complications (e.g., fear of falling and reduced mobility), thereby accelerating functional decline. Therefore, developing accurate and practical fall-detection solutions is of clinical importance to reduce injury-related morbidity and the downstream costs of post-fall care.
Wearable sensing has emerged as a promising approach for fall detection because sensors can be worn continuously and capture movement signals in everyday contexts when deployed at appropriate body locations. Compared with many environmental approaches, wearable solutions can support monitoring across both indoor and outdoor settings while offering a more privacy-preserving pathway for continuous assessment. Nevertheless, key barriers remain, including limited battery life, susceptibility to false alarms, and user adherence—factors that directly condition real-world feasibility even when laboratory performance is acceptable. Recent advances in mobile and embedded technologies have enabled miniaturized, energy-efficient devices with improved on-device processing and wireless connectivity, which can facilitate timely alerts and potentially mitigate adverse outcomes related to prolonged “long-lie” after a fall. Moreover, wearable platforms may function as personalized monitoring tools by providing quantitative, longitudinal information relevant to disease severity and mobility impairment, while reducing reliance on intrusive sensing modalities.
Despite substantial growth in the literature, fall-detection research in NDs populations remains methodologically heterogeneous, spanning diverse sensor modalities, placements, algorithms, and validation protocols, which contributes to fragmented evidence and limited cross-study comparability. Recent reviews in Ambient Assisted Living and Human Activity Recognition and wearable assisted-living have summarized broader wearable fall-detection advances and highlighted practical design constraints (e.g., unobtrusiveness, miniaturization, energy efficiency, and privacy) (Guerra et al., 2023; Li et al., 2025; Iadarola et al., 2024). Performance-oriented syntheses further underscore that validation performance is central to viability (Gorce and Jacquier-Bret, 2025). However, a NDs-focused synthesis that explicitly tracks how wearable fall detection has evolved over time—and that systematically compares validation performance across heterogeneous technological and methodological choices—remains limited. Accordingly, we conducted a systematic review to examine the temporal evolution of wearable-sensor fall detection in NDs populations in terms of sensor technology, body placement, algorithmic strategies, and validation performance, with the aim of clarifying robust evidence, improving comparability, and informing priorities for future investigations.
Review methodology
A systematic literature review was conducted in light of the PRISMA statement (Liberati et al., 2009). We searched PubMed and Web of Science in February 2023 to summarize fall detection using body-worn sensors in patients with NDs. These databases were selected to allow both engineering and medical journals to be included during the search procedure. Additionally, a search in the reference of review articles and book chapters that appeared during the search was performed. The objective was to identify potentially eligible studies absent in the database search. The final search query is summarized in Table 1.
We included articles if they were full-text, published in English, and published in a peer-reviewed journal. In the meantime, involved papers should focus on fall detection or fall-risk assessment using wearable (body-worn) sensors in NDs populations, and present original research validating wearable sensors to assess falls or fall risk. We excluded articles if they; (1) only used wearable devices for fall cueing, (2) did not offer sufficient information for data extraction, (3) did not use patients with NDs, or (4) only used non-wearable sensors or devices. Algorithm performance metrics were not used as eligibility criteria; when reported, they were extracted and synthesized in the Results.
YC and TH finalized the standard of inclusion and exclusion, then independently screened the title, abstract and keyword in the databases. Repetitive outcomes were filtered out, and the remaining articles were relevant following their title and abstract. The remaining papers were reviewed in full document, and the applicable data was extracted from identified studies and tabularized under the pre-established heading. Divergences between reviewers were resolved by consensus. For each included study, we extracted the following variables: author(s), studied population, sensor type, device location(s) (including the number of placements, n), walking task, method category (threshold-based, machine learning, or deep learning), specific classifier/model, reported performance metrics, evaluation mode (online [ON] vs. offline [OFF]), publication year, real-time implementation (yes/no), and data source (e.g., public dataset vs. self-collected data).
Results
Studies selection
The electronic database searches yielded 2,336 results that fulfilled the requirements for inclusion (Figure 1). Simultaneously, surveying the literature cited in these papers allowed for the identification of 10 more documents were included. Four hundred forty-six manuscripts were dismissed as duplicates, leaving 1890 papers being screened (1,635 records excluded). Of the remaining of 255 articles were filtered by full document. Eighty-nine articles were deemed relevant for this review.
Study flow diagram.
This review analyzed the application of wearable sensors to access falls in patients with NDs (Table 2). Of all 89 articles, 87 articles used patients with Parkinson’s disease (PD), while seven and two articles recruited healthy elderly control and healthy control, and only one study enrolled neurological disorders sufferers. Concurrently, the enrollment count of fall detection projects ranged in complexity (range, 1–131, median = 14). Nevertheless, 39.33% of articles (n = 35) leverage data sets to appraise their algorithms’ credibility (Figure 2). Data from Bachlin et al. (2010) was the most frequently used data set (45.71% of studies, n = 16).
The source of data set.
Studied employ a variety of sensor types and placements. From this review, we identified 37 papers that collected data with a single type of wearable sensor, including 33 projects that used an accelerometer alone, while one and three articles applied electroencephalography plantar pressure sensors. Fifty-two essays employed multiple forms of wearable sensors to assess falls (Figure 3). Twenty-one articles combined accelerometers and gyroscopes or along with magnetometers (n = 13). Since 2020, there has been a clear preference for using multiple devices to collect the activity data of the human body.
Number of publications each year per number of sensor type.
Wearable sensors are positioned on different body regions to track physical activity (Figure 4; Table 3). The ankle was chosen as a sensor placement of 19 articles (12.10% of total placements; N = 157), with four studies using the ankle as the single placement site. Both the lower back and thigh were reported in 17 articles each (10.83% of total placements), and three studies adopted the lower back as the sole site. Shank and waist placements were reported in 16 (10.19%) and 15 (9.55%) articles, respectively, with five and ten studies using the shank and waist as the single placement sites. Notably, the “Ratio (%)” in Table 3 was calculated using the total number of device-location occurrences (total placements) as the denominator, rather than the number of included studies.
Number of publications each year per number of sensor locations.
The fall detection system heavily relies on the algorithm, which can range in complexity. Typically, threshold-based and machine learning-based are the two main types of algorithms in fall detection. A total of 34 articles relied on threshold-based algorithms for detecting falls, remaining 53 articles using machine learning. Figure 5 shows that the number of articles that used machine learning was two times higher than those that used threshold algorithms in 2019 and 2020, six times higher in 2021, and four times higher in 2022. Thirty-two articles opted for real-time evaluation as their preferred method. 62.5% of articles used machine learning algorithms to detect falls in real time (n = 20), and threshold algorithms were used in 12 of the 32 articles. Only in 2016 and 2019, the number of studies that detected falls in real-time was more significant than in non-real-time (Figure 6).
Number of publications each year per type of algorithm.
Number of publications each year per real-time evaluation.
Among studies adopting machine learning/deep learning approaches (n = 53), SVM was the most frequently used classifier (n = 17, 32.07%), followed by CNN (n = 7, 13.20%) and LSTM (n = 6, 11.32%). Decision trees, neural networks, k-NN, and random forest were each reported in five studies (9.43%), whereas Naïve Bayes was used less frequently (n = 3, 5.66%). Reported performance varied across algorithms: k-NN achieved the highest median sensitivity (94.10%), whereas CNN yielded the highest median specificity (97.90%) (Table 4). The reported ranges also varied across models: SVM sensitivity ranged from 60.00 to 93.00% with specificity ranging from 80.09 to 100.00%, and random forest sensitivity ranged from 60.00 to 95.00% with specificity ranging from 75.00 to 93.02%. In addition, LSTM-based models reported relatively high median sensitivity and specificity (92.57 and 96.00%, respectively).
Studies exhibit remarkable diversity in the measures of validation performance (Table 5). Overall, the reviewed studies had a median sensitivity of 88.09% (range, 60–100%), a median specificity of 92.08% (range, 67–100%), and a median accuracy of 89.57% (range, 71.3–100.0%).
Discussion
This systematic review sought to explore the literature on fall detection and determine the mainstream sensor type, device location, sources of dataset, and algorithm. This paper also elucidated the evolution of trends and technology. In all, 89 articles were analyzed in this review.
Falls detection apparatus
Several categories of all detection apparatus include vision-based, wearable device-based and ambient-based approaches (Mubashir et al., 2013). Owing to the evolution of wireless signal transmission and electronic miniaturization technology, numerous studies are investigating the effectiveness of wearable sensors for fall detection. In this review, sensor types and combinations exhibited significant diversity between studies. In 37 studies, fall detection was carried out using only one type of wearable sensor. Accelerometers alone were used in 89.2% of the studies (n = 33), whose sensitivity ranged from 72.34 to 99.70% (MED = 88.50%) and specificity ranged from 75.00 to 99.96% (MED = 88.88%). Three articles exclusively relied on electroencephalography for fall detection (sensitivity: 77.30–85.86%, specificity: 80.25–88.00%), and one article used the pressure sensor alone (Pardoel et al., 2022). These findings suggest that fall detection accuracy remains consistent regardless of the number of sensor types. Using a single sensor type can streamline the computing demands and sophistication of the system.
A considerable percentage of studies on fall detection utilized IMU, which included more than one type of sensor. Among the identified papers, IMU can found to be utilized for fall detection in 52 of them, only 3 of them exclusively mentioned IMU, whereas the other 49 articles described the type of sensors used. This review revealed that the most commonly used sensor combination in fall detection studies was the integration of an accelerometer and a gyroscope (n = 21). Furthermore, there was only a slight difference in accuracy between different sensor combinations. The only exception to this finding was the specificity of integrating electrocardiography and skin conductance (67%).
The path of trend in fall detection can be attributed to several factors. Firstly, IMUs can collect data from multiple axes to capture the full range of body movement during a fall event, improving accuracy. Second, electronic miniaturization technology can minimize energy consumption and chip size while maintaining high performance, which makes IMUs more accessible and affordable for developers to use in fall detection. Finally, researchers can analyze large datasets and derive accurate conclusions since machine learning-based tools are increasingly becoming available.
Sensor placement
As previously mentioned, multiple protocols were outlined for fall detection devices to access falls. The human body has four divisions: the head and neck, the torso, the upper limb, and the lower limb. The lower limb was the predominant placement, accounting for 76.49% of the studies (n = 68). The ankle was the preferred location among researchers (21.34% of studies, n = 19), and the sole was the most frequently selected single location on the lower limb (21.34% of studies, n = 19). The waist was both the most frequent location on the torso and the most common single placement on the human body (n = 10). As a crucial weight-bearing structure, the lower limb can intuitively reflect the impact experienced by users and is therefore an essential consideration in clinical assessments. Placement-specific performance comparisons could not be synthesized reliably, as many included studies deployed multiple sensor locations yet reported only aggregate performance without location-stratified results. Future primary studies should report location-specific performance in multi-placement designs or conduct head-to-head comparisons under standardized sensor combinations and protocols to enable robust placement-based meta-analyses.
Algorithms
The most straightforward approach for fall detection is the threshold-based algorithm. Among the articles identified in this review, 34 employed threshold-based algorithms for fall detection. With threshold-based algorithms, a fall is detected if chosen indicators exceed a selected threshold. Falls can not be detected as having happened unless the criteria are met. With optimized computational performance, threshold approaches can conduct a rapid analysis of massive data. Still, plenty of drawbacks exist in threshold-based algorithms. A strict threshold may reduce the probability of detecting falls, and a loose threshold may increase the likelihood of detecting false positives. This is a situation that most investigators find themselves in.
Machine learning algorithms such as convolutional neural networks (Cheng, 2021; Camps et al., 2018; Kim et al., 2018; Naghavi and Wade, 2022; O'Day et al., 2022; Shi et al., 2022; Shi et al., 2020; Sigcha et al., 2022), decision trees (Aich et al., 2018; Borzi et al., 2019; Pardoel et al., 2022; Pardoel et al., 2021b), long short term memory (Cheng, 2021; Esfahani et al., 2021; Guo et al., 2022; Li et al., 2020; Masiala et al., 2019; Shalin et al., 2021) (n = 6), Naïve Bayes (Aich et al., 2018; Ullrich et al., 2022; Zia et al., 2021), neural network (Borzi et al., 2019; Iakovakis et al., 2016; Kleanthous et al., 2020; Miko et al., 2019; Takac et al., 2013), SVM (Aich et al., 2018; Ahlrichs et al., 2016; Arami, 2019; Borzì et al., 2021; Borzi et al., 2019; Ghosh and Banerjee, 2021; Dvorani et al., 2021; El-Attar et al., 2021; Iakovakis et al., 2016; Kleanthous et al., 2020; Mesin et al., 2022; Reches et al., 2020; Daniel et al., 2017; Rodríguez-Martín et al., 2017; Tzallas et al., 2014; Ullrich et al., 2022; Zia et al., 2021) (n = 17), k-nearest neighbor (Aich et al., 2018; Borzi et al., 2019; Demrozi et al., 2020; Halder et al., 2021; Mesin et al., 2022), and random forest (Ghosh and Banerjee, 2021; Kleanthous et al., 2020; San-Segundo et al., 2019; Ullrich et al., 2022; Zia et al., 2021) were used extensively in recent studies to address limitations of threshold-based approaches, particularly the need for manual threshold selection and potential sensitivity to inter-individual variability.
As summarized in Table 4, a range of machine learning and deep learning classifiers has been adopted; however, drawing algorithm-level conclusions remains difficult because reported performance is strongly dependent on sensor configuration, placement, task protocol, and validation design. Wearable devices were deployed for data collection, and a training phase is an integral part of machine learning. The traditional understanding is that machine learning algorithms are more computationally demanding than threshold-based methods, resulting in higher latency (Hu and Qu, 2016). Nevertheless, more and more studies used machine learning algorithms to detect falls in real time. This trend suggests that machine learning is increasingly feasible for on-device or near-real-time deployment and is emerging as a leading strategy to improve the reliability of fall detection systems (Figure 5).
To really bring fall detection into practical use, a significant obstacle still resides in evaluation in real-time. Theoretically, with the rapidly improving computational capability of CPU, the difficulty of assessment in real-time can be reduced. However, there is no association between publication year and the number of studies that evaluate the activity data of the human body in real-time. The above can be attributed to the current studies intended to investigate datasets to assess the effectiveness of their algorithms, improving productivity and conserving resource usage.
Fall detection performance
Multiple performance metrics can be used to assess the reliability of fall detection systems, including sensitivity, specificity, accuracy and so on. Sensitivity was a commonly used performance metric in 59.55% of studies, with a wide range of sensitivity values from 60 to 100%. The sensitivity of Chomiak et al. (2019) was perfect, achieving a sensitivity of 100%. The lowest sensitivity value of 60% was obtained by Ullrich et al. (2022). Meanwhile, the exact number of papers used specificity (59.55% of studies, n = 53), with specificity values ranging from 67 to 100%. The approach of Palmerini et al. (2017) yielded the lowest specificity of 67%, and two articles reported 100% specificity (Ahlrichs et al., 2016; Chomiak et al., 2019). Some articles utilized accuracy as a performance metric, with an accuracy range of 71.3–100.0%. The fall detection system proposed by Djuric-Jovicic et al. (2014) exhibited the highest accuracy (100%), and the lowest accuracy was obtained by Mazilu et al. (2015b). A few studies reported AUC varying from 76 to 97%, with the highest AUC values achieved by two articles (Borzi et al., 2019; Masiala et al., 2019) and Palmerini et al. (2017) had the lowest value. Meanwhile, some measures of validation performance were utilized in a few studies, such as f-score (n = 2), geometric mean (n = 3), error rate (n = 1), false positive rate (n = 3), false negative rate (n = 2), positive/negative predictive (n = 1), root mean square error (n = 1), mean absolute error (n = 1).
Of note, it is challenging to draw a firm conclusion on the optimal fall detection system based solely on the reported validation performance, due to substantial heterogeneity across the included studies. The evidence base is population-imbalanced and often underpowered (87/89 studies on Parkinson’s disease; sample size 1–131, median = 14), while sensor configurations and placements vary widely (including multi-sensor and multi-location designs), limiting attribution of performance to any single design choice. In addition, protocols and evaluation settings differ (task definitions; offline vs. online/real-time testing), and studies use heterogeneous data sources and reporting practices, with wide ranges in sensitivity, specificity, and accuracy. These factors confound direct comparisons and prevent identification of a single “preferred” solution for NDs populations. A standardized benchmarking and reporting framework is urgently needed for fair cross-study comparisons. To improve cross-study comparability, future work should adopt harmonized reporting of participant characteristics, sensor configurations/placements, and evaluation protocols/settings, alongside a core set of performance metrics. Prospective, adequately powered studies across broader NDs phenotypes are also needed to validate deployment-ready systems under real-world conditions.
Conclusion and future work
Affordable, efficient healthcare for patients with NDs is eminently needed. Through an examination of 89 articles on wearable sensors for fall detection, this review provided a comprehensive overview of the evolution of trends and technology in this area. Various aspects were examined in this paper, including sensor type utilized, device placement, the number of subjects (datasets) considered, algorithms implemented, and validation performance achieved. More and more studies have embraced machine learning algorithms to improve the accuracy and immediacy of fall detection systems, thanks to the enhancement of computing capacity power. Furthermore, there is a clear preference to use multiple types of sensors to detect falls. Despite evaluation in real-time being a critical step to put fall detection into practical use, an increasing number of researchers examine the validation performance of their systems in non-real-time. Many investigators targeted their attention to patients with Parkinson’s disease and ignored other NDs. The number of study participants was limited, and a consensus has not been reached on a standard walking test, which might create difficulties for researchers trying to find the optimal system according to the reported validation performance. Furthermore, there is an absence of agreed-upon machine learning algorithms. Future work must address the limitations highlighted in this research to advance the field. Firstly, the studied population should be carefully selected to support their viewpoints, and more attention should be given to other NDs. Secondly, a consensus on walking tasks and accuracy measurements is urgently needed. Lastly, with continuous real-time monitoring and assessment, performing studies in a simulated free-living environment for a specified time frame is advisable.
Limitations
The major limitation of this systematic review is the limited number of papers included in this review. Due to the search strategy, many related documents written in other languages and electronic databases may have been omitted. Furthermore, manual screening and review procedures may lead to a potential loss of papers and be subject to interpretive bias.
The reference list from the paper itself. Each links out to its DOI / PubMed record.
- 1Aarsland D. Batzu L. Halliday G. M. Geurtsen G. J. Ballard C. Ray Chaudhuri K. . (2021). Parkinson disease-associated cognitive impairment. Nat. Rev. Dis. Primers 7:47. doi: 10.1038/s 41572-021-00280-334210995 · doi ↗ · pubmed ↗
- 2Ahlrichs C. SamàA. Lawo M. Cabestany J. Rodríguez-Martín D. Pérez-López C. (2016). Detecting freezing of gait with a tri-axial accelerometer in Parkinson’s disease patients. Med Biol Eng Comput. 54, 223–33. doi: 10.1007/s 11517-015-1395-326429349 · doi ↗ · pubmed ↗
- 3Ahn D. H. Chung H. Lee H. W. Kang K. Ko P.-W. Kim N. S. . (2017). Smart gait-aid glasses for Parkinson's disease patients. IEEE Trans. Biomed. Eng. 64, 2394–2402. doi: 10.1109/TBME.2017.265534428113199 · doi ↗ · pubmed ↗
- 4Aich S. Pradhan P. M. Park J. Sethi N. Vathsa V. S. S. Kim H.-C. (2018). A validation study of freezing of gait (Fo G) detection and machine-learning-based Fo G prediction using estimated gait characteristics with a wearable accelerometer. Sensors 18:3287. doi: 10.3390/s 18103287, 30274340 PMC 6210779 · doi ↗ · pubmed ↗
- 5Aner W. Herman T. Giladi N. Hausdorff J. M. (2014). Objective assessment of fall risk in Parkinson's disease using a body-fixed sensor worn for 3 days. P Lo S One 9:e 96675. doi: 10.1371/journal.pone.009667524801889 PMC 4011791 · doi ↗ · pubmed ↗
- 6Antonio S. Kita A. Leodori G. Zampogna A. Nicolini E. Lorenzi P. . (2017). L-DOPA and freezing of gait in Parkinson's disease: objective assessment through a wearable wireless system. Front. Neurol. 8:406. doi: 10.3389/fneur.2017.0040628855889 PMC 5557738 · doi ↗ · pubmed ↗
- 7Arami A. (2019). Prediction of gait freezing in parkinsonian patients: a binary classification augmented with time series prediction. IEEE Trans. Neural Syst. Rehabil. Eng. 27, 1909–1919. doi: 10.1109/TNSRE.2019.293362631398122 · doi ↗ · pubmed ↗
- 8Ayena J. C. Otis M. J. D. (2020). Validation of minimal number of force sensitive resistors to predict risk of falling during a timed up and go test. J. Med. Biol. Eng. 40, 348–355. doi: 10.1007/s 40846-020-00512-z · doi ↗