Thermal influence on life history traits and population parameters of the olive moth, Prays oleae (Bernard) (Lepidoptera: Praydidae): implications for temperature-based pest management
Mohamed El Aalaoui, Mohamed Sbaghi

TL;DR
The olive moth thrives best at 25–28°C, with temperature affecting its development, survival, and reproduction, which can help guide pest management strategies.
Contribution
The study evaluates temperature effects on the olive moth's life cycle and identifies optimal thermal thresholds for pest management.
Findings
Developmental duration decreases with increasing temperature, with optimal reproduction at 25°C.
Survival rates peak at 25°C, while adult lifespan declines significantly at higher temperatures.
Brière-2 model best predicts thermal thresholds for the olive moth's development.
Abstract
The olive moth, Prays oleae (Bernard) (Lepidoptera: Praydidae), is a major pest of olive crops worldwide. This study examined the effects of constant temperatures (15–35 °C) on its development, survival, and reproduction, and evaluated nine temperature-dependent models (Linear, Lactin-2, β type, Brière-1 and 2, Polynomial, Shi, SSI, and Taylor). Developmental duration decreased with temperature, with egg incubation ranging from 14.1 days at 15 °C to 2.6 ± 0.1 days at 35 °C, pre-adult development ranging from 64.9 days (male) and 68.3 days (female) at 15 °C to 27.1 days and 27.8 days at 35 °C, with males generally developing faster than females except at 28 and 32 °C, and adult life span declining from 76.8–81.2 days at 15 °C to 34.1–35.4 days at 32 °C. Survival followed a bell-shaped pattern, peaking at 25 °C for eggs (79.93%), larvae (90.87%), and pupae (66.0%). Kaplan–Meier analysis…
Genes, proteins, chemicals, diseases, species, mutations and cell lines named across the full text — each resolved to its canonical identifier and authoritative record.
Click any figure to enlarge with its caption.
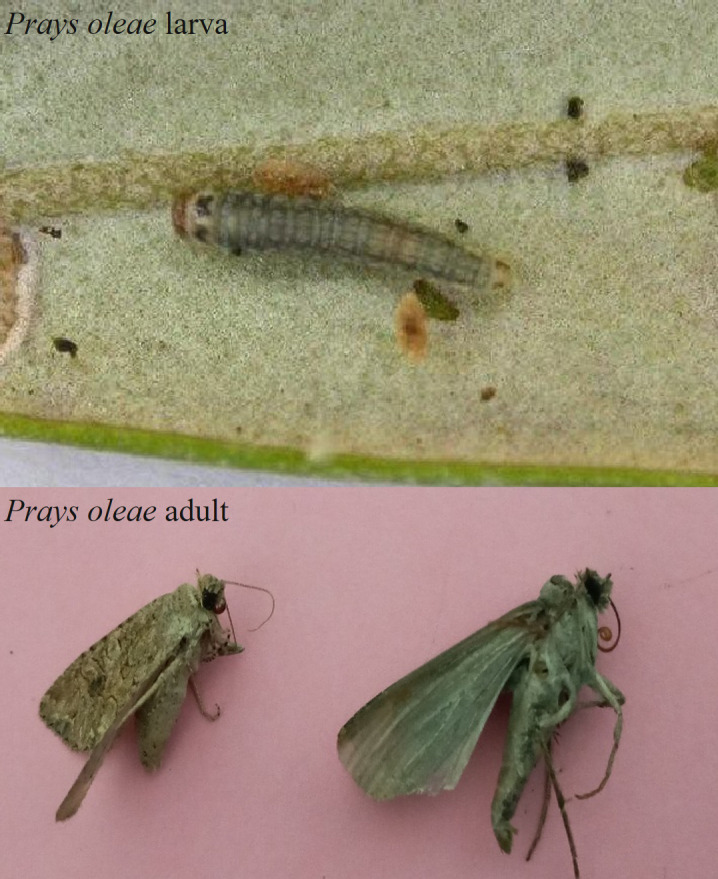 Figure 1
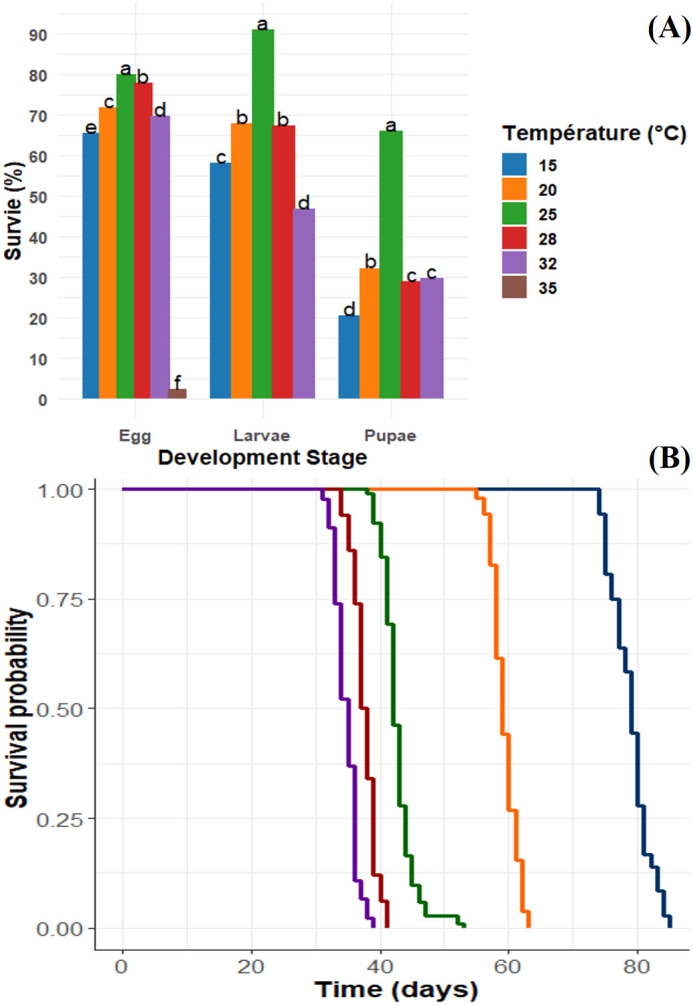 Figure 2
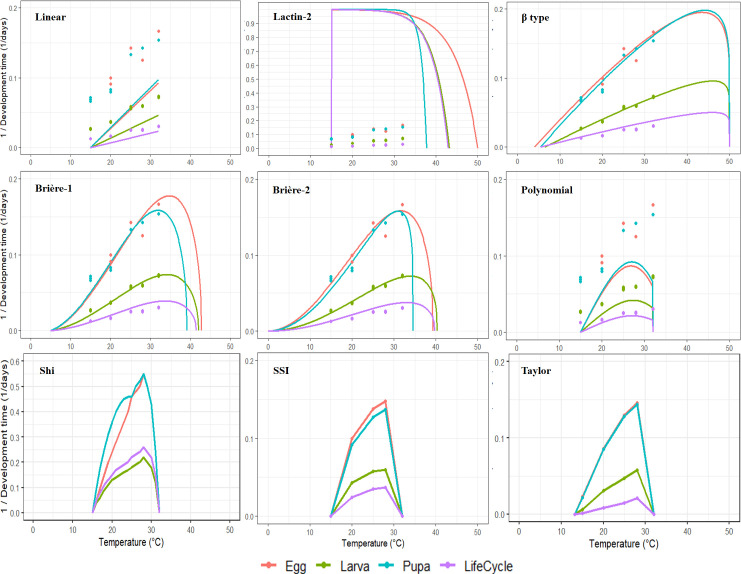 Figure 3
| Model | Function | Reference |
|---|---|---|
| Linear |
|
|
| Lactin-2 |
|
|
| β type |
|
|
| Brière-1 |
|
|
| Brière-2 |
|
|
| Polynomial |
|
|
| Shi |
|
|
| SSI |
|
|
| Taylor |
|
|
| Developmental duration (Days) | Temperature (°C) | ||||||
|---|---|---|---|---|---|---|---|
| 15 | 20 | 25 | 28 | 32 | 35 | ||
| Egg incubation | 14.1 ± 0.1A | 10.2 ± 0.1AB | 7.4 ± 0.1BC | 6.7 ± 0.1CD | 6.4 ± 0.1CD | 2.6 ± 0.1D | |
| Larva | Male | 36.3 ± 0.31Ab | 26.7 ± 0.1ABb | 18.0 ± 0.1BCb | 16.0 ± 0.1CDb | 14.2 ± 0.1Da | – |
| Female | 39.6 ± 0.1Aa | 28.1 ± 0.1 | 19.0 ± 0.2 | 16.5 ± 0.1 | 14.4 ± 0.1 | – | |
| Pupa | Male | 14.9 ± 0.2Aa | 11.0 ± 0.1ABb | 7.8 ± 0.1BCb | 7.0 ± 0.1Ca | 6.6 ± 0.1Ca | – |
| Female | 15.3 ± 0.2Aa | 12.0 ± 0.1ABa | 8.2 ± 0.1BCa | 7.2 ± 0.1Ca | 7.1 ± 0.1Ca | – | |
| Pre-adult | Male | 64.9 ± 0.6Ab | 47.7 ± 0.2ABb | 33.1 ± 0.1BCb | 29.5 ± 0.3Ca | 27.1 ± 0.3Ca | – |
| Female | 68.3 ± 0.5Aa | 50.0 ± 0.2ABa | 35.1 ± 0.3BCa | 30.4 ± 0.2CDa | 27.8 ± 0.2Da | – | |
| Adult | Male | 11.3 ± 0.2Ab | 10.2 ± 0.1ABa | 8.0 ± 0.1BCb | 7.3 ± 0.2Cb | 6.8 ± 0.1Cb | – |
| Female | 13.0 ± 0.2Aa | 10.9 ± 0.1ABa | 9.1 ± 0.1BCa | 8.0 ± 0.1Ca | 7.4 ± 0.2Ca | – | |
| Life span | Male | 76.8 ± 0.5Ab | 57.8 ± 0.2ABb | 41.2 ± 0.2BCb | 36.8 ± 0.4Cb | 34.1 ± 0.4CCa | – |
| Female | 81.2 ± 0.5Aa | 60.9 ± 0.3ABa | 44.1 ± 0.4BCa | 38.4 ± 0.2CDa | 35.4 ± 0.3Da | – | |
| Temperature (°C) | Pupal weight (mg) | Deformation(%)a | |||
|---|---|---|---|---|---|
| Female | Male | Mean | Pupaeb | Adults | |
| 15 | 7.5 ± 0.1Aa (28) | 6.4 ± 0.1Ab (31) | 7.0 ± 0.1A (28) | 10.8 (130) A | 14.9 (121) A |
| 20 | 7.0 ± 0.2Ba (32) | 6.2 ± 0.1Bb (39) | 6.6 ± 0.1B (32) | 7.7 (130) A | 1.7 (121) B |
| 25 | 6.7 ± 0.1BCa (74) | 6.1 ± 0.1BCb (78) | 6.4 ± 0.1BC (74) | 3.1 (130) B | 1.7 (121) B |
| 28 | 6.4 ± 0.1Ca (32) | 5.8 ± 0.1Cb (36) | 6.1 ± 0.1C (32) | 3.8 (130) A | 12.4 (121) A |
| 32 | 4.9 ± 0.2Da (25) | 4.4 ± 0.1Db (29) | 4.6 ± 0.1D (25) | 9.2 (130) A | 19.8 (121) A |
| Temperature (°C) | Pre-oviposition (day) | Oviposition (day) | Post-oviposition (day) | Fecundity (eggs/female) |
|---|---|---|---|---|
| 15 (20) | 4.9 ± 0.2 A | 8.5 ± 0.2 D | 1.3 ± 0.2 A | 209.7 ± 0.9 E |
| 20 (31) | 3.6 ± 0.2 B | 10.3 ± 0.2 C | 1.2 ± 0.1 A | 295.0 ± 1.6 D |
| 25 (54) | 2.5 ± 0.1 C | 12.6 ± 0.3 A | 0.9 ± 0.1 A | 380.7 ± 2.0 A |
| 28 (27) | 2.2 ± 0.2 CD | 11.8 ± 0.3 B | 0.9 ± 0.1 A | 365.2 ± 1.6 B |
| 32 (25) | 1.6 ± 0.2 D | 9.5 ± 0.2 CD | 1.1 ± 0.1 A | 299.9 ± 1.1 C |
| Model | Egg | Larvae | Pupae | Life span | ||||
|---|---|---|---|---|---|---|---|---|
| S (10−3) | S(10−3) | S(10−3) | S(10−3) | |||||
| Linear | 10.8 | 57.8 | 2.6 | 15.0 | 8.9 | 51.9 | 1.6 |
|
| Lactin-2 | 1010 |
| 1090 | 2.2 | 1030 |
| 1120 |
|
| β type | 11.6 | 15.8 | 2.8 | 15.4 | 9.5 | 51.7 | 1.7 |
|
| Brière-1 | 18.5 | 59.6 | 4.0 | 13.6 | 11.0 | 44.1 | 2.5 |
|
| Brière-2 | 13.6 | 59.1 | 3.1 | 14.4 | 10.1 | 50.2 | 1.9 |
|
| Polynomial | 28.3 | 45.2 | 11.8 | 19.1 | 26.7 | 43.5 | 6.3 |
|
| Shi | 147.6 | 44.6 | 62.2 | 18.6 | 142.8 | 43.6 | 33.4 |
|
| SSI | 140.5 | 14.8 | 59.5 | 6.2 | 135.3 | 14.5 | 31.9 |
|
| Taylor | 12.6 | 53.9 | 3.9 | 18.6 | 9.4 | 45.2 | 2.1 |
|
| Modela | Egg | Larvae | Pupae | Life span |
|---|---|---|---|---|
| Linear | ||||
|
| -0.0089 | -0.0149 | -0.0204 | -0.0060 |
|
| 0.0054 | 0.0027 | 0.0057 | 0.0014 |
|
| 1.6 | 5.5 | 3.6 | 4.3 |
|
| 183.6 | 366.0 | 174.6 | 720.1 |
| Lactin-2 | ||||
|
| 0.120 | 0.085 | 0.060 | 0.040 |
|
| 5.13 | 3.68 | 1.31 | 3.61 |
| λ | -0.050 | -0.030 | -0.020 | -0.025 |
|
| 8.0 | 10.0 | 12.0 | 9.0 |
|
| 30.0 | 33.0 | 30.0 | 33.0 |
|
| 50.0 | 43.2 | 37.8 | 42.9 |
| β type | ||||
|
| 0.0036 | 0.0021 | 0.0039 | 0.0011 |
|
| 0.16 | 0.10 | 0.15 | 0.10 |
|
| 10.6 | 10.4 | 11.3 | 9.53 |
|
| 4.1 | 6.5 | 5.5 | 5.5 |
|
| 28.0 | 30.0 | 27.0 | 29.0 |
|
| 50.0 | 43.2 | 37.8 | 42.9 |
| Brière-1 | ||||
|
| 6.1×10⁻⁵ | 2.6×10⁻⁵ | 6.8×10⁻⁵ | 1.5×10⁻⁵ |
|
| 5.0 | 5 | 5 | 5 |
|
| 34.8 | 34.2 | 31.9 | 33.8 |
|
| 42.8 | 42.0 | 39.2 | 41.5 |
| Brière-2 | ||||
|
| 5.8×10⁻⁵ | 3.1×10⁻⁵ | 1.2×10⁻⁴ | 1.6×10⁻⁵ |
|
| 2.0 | 2.7 | 4.3 | 2.5 |
|
| 8.0 | 9.0 | 7.5 | 8.5 |
|
| 31.6 | 34.0 | 31.0 | 33.0 |
|
| 39.4 | 40.3 | 34.6 | 39.7 |
| Polynomial | ||||
|
| -2.8×10⁻⁵ | -1.3×10⁻⁵ | -2.9×10⁻⁵ | -6.7×10⁻⁶ |
|
| 1.3×10⁻³ | 6.2×10⁻⁴ | 1.4×10⁻³ | 3.2×10⁻⁴ |
|
| -9.3×10⁻³ | -5.1×10⁻³ | -1.1×10⁻² | -2.6×10⁻³ |
|
| 3.0×10⁻³ | 1.6×10⁻³ | 4.2×10⁻³ | 8.4×10⁻⁴ |
|
| 26.9 | 27.3 | 27.1 | 27.1 |
| Shi | ||||
|
| -0.05 | -0.05 | -0.05 | -0.05 |
|
| 9.8×10⁻³ | 4.4×10⁻³ | 9.8×10⁻³ | 2.3×10⁻³ |
|
| 12.0 | 13.0 | 12.0 | 12.0 |
|
| 25.0 | 27.0 | 24.0 | 26.0 |
|
| 32.0 | 32.0 | 32.0 | 32.0 |
| SSI | ||||
|
| 5.0×10⁻⁴ | 4.8×10⁴ | 5.2×10⁴ | 4.7×10⁴ |
|
| -1.0×10⁴ | -9.0×10³ | -9.5×10³ | -8.5×10³ |
|
| 1.0×10⁴ | 9.5×10³ | 9.7×10³ | 9.4×10³ |
|
| 288.2 | 289.2 | 288.2 | 288.2 |
|
| 305.2 | 307.2 | 306.2 | 307.2 |
|
| 32.0 | 32.0 | 32.0 | 32.0 |
|
| 0.1667 | 0.0714 | 0.1538 | 0.0377 |
|
| 15.0 | 16.0 | 15.0 | 15.0 |
|
| 28.0 | 29.0 | 27.0 | 28.0 |
|
| 32.0 | 34.0 | 33.0 | 34.0 |
| Taylor | ||||
|
| 0.1551 | 0.0680 | 0.1535 | 0.0361 |
|
| 13.2 | 11.7 | 12.3 | 12.2 |
|
| 28.5 | 30.0 | 29.0 | 28.8 |
| Models | No. of estimated thermal thresholds | Accuracya | ||
|---|---|---|---|---|
|
|
|
| ||
| Linear | 1 | + | • | • |
| Lactin-2 | 3 | + | + | − |
| β type | 3 | + | + | + |
| Brière-1 | 3 | + | + | + |
| Brière-2 | 3 | + | + | + |
| Polynomial | 2 | • | − | + |
| Shi | 3 | + | + | + |
| SSI | 3 | − | − | + |
| Taylor | 2 | − | • | + |
Peer Reviews
No public reviews on file for this paper yet. If you reviewed it on a platform where reviews are public (OpenReview, ICLR, NeurIPS, ICML), you can paste yours below so the community can read it here.
Videos
No videos yet. Explain this paper in a talk, walkthrough, or lecture? Add one.
Taxonomy
TopicsInsect Pheromone Research and Control · Insect behavior and control techniques · Insect-Plant Interactions and Control
Introduction
1
The olive moth, Prays oleae (1) (Lepidoptera: Praydidae), is a key pest of olive groves in the Mediterranean basin, the Black Sea region, the Middle East, and the Canary Islands (2, 3). Worldwide, it ranks as the second most destructive olive pest after the olive fruit fly, Bactrocera (Dacus) oleae (Gmelin) (Diptera: Tephritidae) (4). Being monophagous, it feeds exclusively on the olive tree (Olea europaea L.) (5). The species completes three generations per year, each exploiting a different plant structure: leaves, flowers, and fruits (2). The first generation, phyllophagous, extends from autumn to spring, during which larvae develop inside leaf mines to survive winter conditions (4). In spring, they give rise to the anthophagous generation, the shortest phase, where larvae attack flower buds—one larva may consume up to 20–30 flowers (6). The final generation, carpophagous, occurs in summer, when larvae penetrate the fruit and feed on the seeds (7). This stage is the most harmful, as it causes premature fruit drop and substantial yield reductions (4). Economic losses caused by P. oleae can be severe. In Andalusia (southern Spain), outbreaks occur roughly every three years, with production losses reaching 50–60% and fruit drop around 40% (4, 8). More broadly, reported yield reductions attributed to this pest range between 49% and 63% (8, 9).
The management of P. oleae relies on integrated strategies combining chemical, biological, and cultural measures (10). Biological control is central, particularly the parasitoid Opius concolor Szépl. (Hymenoptera: Braconidae), along with the predator Chrysoperla carnea (Stephens) and microbial insecticides such as Bacillus thuringiensis Berliner (Bacillales: Bacillaceae) (11–13). Complementary tools—such as toxic traps, the ECO-TRAP system, copper-based products, and improved monitoring and modeling—enhance control while reducing reliance on bait sprays (14–16). In Morocco, integrated management combines B. thuringiensis, C. carnea, and parasitoids such as Chelonus eleaphilus Silv. (Hymenoptera: Braconidae), with cultural practices like plowing and ammonium sulfate trapping (12, 17), while in Greece*, B. thuringiensis*, C. carnea, and O. concolor are key tools for reducing pesticide use (13, 18). However, environmental variability, especially temperature, and difficulties in sampling large areas quickly limit the precise application of these control measures (19).
Temperature is a critical factor influencing the development, survival, reproduction, and population dynamics of ectothermic insects (20). It can also disrupt synchrony between pests and their hosts, alter interspecific interactions, and shift species’ distribution ranges, with implications for invasions (21–23). Understanding temperature effects on insect development is therefore essential for predicting field population dynamics (24). High temperatures above 30 °C reduce the mobility of P. oleae larvae and hinder their ability to penetrate olive fruits, although the exact thermal maximum causing mortality for any life stage is still unknown (19). Low temperatures below 10 °C slow the activity of adult P. oleae, and mortality can occur below 7 °C (19). Larval and pupal mortality is also closely linked to the number of days with subzero temperatures (25).
Mathematical models are widely used to study insect biology, particularly to understand how development rates respond to temperature (26–28). Insects typically exhibit a non-linear temperature-dependent development pattern: rates increase above the lower thermal threshold (T_L_) up to an optimum temperature (T_opt_) and then decline to zero at the upper thermal threshold (T_H_) (26). Although development peaks at T_opt_, this temperature may not be optimal for survival or population growth (29). Some models estimate additional parameters, such as the intrinsic optimum temperature, which better reflect conditions for development, survival, and reproduction (30). Because thermal thresholds vary among species, selecting an appropriate model to describe temperature-dependent development is crucial (31). Once a suitable model is chosen, insect development can be simulated under field conditions using temperature time series data (32). Timing of control measures is critical because insecticides are often more effective against specific life stages; poor timing can lead to ineffective pest management (29, 33). Accurate phenology models help align control measures with vulnerable pest stages, reducing pesticide use and environmental impact while providing economic benefits (33, 34). This approach has been successfully applied to multiple agricultural and forest pests (29, 33).
Although the effects of temperature on Prays oleae development and reproduction have been previously studied (19, 35, 36), these studies relied on artificial diets and narrow temperature ranges, limiting the use of non-linear models (29). Moreover, thermal thresholds were often estimated using linear regression despite the insect’s non-linear response to temperature (36). With P. oleae becoming a major olive pest under climate change, its temperature-dependent development remains poorly understood, particularly regarding the selection of appropriate mathematical models. This study therefore aimed to evaluate the effects of temperature on the development, survival, and reproduction of P. oleae and to identify suitable models describing its temperature-dependent development rates.
Materials and methods
2
Insect collection and rearing
2.1
Larvae and pupae of P. oleae were collected from olive orchards in Zemamra, Morocco (32°37′48″ N, 8°42′0″ W; 165 m a.s.l.). Collected larvae were transferred to the laboratory and maintained in mesh cages (50 × 50 × 50 cm), where they were supplied daily with fresh, pesticide-free olive leaves. Pupae obtained from the cages, along with a single batch of pupae collected directly from the field, were transferred into new mesh cages with the same characteristics (50 × 50 × 50 cm) until adult emergence. All experimental insects were reared under laboratory conditions for three consecutive generations (G_1_–G_3_) before being used in experiments, and no additional insects were collected from the field. Adults were provided with a cotton pad soaked in 10% sugar solution, which was refreshed every two days. For oviposition, pesticide-free olive shoots and leaves were introduced into the cages and replaced daily to collect freshly laid eggs. These eggs were then used in subsequent experiments. Voucher specimens of P. oleae were identified following 1 and deposited in the insectarium of the National Institute of Agricultural Research (INRA), Zemamra (Figure 1).
Morphological characteristics of Prays oleae showing the larval stage on leaf tissue and the adult moth.
Effect of temperature on the development and survival of Prays oleae
2.2
Eggs obtained from the stock colony (G_3_) were used to assess the effects of temperature on the development and survival of P. oleae. Individuals were kept from egg to adult stage in temperature-controlled chambers at constant temperatures of 15, 20, 25, 28, 32, and 35 ± 1 °C, 60 ± 10% RH, and a 12:12 h light/dark photoperiod. Each temperature was maintained in a separate, independently controlled chamber, and each chamber constituted one independent experimental unit. Temperature treatments were not alternated within the same chamber during the experiment. Each temperature chamber represented an independent experimental unit, and individuals within chambers were treated as independent biological replicates. Egg development was evaluated at all tested temperatures, including 35 °C, to determine embryonic tolerance to high-temperature stress. However, although eggs hatched at 35 °C, larvae failed to survive beyond the early stage. Because complete post-embryonic development could not be obtained at 35 °C, this temperature was excluded from larval, pupal, and total immature development analyses, as well as from stage-specific temperature–development modeling where full life-stage data were required. To assess the effects of temperature on embryonic development, 20 newly laid eggs, aged < 12 h, were separated using a fine-tipped brush and kept in 80-mL plastic vials lined with paper towels. This procedure was repeated 15 times for each temperature evaluated. Each vial constituted one independent replicate, and no vial was reused across temperature treatments to avoid pseudoreplication. The number of hatched larvae was recorded daily to determine the incubation period and egg survival rate. The survival and development of larval and pupal stages were evaluated using 20 newly hatched larvae (< 12 h), individually placed in 150-mL plastic vials for each temperature. This procedure was repeated 15 times for each temperature evaluated. Larvae were reared individually to ensure statistical independence and to avoid pseudoreplication. Each larva represented one independent biological replicate, and individuals were maintained exclusively within their assigned temperature chamber throughout development. Larvae were provided with fresh, pesticide-free olive leaves (cv. Picholine marocaine), the preferred host plant. Food was replaced daily, rearing vials were cleaned, and surviving individuals and their developmental stage were recorded. The survival and development time of immature stages, pupal weight, and the presence of deformities in pupae and adults were used as biological parameters to assess the effects of temperature on P. oleae development. Pupae were sexed by examining the terminal abdominal segments under a stereomicroscope: females were identified by the presence of a broad, slit-like genital opening on the ventral side of the ninth abdominal segment, while males were recognized by a smaller, rounded anal opening and the presence of claspers or genital papillae (35). Each pupa was weighed individually using an analytical balance (Sartorius, Germany) and inspected for deformities 48 h after pupation. Pupae were considered deformed when showing elongated abdominal segments, abnormal wing development, or atypical head structures (29). Adults with malformed wings or those unable to emerge from their pupal exuviae were also recorded as deformed.
Effect of temperature on reproduction of Prays oleae
2.3
Newly emerged adults (<24 h old) obtained from the stock colony were used to assess the effects of temperature on reproduction. Adults were reared at permissive temperatures (15–32 °C) but then exposed to 35 °C for reproduction experiments to evaluate adult performance under high-temperature stress. Although 35 °C did not allow successful completion of immature development, it was included in the reproductive experiment to evaluate adult performance and reproductive capacity under acute high-temperature stress conditions. Reproductive experiments were conducted in separate, independently controlled temperature chambers (15, 20, 25, 28, 32, and 35 ± 1 °C), each considered an independent experimental unit. Each pair of male and female was placed in a plastic container (11 × 7 × 3 cm) containing a cotton pad soaked in 10% sugar solution and a pesticide-free olive leaf (cv. Picholine marocaine) as an oviposition substrate. If a male died before the female, he was replaced with a healthy male of the same age to maintain continuous mating. Each mating pair constituted one independent biological replicate, and containers were not transferred between temperature treatments. Containers were maintained at constant temperatures of 15, 20, 25, 28, 32, and 35 ± 1 °C, 60 ± 10% RH, and a 12:12 h light/dark photoperiod. Each temperature treatment was replicated 15 times. Oviposition substrates were replaced daily, and the number of eggs laid by each female was recorded until her death. Eggs from each female were collected, placed individually in small containers, and monitored for hatching to determine egg viability (eggs that successfully hatched into larvae). Reproductive parameters, including pre-oviposition period, oviposition period, post-oviposition period, total fecundity (eggs per female), and egg hatch rate, were used to evaluate the effects of temperature.
Selection and evaluation of mathematical models
2.4
The development durations of P. oleae at the different tested temperatures were used to determine the thermal thresholds and to model the temperature–development relationship. One linear and eight non-linear models, previously reported in the literature, were applied to the observed development rates (1/development time) for each immature stage (egg, larva, pupa) and for the total life cycle duration (Table 1). Only temperature levels with successful development were included for each stage-specific model. The models were fitted in the R environment using R software version 4.3.2, following the method described by Ikemoto et al. (41).
The linear model was used to estimate the lower developmental threshold (T_L_) and the thermal constant (K), representing the total heat units necessary for P. oleae to complete development from one stage to the next. T_L_ was calculated as the x-intercept (T_L_ = −a/b), and K as the reciprocal of the slope (K = 1/b). Data obtained at 35 °C were excluded from the linear model analysis because eggs failed to develop at this temperature, exceeding the linear range of the temperature–development relationship. For nonlinear models, data at 35 °C were included only for eggs, but excluded for larval, pupal, and total development stages because eggs did not continue development at this temperature.
The non-linear models varied in complexity according to the number of parameters to be fitted. Simple models such as β type and Brière-1 require three parameters, whereas more complex models, including SSI, have seven parameters (Table 1). Models were evaluated with consideration of parameter identifiability relative to the number of temperature levels available for each developmental stage. Models such as Brière-1, Brière-2, Lactin-2, Shi, and SSI allow direct estimation of T_L_, optimum temperature (T_opt_), and upper thermal threshold (T_H_), while others estimate only T_opt_and T_H_ (β type), or T_L_ alone (Linear).
Model performance was evaluated based on goodness-of-fit and the capacity to produce biologically realistic thermal thresholds. Goodness-of-fit was measured using the standard error of the regression (S), and the overall quality of each model was further assessed with the corrected Akaike Information Criterion (AICc):
Where n corresponds to the number of temperature treatments (mean development rates) included in the model for a given developmental stage, not the number of individual insects or replicates (for eggs, n= 6 (15, 20, 25, 28, 32, and 35 °C), while for larvae, pupae, and the total immature stage, n= 5 (15, 20, 25, 28, and 32 °C) because development did not continue at 35 °C), RSS is the residual sum of squares, and k is the number of model parameters. Models were fitted using the mean development rate at each temperature; thus, n represents the number of temperature treatments rather than individual or replicate-level observations. Lower AICc values indicate better model performance. Additionally, ΔAICc was calculated as the difference between each model’s AICc and the lowest AICc for the same developmental stage. Values of ΔAICc ≤ 2.0 indicate comparable performance.
The thermal thresholds considered in this study were the lower (T_L_) and upper (T_H_) developmental thresholds and the optimum temperature (T_opt_). The estimated thresholds were validated against observed data and the known geographical and ecological range of P. oleae. Thresholds outside the biologically plausible ranges (6–15 °C for T_L_, 25–32 °C for T_opt_, and 30–38 °C for T_H_) were considered unrealistic. Preference was given to models that provided thermal estimates consistent with P. oleae biology.
Statistical analysis
2.5
The development time of P. oleae (egg, larval, pupal, total immature duration, adult longevity, and total life span) at different temperatures was compared using the Kruskal–Wallis test at a 5% significance level. This non-parametric approach was chosen to avoid assumptions of normality and homoscedasticity. When significant differences were detected, Dunn’s post hoc test (P < 0.05) was applied for pairwise comparisons, with P-values adjusted using the Bonferroni correction to account for multiple comparisons. The durations of males and females for each developmental stage were also compared using the Kruskal–Wallis test at the same significance level. The incidence of deformations in pupae and adults (e.g., malformed wings, abnormal pupal shape, or failure to emerge) was compared across temperatures using contingency tables and the chi-square test at a significance level of 5%. Pupal weights were first tested for normality (Shapiro–Wilk test) and homogeneity of variances (Levene’s test). After confirming assumptions, one-way ANOVA was performed to test the effect of temperature on females, males, and the combined mean. Post hoc comparisons among temperatures were conducted using Tukey’s LSD test. In addition, pupal weights of males and females within each temperature were compared using a two-sample t-test, with P-values were adjusted to account for repeated t-tests across temperatures. The survival of immature stages (egg, larva, and pupa), as well as the pre-oviposition, oviposition, and post-oviposition periods and total fecundity (eggs per female), were analyzed using generalized linear models (GLMs). For survival, a binomial distribution with a logistic link function was applied and reported R² values correspond to pseudo-R² (McFadden’s R²), reflecting the proportion of deviance explained by the model relative to a null model. F-tests were applied within the Gaussian GLM framework for continuous traits (pre-oviposition, oviposition, post-oviposition, total fecundity, and egg hatch rate) to test temperature effects. Non-Gaussian response variables were analyzed using the appropriate link functions, and R² or F-tests were not interpreted for these models. When significant differences among temperatures were detected, pairwise comparisons were conducted using Tukey’s test at a 5% significance level. Survival curves at each temperature were estimated using the Kaplan–Meier method and compared with the log-rank test. All statistical analyses were carried using R software version 4.3.2 with the MASS package for GLMs and the survival package for Kaplan–Meier analyses. A significance threshold of α = 0.05 was applied for all tests.
Results
3
Effects of temperature on the development and survival of Prays oleae
3.1
Developmental times of the egg (χ² = 53.5; df = 5; P < 0.01), larval (male χ² = 46.4; df = 4; P < 0.01, female χ² = 45.8; df = 4; P < 0.01), and pupal stages (male χ² = 42.4; df = 4; P < 0.01, female χ² = 45; df = 4; P < 0.01), as well as the pre-adult (male χ² = 44.5; df = 4; P < 0.01, female χ² = 46.2; df = 4; P < 0.01) and adult stages (male χ² = 42.5; df = 4; P < 0.01, female χ² = 41; df = 4; P < 0.01) and overall life span (male χ² = 44.5; df = 4; P < 0.01, female χ² = 46; df = 4; P < 0.01), were significantly affected by temperature (Table 2). In general, development duration decreased with increasing temperature between 15 and 32 °C. Egg incubation ranged from 14.1 days at 15 °C to 2.6 ± 0.1 days at 35 °C. Although eggs hatched at 35 °C, larvae did not survive beyond the early stage, so this temperature was excluded from post-embryonic development analyses. Larval development was longer in females than males across all temperatures, ranging from 36.3 days (male) and 39.6 days (female) at 15 °C to 14.2 days (male) and 14.4 days (female) at 32 °C. Pupal duration ranged from 14.9 days (male) and 15.3 days (female) at 15 °C to 6.6–7.1 days at 32 °C, with males generally developing faster than females, except at 20 °C and 25 °C, where no significant differences were recorded. Total pre-adult development was shorter at higher temperatures, with males completing development slightly faster than females (64.9 vs. 68.3 days at 15 °C; 27.1 vs. 27.8 days at 32 °C), except at 28 °C and 32 °C. Adult longevity and life span also decreased with increasing temperature, with males living slightly shorter than females at each temperature (adult longevity: 11.3, 10.2, 8.0, 7.3, 6.8 days for males and 13.0, 10.9, 9.1, 8.0, 7.4 days for females at 15, 20, 25, 28, and 32 °C, respectively; total life span: 76.8, 57.8, 41.2, 36.8, 34.1 days for males and 81.2, 60.9, 44.1, 38.4, 35.4 days for females at 15, 20, 25, 28, and 32 °C, respectively). Overall, these results indicate that temperature strongly influences the developmental duration of P. oleae, with females generally exhibiting longer pre-adult and total developmental durations than males.
Except for eggs at 35 °C, which hatched but did not continue development, P. oleae completed development from egg to adult at all other temperatures tested (Figure 2A). Temperature significantly affected survival at all stages. Egg survival was strongly influenced by temperature (F_4_,84 = 3535.16, P < 0.001, R² = 0.995), with the highest mean survival observed at 25 °C (79.93%) and the lowest at 15 °C (65.53%) and 32 °C (69.73%). Larval survival also varied significantly across temperatures (F_4_,70 = 2141.77, P < 0.001, R² = 0.992), reaching a maximum at 25 °C (90.87%) and a minimum at 32 °C (46.80%). Pupal survival was significantly affected by temperature as well (F_4_,70 = 2634.60, P < 0.001, R² = 0.993), with the highest survival at 25 °C (66.00%) and lowest at 15 °C (20.67%). Kaplan–Meier survival analysis confirmed these patterns, showing that survival decreased at extreme temperatures (Figure 2B). The median lethal time (LT_50_) and mean survival time were highest at 15 °C (LT_50_ = 79 days; mean survival = 73.6 days) and lowest at 32 °C (LT_50_ = 35 days; mean survival = 33.1 days), indicating faster mortality at higher temperatures. Overall, survival followed a bell-shaped trend, with optimal survival at moderate temperatures (20–25 °C) and increased mortality at temperature extremes.
Survival of Prays oleae reared at different constant temperature regimes. (A) Survival (%) followed by the same lowercase letters in each development stage are not statistically different according to the generalized linear models and Tukey's test at a significance level of 5%.(B) Survival curves were generated with non-parametric Kaplan–Meier analysis.
Effects of temperature on pupal weight and deformities of Prays oleae
3.2
Pupal weight of P. oleae was significantly affected by temperature and sex (Table 3). The results showed a significant effect of temperature for females (F_4_,186; = 38.73, P < 0.001) and males (F_4_,208 = 62.40, P < 0.001), as well as for the combined mean pupal weight (F_4_,186; = 83.82, P < 0.001). In all cases, females were significantly heavier than males at each temperature (15 °C (7.50 mg vs 6.40 mg; t = 6.53, df = 57.5, P = 1.87×10⁻^8^), 20 °C (6.94 vs 6.21 mg; t = 4.03, df = 53.2, P = 1.81×10⁻^4^;), 25 °C (6.69 vs 6.08 mg; t = 6.03, df = 91.3, P = 3.51×10⁻^8^), 28 °C (6.39 vs 5.85 mg; t = 2.87, df = 59.6, P = 0.0057), and 32 °C (4.88 vs 4.40 mg; t = 2.12, df = 45.8, P = 0.039). Pupal weight decreased progressively with increasing temperature, with the heaviest pupae recorded at 15 °C and the lightest at 32 °C. The percentage of deformed pupae was marginally affected by temperature (χ² = 9.07; df = 4; P = 0.059), ranging from 3.1% at 25 °C to 10.8% at 15 °C, with intermediate values of 7.7% at 20 °C, 3.8% at 28 °C, and 9.2% at 32 °C. In contrast, adult deformities were strongly influenced by temperature (χ² = 35.44; df = 4; P = 3.77×10⁻^7^), with the highest percentages observed at 15 °C (14.9%), 28 °C (12.4%), and 32 °C (19.8%), and considerably lower values at 20 °C and 25 °C (1.7%). Overall, these results indicate that increasing temperature reduces pupal weight in both sexes while females remain consistently heavier than males at all temperatures (Table 3). Although pupal deformities were largely unaffected by temperature, adult deformities increased at both low (15 °C) and high (28–32 °C) temperatures, highlighting the sensitivity of adult morphology to thermal stress.
Effect of temperature on the reproductive parameters of Prays oleae
3.3
The reproductive performance of P. oleae females was strongly influenced by temperature (Table 4). Pre-oviposition duration decreased significantly as temperature increased, ranging from 4.9 ± 0.2 days at 15 °C to 1.6 ± 0.2 days at 32 °C (F_4_,70 = 42.92, P < 0.001, R² = 0.710), indicating faster onset of egg-laying at higher temperatures. Oviposition period varied significantly with temperature (F_4_,70 = 42.01, P < 0.001, R² = 0.706), being longest at 25 °C (12.6 days) and shortest at 15 °C (8.5 days). Post-oviposition duration showed a minor but significant effect of temperature (F_4_,70 = 2.53, P = 0.048, R² = 0.126), ranging from 0.9 ± 0.1 days at 25–28 °C to 1.3 days at 15 °C. Fecundity was strongly influenced by temperature (F_4_,70 = 2063.82, P < 0.001, R² = 0.992), reaching a maximum at 25 °C (380.7 eggs/female) and decreasing at lower (209.7 eggs/female at 15 °C) and higher temperatures (299.9 eggs/female at 32 °C). Adults were also exposed to 35 °C to evaluate reproductive performance under high-temperature stress; however, data at 35 °C are not included in Table 4 because eggs laid at this temperature did not continue development, and therefore stage-specific comparisons could not be made. Overall, reproductive activity followed a bell-shaped trend with optimal performance at moderate temperatures (25–28 °C) and reduced reproduction at temperature extremes.
Selection and performance of mathematical models
3.4
The performance of nine mathematical models describing the temperature-dependent development of P. oleae varied across developmental stages (Tables 5–7, Figure 3). Model fit was evaluated using the regression standard error (S) and the corrected Akaike information criterion (ΔAICc). For egg development, Lactin-2 had the lowest ΔAICc (0.0), indicating the best statistical fit, although the standard error (S = 1010 × 10⁻³) was high. Linear (ΔAICc = 57.8, S = 10.8 × 10⁻³), Brière-2 (ΔAICc = 59.1, S = 13.6 × 10⁻³), Brière-1, Taylor, Polynomial, β-type, Shi, and SSI had higher ΔAICc values, reflecting lower relative accuracy. For the SSI model applied to eggs, the number of fitted parameters (k = 7) slightly exceeded the number of temperature treatments minus 1 (n − k − 1 < 0), so AICc should be interpreted cautiously; this model was included for comparison only. Thermal thresholds varied across models: T_L_ ranged from 1.6 °C (Linear) to 15 °C (SSI), T_H_ from 37.8 °C (Lactin-2) to 50 °C (β-type), and T_opt_ from 28–34.8 °C. For larval development, Lactin-2 again performed well (ΔAICc = 2.2, S = 1090 × 10⁻³), followed by Linear (ΔAICc = 15.0, S = 2.6 × 10⁻³) and β-type (ΔAICc = 15.4, S = 2.8 × 10⁻³). Thermal thresholds ranged from T_L_ = 5.5 °C (Linear) to 16 °C (SSI), T_H_ from 37.8 °C (Lactin-2) to 43.2 °C (β-type), and T_opt_ from 29–34 °C. For pupal development, Lactin-2 provided the best fit (ΔAICc = 0.4, S = 1030 × 10⁻³), followed by SSI (ΔAICc = 14.5, S = 135.3 × 10⁻³). Thermal thresholds ranged from T_L_ = 3.6 °C (Linear) to 15 °C (SSI), T_H_ from 37.8 °C (Lactin-2) to 50 °C (β-type), and T_opt_ from 27–31 °C. For the complete life cycle, most models (Linear, β-type, Brière-1, Brière-2, Shi, SSI, Taylor, Polynomial) had ΔAICc = 0, indicating similarly good performance, while Lactin-2 had ΔAICc = 3.0, slightly higher but still acceptable. Thermal thresholds for the full life cycle ranged from T_L_ = 4.3 °C (Linear) to 15 °C (SSI), T_H_ from 39.7 °C (Brière-2) to 42.9 °C (Lactin-2), and T_opt_ from 28–33 °C. Some models produced unrealistic thresholds, such as Taylor (T_L_ = 11.7 °C for larvae) and SSI (T_H_ exceeding observed temperature range). In contrast, Brière-1, Brière-2, β-type, and Shi consistently produced biologically reasonable thresholds aligned with observed development times and known species distribution (Table 7). Considering both goodness-of-fit and accuracy of thermal thresholds, Brière-2 emerged as the most suitable model, followed by Brière-1, β-type, and Shi, for describing the temperature-dependent development of P. oleae.
Fitted curves of mathematical models describing the temperature-dependent development rates of Prays oleae for egg, larval, pupal stages, and the complete life cycle.
Discussion
4
Temperature strongly influenced the development, survival, and reproduction of Prays oleae, as observed in other Lepidoptera, including olive pests such as Palpita unionalis (Hübner) (Lepidoptera: Pyralidae) (43–45) and generalists like Spodoptera eridania (Stoll) (Lepidoptera: Noctuidae) (29, 46, 47). Development accelerated with increasing temperature (15–32 °C), lifespan decreased at higher temperatures, and females developed more slowly than males, particularly in the larval stage. Sex-specific patterns, with females developing more slowly than males, likely result from differential resource allocation, where females invest more time in growth and nutrient storage to enhance fecundity, while males develop faster to increase early mating success. These patterns are consistent with observations in other Lepidoptera, including P. unionalis (21, 23, 45, 48). Prays oleae was unable to complete development at 35 °C, showing that this temperature exceeds its upper thermal threshold, likely due to protein denaturation, impaired enzyme activity, or hormonal disruption (20, 21). Full development occurred between 15 and 32 °C, with moderate temperatures (20-28 °C) favoring survival and growth. This upper limit is ecologically significant in Mediterranean regions, including Morocco, where high summer temperatures may naturally reduce P. oleae populations (49). Knowledge of these thermal limits is essential for predicting pest outbreaks and guiding the timing of monitoring and control measures, especially under climate change scenarios that may shift pest pressure to milder regions. Survival of P. oleae followed a bell-shaped pattern, highest at 20–25 °C and sharply reduced at 15 °C and 32 °C, with mean survival time decreasing as temperature increased. Similar bell-shaped survival curves have been documented in P. unionalis and S. eridania (Lepidoptera: Noctuidae) under laboratory conditions (29, 43, 46). Pupal weight declined at higher temperatures, with females heavier than males, reflecting sex-specific resource allocation. Reduced mass and increased adult deformities at thermal extremes likely result from shortened larval feeding and disrupted metamorphosis (20–22). These patterns highlight the species’ sensitivity to temperature and potential impacts on population growth and reproduction. Female fecundity peaked at 25 °C, declining at lower and higher temperatures, with pre-oviposition shortening at higher temperatures and oviposition longest at 25 °C. These results demonstrate that both extreme cold and heat compromise reproductive output, consistent with studies in P. unionalis and other Lepidoptera (50, 51). The alignment of optimum temperature for fecundity (25–28 °C) with highest survival suggests that population growth potential is maximized within this thermal range.
The performance of the mathematical models used to describe the temperature-dependent development rate of P. oleae varied widely, highlighting the importance of testing multiple models and applying a multicriteria selection process (31, 52, 53). Our comparison of nine temperature-dependent development models revealed that nonlinear models, particularly Brière-2, Brière-1, β-type, and Shi, best described development across stages and produced biologically reasonable thermal thresholds. Most models had (n − k − 1) positive, ensuring valid AICc calculations, with the exception of the SSI model applied to eggs (k = 7, n − k − 1 < 0), for which the AICc should be interpreted cautiously. Several models showed ΔAICc = 0, not because their performance was identical, but due to the small number of temperature treatments per stage (n = 5–6), which limits the effective sample size and produces very small differences in AICc that were rounded in Table 5. This underscores the importance of evaluating both statistical fit and biological plausibility when selecting models, rather than relying solely on ΔAICc. The linear model underestimated upper thresholds, while SSI and Taylor models occasionally predicted unrealistic temperatures. These results align with the literature, which emphasizes the superior performance of nonlinear models in capturing the asymmetric, curvilinear nature of temperature-development relationships in insects (24, 26–29). This approach reinforces the notion that selecting models solely based on statistical performance can be misleading; including accuracy of thermal thresholds provides fundamental information for predicting insect occurrence under field conditions (46, 54). Since their introduction in 1995 and 1999, the Brière-2 and Lactin-2 models have been widely applied to describe the development rates of arthropods (29). These models have demonstrated consistent suitability across a variety of species (53, 55–58). In contrast, the model developed by Shi et al. (40) has been applied in relatively few studies, likely due to its more recent publication. Thermal thresholds of P. oleae varied among models and stages: pupal T_L_ ranged from 3.6 °C (Linear) to 15 °C (SSI), egg–adult T_L_ from 4.3 °C to 15 °C, T_opt_ from 24 °C (Shi, pupae) to 34 °C (Brière-2, larvae), and T_H_ from 32 °C (Shi) to 50 °C (β-type, eggs). Development failed at 35 °C, indicating this exceeds the species’ upper limit. Moderate temperatures of 20–30 °C support optimal development, while below 10–15 °C or above 34–35 °C restrict growth. Overall, the optimal temperature is 27–29 °C. This is consistent with previous observations in related Lepidoptera (43, 46). The T_Φ_ from the SSI model indicates the temperature of maximal enzyme activity, reflecting optimal conditions for development, survival, and reproduction. Estimated T_Φ_ values of 32 °C for larval, pupal, and egg–adult stages support an overall optimal range of 25–32 °C for P. oleae, consistent with other Lepidoptera such as P. unionalis and S. eridania, which also perform best at moderate temperatures (25-30 °C) and show sharply reduced survival at thermal extremes (15–40 °C) (29, 48). Comparisons among studies should be conducted carefully due to methodological differences, including the rearing substrate and the temperature range assessed. In our study, we reared P. oleae on olive leaves under controlled laboratory conditions, whereas other studies on related Lepidoptera often used different host plants or artificial diets (43, 46). Furthermore, we evaluated P. oleae development over a broader temperature range (15–35 °C) than most previous studies, which allowed us to capture both the lower and upper thermal thresholds for development. These methodological differences likely contributed to variation in estimated thermal parameters. For instance, the lower developmental threshold (T_L_) estimated in this study for the egg stage was 1.6 °C (Linear model), which is lower than the T_L_ reported for other Lepidoptera such as S. eridania (10.8 °C) (29, 48). Similarly, the thermal constant (K) for the egg–adult cycle of P. oleae ranged from 174.6 to 720.1 degree-days depending on the model, reflecting the influence of methodological and modeling choices on parameter estimation. While it remains unclear whether these differences are primarily due to the range of temperatures tested or the host plant used, it is widely recognized that evaluating insect development across a broad temperature range yields more robust and reliable estimates of thermal thresholds (59). The selected mathematical models can be applied to pest management programs by simulating P. oleae development under field conditions and predicting periods of high vulnerability for control interventions. Accurate modeling may help optimize the timing of biological or chemical control applications, reducing environmental impact and increasing efficacy, as successfully demonstrated in other Lepidoptera such as Tuta absoluta (Meyrick) (Lepidoptera: Gelechiidae), and Grapholita molesta (Busck) (Lepidoptera: Tortricidae) (28, 33). However, field validation is necessary, particularly because model predictions depend on accurate host plant phenology, initial population observations, and local temperature fluctuations (29). Thermal thresholds and TΦ values suggest optimal performance at 25–32 °C, with sharply reduced survival and reproduction at extremes, offering mechanistic insights into temperature-dependent population dynamics. By integrating broad-range thermal responses with multiple model comparisons, this study provides novel predictive tools for simulating P. oleae phenology and optimizing the timing of management interventions. Future field validation should examine cultivar- and microclimate-specific effects to refine model predictions under natural conditions.
Conclusion
5
Our study demonstrates that the development and survival of P. oleae are strongly influenced by temperature. Model-based estimates of thermal thresholds indicate that the species has a lower developmental limit (T_L_) ranging from 1.6–15.0 °C depending on life stage and model, an optimum temperature (T_opt_) between 27.0 and 34.0 °C, and an upper thermal threshold (T_H_) of 32.0–50.0 °C. P. oleae failed to complete development at 35 °C, confirming that temperatures above this limit are detrimental to its survival and development. Moderate temperatures, approximately 20–30 °C, provide the most favorable conditions for growth, survival, and reproduction. Among the models tested, nonlinear models such as Brière-2, Lactin-2, and Shi provided the most reliable estimations of thermal thresholds across life stages. These findings have practical implications for predicting population dynamics and improving the timing of integrated pest management strategies in Mediterranean olive-growing regions, including Morocco, where temperature extremes may naturally limit P. oleae populations.
The reference list from the paper itself. Each links out to its DOI / PubMed record.
- 1Bernard PJ . Section II. Des insectes qui vivent sur l’olivier. In: Mémoires pour servir à l’histoire naturelle de la Provence, vol. 2. Didot fils aîné, Paris (1788). p. 265–319.
- 2Alves JF Mendes S Alves da Silva A Sousa JP Paredes D . Land-use effect on olive groves pest Prays oleae and on its potential biocontrol agent. Chrysoperla carnea. Insects. (2021) 12:46. doi: 10.3390/insects 12010046, PMID: 33435550 PMC 7827753 · doi ↗ · pubmed ↗
- 3Kos T ZdrilićA Čirjak D Zorica M KolegaŠ Pajač ŽivkovićI . Towards smart pest management in olives: ANN-based detection of olive moth (Prays oleae Bernard 1788). Agri Engineering. (2025) 7:200. doi: 10.3390/agriengineering 7070200, PMID: 41725453 · doi ↗
- 4Lantero E Matallanas B Callejas C . Current status of the main olive pests: Useful integrated pest management strategies and genetic tools. Appl Sci. (2023) 13:12078. doi: 10.3390/app 132112078, PMID: 41725453 · doi ↗
- 5Tiring G Ada M Ada M Dona R KalkanÇ. Satar S . The population fluctuation of Prays oleae Bern (Lepidoptera: Praydidae, Yponomeutidae) in three different olive orchards. Çukurova Tarım ve Gıda Bilimleri Dergisi. (2024) 39:367–74. doi: 10.36846/CJAFS.2024.156 · doi ↗
- 6Armendàriz I De La Iglesia Santiago Y Campillo G Alberte C Miranda L . Ciclo del Prays del olivo (Prays oleae Bern.) en Arribes del Duero. Boletin Sanidad Vegetal. Plagas. (2007) 33:443–55.
- 7Villa M Santos SA Sousa JP Ferreira A da Silva PM Patanita I . Landscape composition and configuration affect the abundance of the olive moth (Prays oleae, Bernard) in olive groves. Agriculture Ecosyst Environ. (2020) 294:106854. doi: 10.1016/j.agee.2020.106854, PMID: 41802445 · doi ↗
- 8Ramos P Campos M Ramos JM . Long-term study on the evaluation of yield and economic losses caused by Prays oleae Bern. in the olive crop of Granada (southern Spain). Crop Prot. (1998) 17:645–7. doi: 10.1016/S 0261-2194(98)00065-9, PMID: 41276264 · doi ↗